Wear Life Testing of a Mission Critical Separation Interface ... - esmats
Wear Life Testing of a Mission Critical Separation Interface ... - esmats
Wear Life Testing of a Mission Critical Separation Interface ... - esmats

Create successful ePaper yourself
Turn your PDF publications into a flip-book with our unique Google optimized e-Paper software.
<strong>Wear</strong> <strong>Life</strong> <strong>Testing</strong> <strong>of</strong> a <strong>Mission</strong> <strong>Critical</strong> <strong>Separation</strong> <strong>Interface</strong><br />
Jonathan P. Wood * and Joseph de la Fuente*<br />
Abstract<br />
This paper covers the wear life validation testing performed for a mission critical separation interface. The<br />
test was performed for the purpose <strong>of</strong> risk reduction, to demonstrate wear life margin prior to performing<br />
<strong>of</strong>ficial qualification testing. The following is an overview <strong>of</strong> the mechanism, the design rationale <strong>of</strong> the<br />
test equipment and method, the test results, and the lessons learned. In addition to the specifics <strong>of</strong> the<br />
test, the implications <strong>of</strong> the test data on the design <strong>of</strong> launch lock mechanisms are discussed.<br />
Introduction<br />
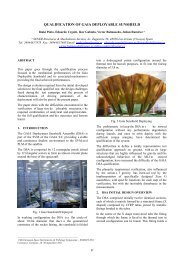
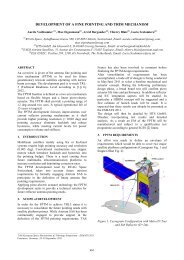
The LLA (Launch Lock Assembly) is the mechanism used to restrain and deploy a large Payload Wing<br />
during its launch and mission sequence. The two halves <strong>of</strong> the LLA are mated by a preloading element in<br />
order to stow the payload wing for launch, as shown in Figure 1. These two halves separate by releasing<br />
the preload. This necessitates a separable joint within the LLA, capable <strong>of</strong> withstanding axial and shear<br />
loading. This joint, referred to as a shear tie, is subjected to significant wear under loads during launch.<br />
After launch, the joint must separate, in order for the payload wing to function. As such, the LLA shear<br />
ties represent a mission critical interface.<br />
Due to the large mass and relatively small surface area <strong>of</strong> the payload wing, the bulk <strong>of</strong> wear that occurs<br />
during launch is due to the coupled loads between the launch vehicle and spacecraft. This creates a<br />
relatively large displacement rocking motion between the male and female shear ties at low frequencies<br />
(~20 Hz). This shear tie geometry and wear mode do not fit comfortably within heritage shear tie designs,<br />
so a unique test was devised to simulate the expected wear that would occur during ground test and<br />
launch.<br />
<strong>Separation</strong><br />
Plane<br />
Figure 1. LLA cross-section showing shear tie interface<br />
* Lockheed Martin Space Systems Company, Sunnyvale CA<br />
Proceedings <strong>of</strong> the 39 th Aerospace Mechanisms Symposium, NASA Marshall Space Flight Center, May 7-9, 2008<br />
Y<br />
X<br />
Z<br />
Male and Female Shear Tie Pair<br />
157
158<br />
Discussion <strong>of</strong> Heritage Data<br />
Flight<br />
heritage is <strong>of</strong>ten considered to be the highest level <strong>of</strong> design validation. Although this is a<br />
reasonable statement, care must be taken in using heritage designs. The use <strong>of</strong> shear ties in launch<br />
locks is a good example <strong>of</strong> this. Although the LLA shear ties are similar in overall geometry to heritage<br />
shear ties (sphere-in-cone contact geometry), the spherical radius, cone half angle, and overall size<br />
deviate from heritage designs. In addition, the wear environment for this shear tie differs from heritage<br />
environments. Similarly, the coating used on the these shear ties (Tiodize type 2 over-coated with Tiolube<br />
460), has significant heritage as a solid lubricant for space environments, but had not been used on<br />
previous Lockheed Martin shear tie designs. It was chosen for the LLA because it performed well when<br />
subjected to large-displacement wear under heavy loads in the material selection test described below.<br />
The<br />
failure mode for shear ties is coating wear-through followed by galling, cold-welding, or adhesion <strong>of</strong><br />
the base metal. In order to qualify a shear tie design by similarity, several requirements should be met.<br />
First, the same coating and substrate must be used in both applications. Second, the shear tie geometry<br />
should have the same overall configuration with a contact stress level that is enveloped by the heritage<br />
design. Finally, the wear environment for the new design or application must be enveloped by the wear<br />
environment for the heritage design.<br />
Although<br />
the LLA shear ties are <strong>of</strong>ficially qualified during spacecraft level vibration and acoustic tests, the<br />
application was considered to deviate from heritage enough to justify a development level risk-reduction<br />
wear life test. Design changes resulting from a qualification test failure (especially at the spacecraft level),<br />
have heavy cost and schedule impacts, which can <strong>of</strong>ten be prevented during the design phase by<br />
performing appropriate development testing.<br />
Flight-Like <strong>Wear</strong> <strong>Testing</strong> Background<br />
The<br />
wear life <strong>of</strong> a shear tie is sensitive its subjected wear mode, as has been shown in past testing. This<br />
conclusion was drawn because <strong>of</strong> the difference between the results <strong>of</strong> two prior tests. The first test was<br />
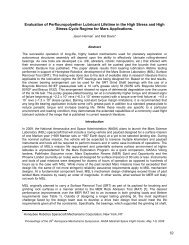
a material/coating selection test. During this test, test specimens with shear tie contact geometry were<br />
loaded into an Instron machine and cycled axially (see Figure 2). Relative motion was achieved by<br />
varying the load on the shear ties – as load increases, the contact angle causes hoop deformations which<br />
allow axial motion. A fretting distance <strong>of</strong> approximately 0.6 mm (per cycle) was achieved. A number <strong>of</strong><br />
shear tie material and coating combinations were tested using this method to evaluate the relative<br />
performance <strong>of</strong> each coating. Tiodize type 2 over-coated with Tiolube 460 was the highest performing<br />
shear tie coating in this test. The second highest performing coating is referred to as coating B. The life<br />
test data is shown in Table 1. As shown in the table, the wear life <strong>of</strong> the Tiodize coating was significantly<br />
longer and much more consistent under this wear mode than coating B.<br />
Table 1. Material selection life test results<br />
Specimens Max Load Failure<br />
Coating kN cycles<br />
Coating B 35.6 10250<br />
Coating B 35.6 6250<br />
Tiodize/Tiolube 35.6 15250<br />
Tiodize/Tiolube 35.6 15250<br />
Tiodize/Tiolube 35.6 14250<br />
At<br />
the time the material selection was coming to a close, issues with shear tie coatings for another<br />
program required that a risk-reduction flight-like validation test be performed. The material selection test<br />
had been designed to compare the performance <strong>of</strong> a number <strong>of</strong> shear tie material/coating combinations,<br />
not to simulate launch. Because shear tie wear during ground test and launch is driven by random inputs<br />
(such as acoustic loads), comparing the wear life observed during the material selection test to the actual<br />
wear environment could not be done with a sufficiently high level <strong>of</strong> confidence. It was determined that a<br />
test should be designed that simulated the flight wear environment as closely as possible. Because the<br />
application for these shear ties involved high-frequency rocking motions between the shear ties (due to
acoustic energy), a random-vibration test was performed that re-created the primary rocking wear mode.<br />
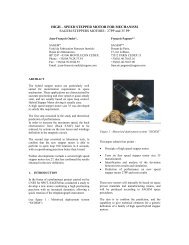
Results from this test, (with respect to the cumulated fretting distance) are shown in Table 2. Coating B<br />
consistently outperformed the Tiodize coating, which showed much higher wear levels, and localized<br />
freckles <strong>of</strong> galling. Figure 3 shows a photograph <strong>of</strong> a galled shear tie test specimen.<br />
The discrepancy between test results was surprising because the material selection test had applied the<br />
same contact stress level to the parts as the random-vibration test, and the maximum fretting distance<br />
applied during each cycle was similar between the two tests (0.6 mm for the material selection test,<br />
0.7 mm for the random-vibration test). The fretting distance at which galling occurred was also different<br />
between the two tests (7000 mm for the Tiodize coating in the material selection test, ~5000 mm for the<br />
random-vibration test.) The coatings from both tests were cross-sectioned, and parameters such as<br />
coating thickness and coating consistency were in-family with both batches <strong>of</strong> parts.<br />
Loading<br />
Male Test Specimen<br />
Female Test Specimen<br />
Figure 2. Schematic showing material selection test configuration<br />
159
160<br />
Table 2. Random-vibration wear test results<br />
Coating Relative <strong>Wear</strong><br />
Coating B Low - Moderate<br />
Coating B Low<br />
Coating B Low - Moderate<br />
Coating B Low<br />
Tiodize/Tiolube 460 Moderate-High<br />
Tiodize/Tiolube 460 Moderate<br />
Tiodize/Tiolube 460 Moderate<br />
Tiodize/Tiolube 460 High - Galling<br />
Tiodize/Tiolube 460 Moderate-High<br />
Tiodize/Tiolube 460 Moderate<br />
Tiodize/Tiolube 460 High - Galling<br />
Tiodize/Tiolube 460 Moderate<br />
By looking at the differences between the two tests, the following conclusions were drawn. First, it is<br />
important to re-create the same wear mode during a wear test – simply applying the same bulk fretting<br />
distance under the same contact stress may not provide the same result. Second, the actual geometry <strong>of</strong><br />
the mating parts (not just the contact stress), seems to influence test results. The shear tie specimens<br />
from the material selection test had a larger overall diameter, larger spherical radius, and shallower<br />
contact angle than the random-vibration test specimens. (The geometry for the material selection test<br />
coupons was based on a new shear tie design).<br />
Figure 3. Photograph showing galled test specimen (unacceptable wear pattern)
Although the contact stress level was the same for both tests, this contact stress level was achieved by<br />
applying a higher preload during the material selection test. Due to the higher preload, and the different<br />
contact geometry, the normal load distribution around the contact line was higher for the material<br />
selection test coupons. In addition, the material selection test was performed quasi-statically, and the<br />
random-vibration test applied fretting motions at roughly 80 Hertz. Based on these conclusions, the<br />
following guidelines are proposed.<br />
Flight-Like <strong>Wear</strong> Test Guidelines<br />
1. Shear tie wear testing should employ the same wear mode as the flight application.<br />
2. Shear tie wear testing should occur under the same contact stress level, and with the same<br />
normal load distribution around the contact line.<br />
3. It is recommended that test specimens employ the same contact geometry as the flight design<br />
(Same spherical radius and contact angle, at the very least).<br />
4. Although the frequency that wear cycles occur is considered to be less important than other<br />
parameters, it is good to get as close as possible to the flight wear cycle frequency.<br />
Payload Wing Shear Tie <strong>Wear</strong> Environment<br />
Due to the large mass and relatively small surface area <strong>of</strong> the Payload Wing, the bulk <strong>of</strong> wear that occurs<br />
during launch is due to the coupled loads between the launch vehicle and spacecraft. This results in a<br />
wear mode characterized by relatively large shear tie displacements (rocking about the instant-center <strong>of</strong><br />
the spherical surface) at a relatively low frequency (~20 Hz). Shear tie rocking angles are found by<br />
performing Finite Element Analysis <strong>of</strong> the next-higher-assembly. Although the coatings used for shear tie<br />
wear surfaces <strong>of</strong>ten provide low-friction surfaces, the interface cannot be accurately modeled as a<br />
frictionless ball joint. Unlike a frictionless ball joint, when a torque is applied to a shear tie joint, it will not<br />
begin to slip until friction is overcome. Conversely, the joint cannot be modeled as a rigid joint, because<br />
once slip occurs, the stiffness <strong>of</strong> the joint drops significantly. However, it is this blend <strong>of</strong> characteristics<br />
that does allow for some bounding assumptions.<br />
Rather than attempting to determine the exact rotation angle that would occur (which would be highly<br />
sensitive to the friction coefficient <strong>of</strong> the coating), the problem was bounded by finding the maximum<br />
possible rotation angle and the maximum available overturning moment. The maximum possible rotation<br />
angle was found by modeling the shear tie as a frictionless joint, and the maximum available overturning<br />
moment was found by modeling the shear tie as a rigid joint. In this case, design load factors were used<br />
to ensure test conservatism. One factor that is important in creating a truly flight-like wear test is the<br />
random nature <strong>of</strong> shear tie loads. Because the forcing function that drives the motions <strong>of</strong> the shear ties is<br />
random, the maximum fretting distance is not achieved during the entire launch sequence. Typically, the<br />
rocking angle that occurs throughout a launch event will follow a bell-curve. The test was designed with<br />
this in mind – 1, 2, and 3-sigma rocking angles were applied with a corresponding number <strong>of</strong> cycles to<br />
match the expected statistical distribution.<br />
For the rigid case, the maximum (3-sigma) moments are:<br />
� Mx: 623 N-m (5866 in-lb)<br />
� My: 333 N-m (2949 in-lb)<br />
� Mz: 787 N-m (6966 in-lb)<br />
For the zero rotational stiffness case, the maximum (3-sigma) rotations are:<br />
� �x: 0.51 deg<br />
� �y: 0.26 deg<br />
� �z: 1.75 deg<br />
Note that the coordinate system used above places the centerline <strong>of</strong> the shear ties along the X axis, per<br />
Figure 1.<br />
161
162<br />
The resultant <strong>of</strong> the rocking angles, (�y & �z), gives a total rocking angle <strong>of</strong> 1.77 degrees. Due to the<br />
arrangement <strong>of</strong> the shear ties, rotation about the shear tie centerline, (�x) to the extent shown above is<br />
not possible. Actual �x rotations are small in comparison to �y & �z.<br />
Based on this data, 1, 2, and 3-sigma loads, displacements, and cycles were defined for the wear test.<br />
These test requirements are shown in Table 3.<br />
Table 3. <strong>Wear</strong> Test Moments and Rocking Angles<br />
Case Overturning Moment Rocking Angle Cycles Frequency<br />
N-m (in-lb)<br />
deg<br />
[Hz]<br />
3 � 855 (7565) 1.77 3 1.5<br />
2 � 570 (5043) 1.18 32 5<br />
1 � 285 (2522) 0.59 145 5<br />
Test Description<br />
In order to correctly envelope the flight wear environment, the following criteria were met in the design <strong>of</strong><br />
the wear test:<br />
1. Requirement: Shear tie wear testing shall employ the same wear mode as the flight application<br />
Compliance: The test simulates the dominant wear mode, which is rocking about the instantcenter<br />
<strong>of</strong> the spherical wear surface.<br />
2. Requirement: Shear tie wear testing shall occur under the same contact stress level, and with the<br />
same normal load distribution around the contact line.<br />
Compliance: Shear Tie <strong>Testing</strong> was performed using a flight-like LLA assembly, which was<br />
preloaded to the flight preload using the flight preloading procedure.<br />
3. Requirement: The test specimens must have the same contact geometry as the flight design<br />
Compliance: Shear tie test articles were built to flight drawings & standards.<br />
4. Although the frequency that wear cycles occur is considered to be less important than other<br />
parameters, it is good to get as close as possible to the flight wear cycle frequency. The flight<br />
wear mode occurs at a low frequency (~20 Hz). <strong>Testing</strong> was performed at a low frequency, and<br />
was limited by the capability <strong>of</strong> the Instron machine to main control at high displacements.<br />
(Failure to maintain position control would result in damage to the test article). A cycling<br />
frequency <strong>of</strong> 5 Hz was achieved for 1� & 2� tests, and 3� tests were limited to 1.5 Hz due to the<br />
larger stroke.<br />
Test Conservatism<br />
The level <strong>of</strong> test conservatism applied during a wear test should be carefully considered. In the case <strong>of</strong><br />
shear ties, there is <strong>of</strong>ten a higher level <strong>of</strong> uncertainty associated with wear predictions than a typical wear<br />
prediction. In addition, solid lubricant coatings are prone to lot-to-lot variations, which demand either a<br />
larger sample size, or a higher level <strong>of</strong> conservatism. In the case <strong>of</strong> this test, there was a high level <strong>of</strong><br />
confidence that the shear ties would survive the test, so a high level <strong>of</strong> conservatism was used.<br />
Conservatism was maintained by several factors. First, design load factors were used to define the wear<br />
environment. These design loads were, on average, about 100% higher than coupled-loads analysis<br />
predictions. In addition, friction was ignored in determining the shear tie rocking angles. Finally, the<br />
number <strong>of</strong> 1-sigma cycles was doubled to account for any wear that could occur during acoustic ground<br />
tests, which resulted in the 145 cycles shown in Table 3.<br />
Pass-Fail Criteria<br />
The following pass/fail criteria were used for the test:<br />
1. Successful deployment/separation <strong>of</strong> the shear tie interface after being subjected to all three load<br />
cycling cases, while utilizing only the “static” kick<strong>of</strong>f force provided by the LLA assembly (slow<br />
release <strong>of</strong> preload).
2. Acceptable wear patterns are observed on shear ties. Acceptable wear is defined as wear<br />
showing a galled area <strong>of</strong> less than 6.45 mm 2 . The acceptable galling area is calculated by finding<br />
the area <strong>of</strong> a perfectly welded joint that would prevent separation, and dividing by three (Safety<br />
factor <strong>of</strong> three against failure to self-separate).<br />
Test article<br />
Although the entire LLA assembly was used as a test article for this test, only the wearing parts were<br />
considered test specimens. All <strong>of</strong> the wearing parts were made from Ti-6Al-4V, Solution Treated and<br />
Aged, coated with Tiodize type 2, and over-coated with Tiolube 460. The test specimens were fabricated<br />
to flight drawings and standards. A total <strong>of</strong> 3 sets <strong>of</strong> the wearing parts were tested. Three test specimen<br />
pairs were used to provide a reasonable idea <strong>of</strong> the variations in coating performance that might occur in<br />
a given lot. After each wear test regimen was completed, the wearing parts were inspected and replaced<br />
with the next set. Shear Tie specimens were preloaded to 28.9 kN ± 222 N (6500 lb ± 50 lb), which<br />
corresponds to a maximum Hertzian contact stress <strong>of</strong> 665 MPa (96.4 ksi).<br />
Test Overview<br />
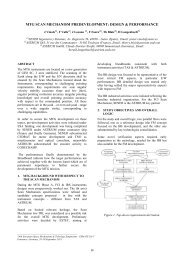
Figure 4 shows a diagram <strong>of</strong> the test setup. A photograph <strong>of</strong> the test setup is shown in Figure 5. The<br />
primary wear mode for the LLA is a rocking mode about the shear tie center <strong>of</strong> rotation. This rocking<br />
mode occurs in two axes, so the resultant displacement was applied in one rotation axis. There is a third<br />
rotation mode on the flight article, a rotation about the central axis <strong>of</strong> the shear ties. This mode is small in<br />
magnitude, and was not enveloped by this test.<br />
The spacecraft side <strong>of</strong> the test article was mounted to a base plate, which was mounted to the ram <strong>of</strong> a<br />
servohydraulic Instron machine. The “payload-wing” side <strong>of</strong> the test article (the bolt-catcher bracket), was<br />
grounded to the Instron load cell by a linkage that was connected to a steel block mounted to the bolt<br />
catcher bracket. As the base plate moved up and down, the shear ties were forced to rotate, introducing<br />
the desired wear mode.<br />
Rocking motions were measured using two extensometers, one in line with the clevis, and another placed<br />
6.35 cm inboard <strong>of</strong> the clevis. The purpose here was to provide a measurement <strong>of</strong> the rotation angle that<br />
would be somewhat independent <strong>of</strong> the deflections in the test fixture. The actual rocking angle applied<br />
during each test was found using the extensometer data, using the formula below.<br />
� tan 1 �<br />
�<br />
�<br />
�<br />
d1 � d2 R<br />
Where d1 and d2 are the extensometer displacements, R is the distance between the extensometers, and<br />
� is the rotation angle.<br />
Uncontrolled rotations were monitored using an autocollimator, which was set up to stare at a mirror flat<br />
mounted to the clevis mount (Figure 4). The rotations measured by this autocollimator were not recorded<br />
during testing – the purpose for this measurement was to monitor these rotations and verify that they<br />
were not affecting the shear tie wear during the test. The autocollimator readings were monitored during<br />
testing by personnel who were instructed to halt the test if more than 5000 �rad (0.3 degree) <strong>of</strong> rotation<br />
was observed in the non-controlled axis.<br />
The test was conducted in three phases. The first phase, or “LLA Stiffness Characterization” phase, was<br />
performed to verify that the load limits set for each run would not be tripped during testing. The second<br />
phase was the actual wear test, and the third phase was the separation test.<br />
Phase 1 Test<br />
During phase 1, the Instron was controlled using its built-in position transducer. This was done as a<br />
safety measure, since the extensometers have a tendency to slip at higher frequencies. The loading<br />
cases for the test are shown in Table 3. Each test run was controlled using displacement control, with<br />
load limits set per Table 3. Prior to testing, the range <strong>of</strong> motion for the test article was measured at ±5.1<br />
mm. In order to protect the test article from damage, displacement limits were set at ±4.4 mm. Phase 1<br />
�<br />
�<br />
163
164<br />
tests were performed at a drive frequency <strong>of</strong> 0.1 Hz. Two cycles were performed for each test run. During<br />
cycling, the preload in the preload rod was monitored, and the peak preload value was recorded. The<br />
autocollimator measurements were also monitored. For the autocollimator reading, some drift was<br />
acceptable, provided it was not cyclic in nature.<br />
Clevis<br />
Turnbuckle<br />
Mirror Flat for<br />
Autocollimator<br />
Extensometer<br />
Measurement Points<br />
Y/Z<br />
X<br />
Load Cell<br />
Clevis Shear Tie Center <strong>of</strong><br />
Rotation<br />
Figure 4. Schematic <strong>of</strong> test setup<br />
UUT<br />
Instron Ram<br />
Direction<br />
Phase 2 Test<br />
Phase 2 tests were performed using the same basic procedure as phase 1, but at higher frequencies,<br />
and with cycle counts corresponding to Table 3. The 1� test run was performed first, followed by the 2�<br />
run and the 3� run. During pre-test trials, it had been found that the displacement limits were tripped if the<br />
drive frequency was increased too suddenly. For this reason, each test run was started at 0.5 Hz and<br />
ramped up to the final drive frequency. During this test, the autocollimator was monitored to verify that<br />
uncontrolled displacements were not inputting a significant level <strong>of</strong> additional wear.
Figure 5. Photograph <strong>of</strong> test setup<br />
Phase 3 Test<br />
After each specimen pair was subjected to all 1�, 2�, and 3� test runs, a separation test was performed.<br />
The separation test fixture is shown in Figure 6. A cradle, which rides along a linear bearing, was used to<br />
support the bolt catcher bracket and clevis mount during separation. The function <strong>of</strong> this cradle is to limit<br />
rotation about the axis during the release <strong>of</strong> the preload. Unrestrained motion during this step may break<br />
any cold-welds that may have occurred, which could prevent the detection <strong>of</strong> shear tie failure.<br />
During each separation test, the cradle was first installed on the base plate. Then, the ball-tipped screws<br />
were adjusted to contact the LLA. Next, the preload nut was unscrewed slowly, while monitoring preload.<br />
If a popping noise was heard, (which indicates the breaking <strong>of</strong> a cold-weld), the load when this occurred<br />
was recorded. Once the preload was removed, the shear ties were inspected and photographed.<br />
Test Results<br />
Anomalies and Failures<br />
Some anomalies did occur during testing. The first anomaly was caused by excessive slop in the linkage<br />
between the Instron machine load cell and the bolt catcher bracket. The excessive slop was due to the<br />
clearance in the pinned joint between the test fixture turnbuckle and the Instron load cell. This affected<br />
the first set <strong>of</strong> specimens during the 1-sigma wear test by reducing the overall amplitude <strong>of</strong> wear cycles<br />
throughout the test. This problem was fixed before proceeding to the 2-sigma wear test by replacing the<br />
“standard” pin block on the load cell with a pin block that could be preloaded with a jam large jam nut.<br />
While testing the first set <strong>of</strong> specimens, it was also observed that the extensometers have a tendency to<br />
slip on their mounting posts during the 5 Hz tests. Grooves were filed into the extensometer mounting<br />
posts to mitigate this problem, but it continued to occur during testing <strong>of</strong> the second and third pairs <strong>of</strong><br />
specimens during 5 Hz tests. This anomaly is considered to be <strong>of</strong> minimal impact, because the low<br />
frequency characterization tests provide accurate data to determine the actual rotation amplitude that<br />
165
166<br />
occurred during each test. Issues with the Instron controller caused two to three extra cycles to be<br />
applied to the second and third specimen sets.<br />
Restrain LLA by<br />
engaging with ball<br />
tipped screws<br />
Figure 6. Release <strong>of</strong> preload<br />
Unscrew Preload Nut<br />
to Remove Preload<br />
Results Summary<br />
No galling or failure to self-separate occurred during testing. Photographs <strong>of</strong> a representative shear tie<br />
pair are shown in Figure 7 & Figure 8. The level <strong>of</strong> shear tie wear was acceptable. The wear on the shear<br />
tie specimens is very directional, as expected, and shows a layer <strong>of</strong> burnished-in MoS2 (Tiolube 460) that<br />
is just beginning to flake away from the anodize layer. Inspection under a microscope shows that<br />
although the Tiolube layer is very thin, it is mostly intact. Comparison <strong>of</strong> this level <strong>of</strong> wear to the<br />
sequential wear patterns observed during life testing <strong>of</strong> this coating indicate that the coating has most <strong>of</strong><br />
its wear life remaining.
Figure 7. S/N 006 male shear tie, showing acceptable wear pattern<br />
Figure 8. S/N 006 female shear tie, showing acceptable wear pattern<br />
167
168<br />
A representative set <strong>of</strong> load/deflection curves is shown in Figures 9 -11. It is interesting to note that each<br />
curve shows a distinct Dahl slope, which represents a portion <strong>of</strong> rotation that is characterized by elastic<br />
deformation <strong>of</strong> the contact surface (due to shear stress) rather than sliding. The first 0.3 to 0.5 degree <strong>of</strong><br />
displacement in each cycle was due to elastic shear. Once the torque to overcome friction is reached, the<br />
joint begins to slip, and the slope <strong>of</strong> the curve levels out.<br />
Load (N)<br />
Load (N)<br />
1-Sigma Test SN 008<br />
800<br />
300<br />
-1.5 -1 -0.5 -200 0 0.5 1 1.5<br />
-700<br />
-1200<br />
Displacement (mm)<br />
Figure 9. 1-sigma load/deflection curve<br />
2-Sigma Test SN 008<br />
1500<br />
1000<br />
500<br />
-500<br />
-1000<br />
-1500<br />
Outboard Extensometer<br />
Inboard Extensometer<br />
0<br />
-3 -2 -1 0 1 2 3<br />
Displacement (mm)<br />
Figure 10. 2-sigma load/deflection curve<br />
Outboad Extensometer<br />
Inboard Extensometer
Load (lb)<br />
3-Sigma Test SN 008<br />
1500<br />
1000<br />
500<br />
0<br />
-5 -4 -3 -2 -1 0 1 2 3 4 5<br />
-500<br />
-1000<br />
-1500<br />
Displacement (in)<br />
Figure 11. 3-sigma load/deflection curve<br />
Outboard Extensometer<br />
Inboard Extensometer<br />
The rocking angle that occurred during each test was calculated, and is compared to the desired value in<br />
Table 4. Note that the 1-sigma test level for serial number 007 was about half the desired test level, as<br />
discussed in the anomalies and failures section. The friction coefficient was calculated from the load at<br />
which slip occurred during each test. The friction coefficient ranged from 0.03 to 0.08.<br />
Table 4. Actual displacements during testing<br />
Test Serial No<br />
Displacement<br />
Measured Desired Difference<br />
Angle<br />
Measured Desired Difference<br />
006 0.049 0.059 17% 0.48 0.59 19%<br />
1-Sigma 007 0.029 0.059 51% 0.29 0.59 51%<br />
008 0.049 0.059 17% 0.47 0.59 20%<br />
006 0.104 0.110 5% 1.05 1.18 11%<br />
2-Sigma 007 0.104 0.110 5% 1.08 1.18 8%<br />
008 0.105 0.110 5% 1.03 1.18 13%<br />
006 0.157 0.165 5% 1.60 1.77 10%<br />
3-Sigma 007 0.160 0.165 3% 1.83 1.77 -3%<br />
008 0.160 0.165 3% 1.60 1.77 10%<br />
169
170<br />
Conclusions<br />
The LLA shear tie design is capable <strong>of</strong> surviving wear due to ground test and launch with acceptable<br />
wear patterns, which indicates positive life margin. After being subjected to an enveloping wear<br />
environment during risk-reduction testing, shear tie specimens showed wear patterns indicative <strong>of</strong> early<br />
wear stages. Displacements during the test (with one exception, as noted in Table 4) were within 17% <strong>of</strong><br />
the desired value, and angular displacements were within 20% <strong>of</strong> the desired value. The reduction in<br />
measured displacements compared to “controlled” displacements occurred due to elastic compliance in<br />
the Instron machine and test fixture. The test levels were conservative to begin with (more than 2X<br />
predicted displacements), so it is considered that the test, as run, properly envelopes the wear expected<br />
during ground test and launch. The wear levels observed on all three shear tie pairs were similar, which<br />
indicates that the performance <strong>of</strong> the Tiodize/Tiolube 460 coating was consistent for the lot <strong>of</strong> parts that<br />
were tested. Because between 0.3 and 0.5 degree <strong>of</strong> displacement was shown to occur with negligible<br />
slip, any displacements that do occur during acoustic testing will have a negligible contribution to the<br />
overall wear <strong>of</strong> the shear ties. This demonstrates that the doubling <strong>of</strong> the number <strong>of</strong> 1-sigma cycles<br />
envelopes acoustic testing.<br />
Test Telemetry<br />
The results <strong>of</strong> this test serve to indicate the importance <strong>of</strong> taking the correct telemetry during wear testing.<br />
Good telemetry should isolate the measurement from test fixture deflections, providing a direct<br />
measurement <strong>of</strong> the desired data. By providing good telemetry, this test did more than just verify the wear<br />
life <strong>of</strong> the test specimens, it provided useful insights into the functioning <strong>of</strong> the shear tie interface that<br />
were used to verify assumptions about the wear environment, and determine the friction coefficient <strong>of</strong> the<br />
coating under flight-like conditions. In addition, the contribution <strong>of</strong> test fixture displacement to the overall<br />
displacement <strong>of</strong> the Instron machine was characterized.<br />
Lessons Learned<br />
This test provided some key insights on testing wear surfaces. Analyzing test data in real time allows one<br />
to catch issues that could compromise or invalidate test data and results. For example, a cursory<br />
examination <strong>of</strong> the test data between the one and two-sigma tests <strong>of</strong> the first shear tie pair caught the<br />
excessive test fixture slop early on in the test. The fact that test fixture displacement accounted for up to<br />
20% <strong>of</strong> the desired rotation had little impact on the test result because <strong>of</strong> the high level <strong>of</strong> conservatism<br />
built into the test. If the level <strong>of</strong> conservatism had been lower, however, this could have been a significant<br />
problem. Test fixture displacements could have easily been characterized by examining data from the<br />
phase 1 tests, and used to scale up the Instron displacement, which would have ensured that the desired<br />
rocking angles were achieved.<br />
Acknowledgements<br />
The authors would like to thank the following people for their contributions to this test: Ed Boesiger, Luke<br />
Bunselmeyer, Stu Loewenthal, Mike Popyack, Kurien Thomas, Don Shaffer, and Charles Whipple.