Noncontact Atomic Force Microscopy - Yale School of Engineering ...
Noncontact Atomic Force Microscopy - Yale School of Engineering ...
Noncontact Atomic Force Microscopy - Yale School of Engineering ...

You also want an ePaper? Increase the reach of your titles
YUMPU automatically turns print PDFs into web optimized ePapers that Google loves.
12 th International Conference on<br />
<strong>Noncontact</strong> <strong>Atomic</strong> <strong>Force</strong> <strong>Microscopy</strong><br />
and<br />
Casimir 2009 Workshop<br />
CONFERENCE PROGRAM<br />
August 10-14, 2009 � <strong>Yale</strong> University, New Haven, CT, USA
Institutional Sponsors<br />
<strong>Yale</strong> Center for Research<br />
on Interface Structures<br />
and Phenomena<br />
Past Conferences<br />
Osaka, Japan (1998)<br />
Pontresina, Switzerland (1999)<br />
Hamburg, Germany (2000)<br />
Kyoto, Japan (2001)<br />
Montreal, Canada (2002)<br />
Dingle, Ireland (2003)<br />
Seattle, USA (2004)<br />
Osnabrück, Germany (2005)<br />
Kobe, Japan (2006)<br />
Antalya, Turkey (2007)<br />
Madrid, Spain (2008)<br />
Forthcoming Conference<br />
Kanazawa, Japan (2010)<br />
Udo D. Schwarz<br />
Dept. <strong>of</strong> Mechanical <strong>Engineering</strong><br />
<strong>Yale</strong> University<br />
New Haven, CT 06515, USA<br />
udo.schwarz@yale.edu<br />
Cover Page: Banner <strong>of</strong> <strong>Yale</strong><br />
University (1.8 µm � 1.8 µm),<br />
written into a PMMA film by<br />
dynamic force microscopy.<br />
Image by M. Heyde &<br />
U. D. Schwarz<br />
Left: Harkness Tower on<br />
<strong>Yale</strong> Campus.<br />
• <strong>Yale</strong> <strong>School</strong> <strong>of</strong> <strong>Engineering</strong><br />
• Departments <strong>of</strong> Mechanical, Electrical,<br />
and Chemical <strong>Engineering</strong><br />
• Department <strong>of</strong> Physics<br />
Endorsed<br />
Topical<br />
Conference<br />
www.avs.org
Welcome<br />
Dear conference participant:<br />
Welcome to the 12th International Conference on Non-Contact <strong>Atomic</strong> <strong>Force</strong> <strong>Microscopy</strong><br />
(NC-AFM 2009), which is held on historic <strong>Yale</strong> University campus in New Haven, CT, USA.<br />
It continues a series <strong>of</strong> international conferences constituted 1998 in Osaka, Japan. Since<br />
then, the annual NC-AFM conferences have been established as the leading events for<br />
NC-AFM related topics. This year’s meeting has again attracted a large number <strong>of</strong><br />
participants (over 130 attendees from 17 countries), who are contributing 43 oral and 71<br />
poster presentations. 15 additional talks are provided by the Satellite Workshop on Casimir<br />
<strong>Force</strong>s and Their Measurement, and seven companies feature their newest products in an<br />
exhibition.<br />
Like in other years, the scientific program showcases the rapid development that NC-AFM<br />
enjoys. Various experimental improvements such as high-stability measurements<br />
performed at low temperatures, novel stiff self-sensing oscillators with atomically controlled<br />
tips that allow chemical identification and tunneling current collection, drift compensation by<br />
forward-feedbacking, atom tracking, and post-acquisition drift correction, and all-digital<br />
high-speed, low-noise electronics enable a new level <strong>of</strong> sophistication in imaging, analysis,<br />
and atom manipulation. Progress is particularly remarkable for high-resolution data<br />
acquisition in liquids, demonstrating that NC-AFM is leaving its ultrahigh vacuum niche.<br />
The main conference is complemented by a Satellite Workshop on Casimir <strong>Force</strong>s and<br />
Their Measurement (Casimir 2009). Designed to stimulate discussion between the Casimir<br />
and the NC-AFM communities, the Casimir 2009 workshop has been well received (87<br />
participants). Credit for initiating this event goes to Woo-Joong Kim, who was aided in its<br />
organization by Alex Sushkov and Steven K. Lamoreaux.<br />
Contributions by many key players were indispensable in realizing this conference, among<br />
them the ones by the members <strong>of</strong> the Local Organizing Committee (Eric I. Altman, Hong X.<br />
Tang, and Woo-Joong Kim) and by the team <strong>of</strong> the <strong>Yale</strong> Conference Service under the<br />
supervision <strong>of</strong> Susan Adler. Special thanks go to Mehmet Baykara for his help with various<br />
practical aspects such as the design <strong>of</strong> this abstract booklet. We were also fortunate to<br />
receive significant support from numerous <strong>Yale</strong> entities, whose generous financial<br />
assistance made this conference possible, from the European Science Foundation through<br />
its “New Trends and Applications <strong>of</strong> the Casimir Effect” program, and from the American<br />
Vacuum Society, which arranged for the publication <strong>of</strong> the conference proceedings. The<br />
complete list <strong>of</strong> institutional sponsors can be found opposite to this page; corporative<br />
sponsors and exhibitors are listed on page 9.<br />
We hope that you will enjoy the conference and have a wonderful time in New Haven.<br />
Udo D. Schwarz, Conference Chair<br />
1
2<br />
Contents<br />
Welcome 1<br />
Topics 3<br />
Committees 4<br />
General Information 6<br />
Local Maps 8<br />
Exhibitors 9<br />
Proceedings 10<br />
Conference Program 13<br />
Oral Presentations 28<br />
Poster Presentations 91<br />
Author Index 164<br />
List <strong>of</strong> Participants 169<br />
Advertisement 174
Topics<br />
• <strong>Atomic</strong> resolution imaging <strong>of</strong> surfaces, thin films, and molecular<br />
systems<br />
• Measuring tip-sample interaction potentials and mapping force fields<br />
• High-resolution imaging <strong>of</strong> clusters, biomolecules, and biological<br />
systems<br />
• High-resolution imaging and spectroscopy in liquid environments<br />
• Novel instrumentation and measurement techniques in dynamic AFM<br />
• Small amplitude measurements<br />
• Lateral force measurements using dynamic methods<br />
• <strong>Atomic</strong>- and molecular-scale manipulation<br />
• Theoretical analysis <strong>of</strong> contrast mechanisms; forces & tunnelling<br />
phenomena<br />
• Simulation <strong>of</strong> images and virtual AFM systems<br />
• Mechanisms for damping and energy dissipation<br />
• Amplitude modulation versus frequency modulation imaging<br />
• Measuring nanoscale charges, work functions, and magnetic<br />
properties<br />
• Characterization and modification <strong>of</strong> force microscopy tips at the<br />
atomic scale<br />
3
Committees<br />
Conference Chairman<br />
Udo Schwarz <strong>Yale</strong> University (USA)<br />
Local Organizing Committee<br />
Eric I. Altman <strong>Yale</strong> University (USA)<br />
Hong X. Tang <strong>Yale</strong> University (USA)<br />
Woo-Joong Kim <strong>Yale</strong> University (USA)<br />
Satellite Workshop Organization<br />
Woo-Joong Kim <strong>Yale</strong> University (USA)<br />
Udo Schwarz <strong>Yale</strong> University (USA)<br />
Alex Sushkov <strong>Yale</strong> University (USA)<br />
Steven K. Lamoreaux <strong>Yale</strong> University (USA)<br />
International Steering Committee<br />
Franz Giessibl University <strong>of</strong> Regensburg (Germany)<br />
Peter Grütter McGill University (Canada)<br />
Ernst Meyer University <strong>of</strong> Basel (Switzerland)<br />
Seizo Morita Osaka University (Japan)<br />
Hiroshi Onishi Kobe University (Japan)<br />
Ahmet Oral Sabanci University (Turkey)<br />
Rubén Peréz Universidad Autonoma de Madrid (Spain)<br />
Michael Reichling University <strong>of</strong> Osnabrück (Germany)<br />
Alexander Schwarz University <strong>of</strong> Hamburg (Germany)<br />
Udo Schwarz <strong>Yale</strong> University (USA)<br />
Alexander Shluger University College London (UK)<br />
4
Committees<br />
Program Committee<br />
Jaime Colchero Universidad de Murcia (Spain)<br />
Oscar Custance National Institute for Material Science (Japan)<br />
Takeshi Fukuma Kanazawa University (Japan)<br />
Hendrik Hölscher Karlsruhe Research Laboratory (Germany)<br />
Sascha Sadewasser Helmholtz Institute Berlin (Germany)<br />
André Schirmeisen University <strong>of</strong> Münster (Germany)<br />
Santiago Solares University <strong>of</strong> Maryland (USA)<br />
Yasuhiro Sugawara Osaka University (Japan)<br />
Masaru Tsukada Waseda University (Japan)<br />
Hir<strong>of</strong>umi Yamada Kyoto University (Japan)<br />
Conference Proceedings Editors<br />
Hendrik Hölscher Karlsruhe Research Laboratory (Germany)<br />
Udo D. Schwarz <strong>Yale</strong> University (USA)<br />
Conference Organization<br />
Tara Schule, Joanne Dupee, Roberta Hudson, and Susan Adler, <strong>Yale</strong> Conference<br />
Services<br />
5
General Information<br />
Conference Venue:<br />
Talks will be held in Davies Auditorium in the basement <strong>of</strong> <strong>Yale</strong> University’s Becton Center,<br />
15 Prospect Street, New Haven, CT 06511 (see the maps page 8 for the exact location).<br />
For easiest access, follow the signs around the building to the lower courtyard located<br />
between Becton Center and the rear building (Dunham Laboratory, 10 Hillhouse Avenue).<br />
There, you will find the main entrance to the conference area, which is indicated by the red<br />
arrow in the satellite picture. For the auditorium, please turn left after entering the doors. In<br />
contrast, turning right twice will lead you to the J. Robert Mann Jr. <strong>Engineering</strong> Student<br />
Center, where c<strong>of</strong>fee breaks and parts <strong>of</strong> the exhibition are taking place. Poster sessions<br />
and luncheons will be held in Commons Hall at the corner <strong>of</strong> Grove and College Streets<br />
(the building with the dome opposite Becton Center). Please keep in mind that smoking is<br />
not allowed in any <strong>Yale</strong> University building, including Davies Auditorium, the Mann Student<br />
Center, and Commons Hall.<br />
Registration:<br />
The registration desk in the foyer <strong>of</strong> Davies Auditorium (see above) will be staffed 07:45-<br />
18:00 (Monday), 08:00-12:00 (Tuesday), and 08:30-09:00 (Wednesday through Friday).<br />
Welcome Party:<br />
We invite all conference participants to a casual welcome party with reception and dinner<br />
(barbeque) on Monday, August 10, 2009, between 18:30 and 20:30. The exact location will<br />
be announced ahead <strong>of</strong> time via email and on the web.<br />
Conference Banquet:<br />
Conference banquet will be held on Thursday, Aug. 13 th , 2009, 18:30-22:00 at Sterling<br />
Memorial Library (SML) on <strong>Yale</strong> campus. Please see the maps on page 8 for the location <strong>of</strong><br />
SML.<br />
6
General Information (cont.)<br />
Oral Presentations:<br />
Oral presentations will be scheduled for 20 minutes each including a 5-minute discussion<br />
for sessions during the NC-AFM conference (August 11-14). For the specialized Casimir<br />
workshop sessions on August 10, talks will be 25 minutes each. An LCD projector is<br />
available in the conference room, but all speakers are required to bring their own laptops.<br />
Poster Presentations:<br />
Two Poster sessions will be held during the conference on Tuesday, August 11, and<br />
Wednesday, August 12, 2009. The available size for posters will be 1.2 m x 1.2 m. Pins for<br />
mounting the poster on the board will be provided.<br />
Internet Access:<br />
Wireless internet access will be available in Davies Auditorium and the exhibition areas.<br />
Detailed instructions for connecting to the internet will be distributed with your conference<br />
material. Also, a number <strong>of</strong> desktop computers will be available in the exhibition area and a<br />
nearby computer cluster room. A guest login ID and a personal password, which allows you<br />
to connect to the internet from these computers, will be handed to each participant at the<br />
registration desk.<br />
7
Local Maps<br />
8
Exhibitors<br />
9
Proceedings<br />
Both NC-AFM Conference and Casimir Workshop participants are invited to contribute an<br />
article to the conference proceedings, which will be published in the Journal <strong>of</strong> Vacuum<br />
Science and Technology B (JVST B). Publishing your work in the conference proceedings<br />
represents an excellent opportunity to promote your work, as NC-AFM proceedings have in<br />
the past always been highly visible and widely cited. This is in particular the case as every<br />
conference participant (main conference AND Casimir Workshop) will receive a bound<br />
complementary copy <strong>of</strong> the proceedings via mail.<br />
The proceedings will be edited by Hendrik Hölscher, Karlsruhe Research Laboratory,<br />
Germany, and Udo D. Schwarz, <strong>Yale</strong> University. Submission deadline is October 16,<br />
2009, but please contact us at your earliest convenience to let us know about your plans to<br />
submit a contribution so that we can plan ahead. Publication <strong>of</strong> the proceedings is<br />
scheduled for the May/June issue <strong>of</strong> JVST B in 2010.<br />
Instructions for preparing manuscripts for the proceedings <strong>of</strong> the NC-AFM 2009<br />
Conference:<br />
1. Submission: Papers will be reviewed according to criteria set by the JVST and must<br />
meet JVST standards for both technical content and written English. All manuscripts<br />
for the proceedings must be submitted as a PDF file along with a cover letter<br />
containing your complete address to the guest editor via email<br />
(Hendrik.Hoelscher@imt.fzk.de).<br />
2. Program number: It is important that the submitted manuscript has the program<br />
number <strong>of</strong> your contribution to the NC-AFM conference or the satellite conference<br />
entered in the top-right corner <strong>of</strong> the title page.<br />
10
Proceedings (cont.)<br />
3. Length: Papers can contain up to a nominal total <strong>of</strong> 20-25 pages <strong>of</strong> double-spaced<br />
text, tables, figures, references, abstract, etc. if the submitted paper is longer than<br />
25 pages, the final decision on acceptance for publication will be made by the JVST<br />
editors based on the recommendations <strong>of</strong> the reviewers.<br />
4. Format: The text should be double-spaced; the font recommended by JVST is<br />
Times New Roman 12pt. Pages should have one-inch margins on all sides.<br />
5. Figures and Tables: Each figure and table should be displayed on a separate<br />
page. Table and figure captions should be listed on a separate page and NOT below<br />
the table or figure; only the figure/table number must appear with the figure/table.<br />
6. Footnotes: Authors may include their e-mail addresses along with all other footnotes<br />
in the following format: Electronic mail: smith@yale.edu<br />
7. Costs: JVST publishes articles authored by members <strong>of</strong> the American Vacuum<br />
Society (AVS) free <strong>of</strong> charge. Therefore, let us know when submitting whether any <strong>of</strong><br />
the authors is presently AVS member. For submissions where no author is AVS<br />
member, we will provide a complementary 1-year membership for the paper's<br />
corresponding author paid for form conference funds. As a result, there will be no<br />
page charges or other costs for your submission.<br />
8. Color: Your figures can appear online in color for free. To take advantage <strong>of</strong> this<br />
<strong>of</strong>fer, you will need to send the electronic file(s) <strong>of</strong> your figure(s) within 24 hours <strong>of</strong><br />
receiving your acceptance email from JVST directly to the publisher (the American<br />
Institute <strong>of</strong> Physics, AIP). Please do not send anything until you receive notice the<br />
paper is accepted and has a 9 digit AIP number. Sending color figures in the pdf file<br />
11
Proceedings (cont.)<br />
used for the review process does not allow for color reproduction (either online or<br />
print) at the publishing stage. Only sending AIP the files directly will enable this. A<br />
“Publisher’s Announcements” email with more details will be sent to you once your<br />
paper has been accepted.<br />
9. Materials Index Entries: If applicable, please provide us with at least three material<br />
terms, which should indicate what materials (i.e., chemical species) are discussed in<br />
the article. These terms are needed as entries for the JVST Materials Index.<br />
For more details, please refer to:<br />
JVST author instructions: www.avs.org/literature.information.aspx<br />
JVST Word template: www.avs.org/pdf/JVST/eC.doc<br />
Instructions for this template: www.avs.org/pdf/JVST/eCEinstructions.pdf<br />
Manuscript deadline: October 16, 2009<br />
Please submit your manuscript as PDF together with a cover letter containing your<br />
complete address and information whether or not one <strong>of</strong> the authors is presently AVS<br />
member via email to guest editor Dr. Hendrik Hölscher at Hendrik.Hoelscher@imt.fzk.de<br />
12
Conference<br />
Program<br />
13
NC-AFM 2009<br />
Sessions<br />
Monday<br />
August 10<br />
• Liquids I<br />
Tuesday 9:20-10:40<br />
• <strong>Force</strong> Spectroscopy I<br />
Tuesday 11:20-12:40<br />
• Electronic, photonic, & Casimir forces<br />
Tuesday 14:30-15:50<br />
• Oxides<br />
Wednesday 9:00-10:40<br />
• Carbon-based materials<br />
Wednesday 11:20-12:40<br />
Tuesday<br />
August 11<br />
14<br />
Wednesday<br />
August 12<br />
• Molecules on insulators<br />
Wednesday 14:30-15:50<br />
• <strong>Force</strong> spectroscopy II<br />
Thursday 9:00-10:40<br />
• <strong>Force</strong>s & charges<br />
Thursday 11:20-13:00<br />
• Method development<br />
Friday 9:00-10:40<br />
• Liquids II<br />
Friday 11:20-12:40<br />
Thursday<br />
August 13<br />
Friday<br />
August 14<br />
8:30 Registration Registration Registration Registration<br />
9:00 Opening Remarks M. Heyde A. Campbellova Y. Naitoh<br />
9:20 T. Fukuma A. Yurtsever F. J. Giessibl S. Torbrügge<br />
9:40 H. Asakawa R. Pérez G. Langewisch Y. Hosokawa<br />
10:00 N. Oyabu R. Bechstein A. Barat<strong>of</strong>f E. Tsunemi<br />
10:20 M. Tsukada S. Sadewasser S. Kawai U. Zerweck<br />
10:40 C<strong>of</strong>fee Break C<strong>of</strong>fee Break C<strong>of</strong>fee Break C<strong>of</strong>fee Break<br />
11:20 D. Ebeling U. D. Schwarz A. Sweetman S. Nishida<br />
11:40 A. Schirmeisen P. Jelínek L. Gross S. Ido<br />
12:00 Y. Sugimoto M. Ashino Y. Miyahara E. T. Herruzo<br />
12:20 Y. Sugawara P. Pou T. Trevethan K. Fukui<br />
12:40 A. Bettac Closing Remarks<br />
13:00<br />
Lunch<br />
110 min.<br />
(12:40-14:30)<br />
Lunch<br />
110 min.<br />
(12:40-14:30)<br />
14:30<br />
A. Parsegian<br />
A. Kühnle<br />
14:50<br />
(invited)<br />
A. Schwarz<br />
15:10 Th. Glatzel Ch. Loppacher<br />
15:30 H. Hölscher C. J. Gómez<br />
15:50<br />
|<br />
18:00<br />
C<br />
A<br />
S<br />
I<br />
M<br />
I<br />
R<br />
W<br />
O<br />
R<br />
K<br />
S<br />
H<br />
O<br />
P<br />
18:30-20:30<br />
Welcome<br />
Reception/Dinner<br />
Poster Session I Poster Session II<br />
Lunch<br />
90 min.<br />
(13:00-14:30)<br />
18:30-22:00<br />
Conference<br />
Banquet
Program Summary <strong>of</strong> the NC-AFM 2009 Satellite Workshop on<br />
Casimir <strong>Force</strong>s and Their Measurement<br />
Monday sessions only; Tuesday sessions are joint with the NC-AFM Conference (see the main<br />
conference program for listing). Note in particular that the Casimir workshop’s second invited talk,<br />
given by Adrian Parsegian (NIH, USA), will take place Tuesday 14:30-15:10.<br />
Monday, August 10<br />
7:45 Registration<br />
8:50 Opening Remarks<br />
9:00 Rudi Porgornik (University <strong>of</strong> Ljubljana, Slovenia), invited<br />
9:30 Noah Graham (Middlebury College, USA)<br />
9:55 Kimball Milton (University Oklahoma, USA)<br />
10:20<br />
C<strong>of</strong>fee Break<br />
10:50 Raul Esquivel-Sirvent (Universidad Nacional Autónoma, Mexico)<br />
11:15 Diego Dalvit (Los Alamos National Laboratory, USA)<br />
11:40 Rick Rajter (MIT, USA)<br />
12:05 Maarten de Boer (Sandia National Laboratory, USA)<br />
12:30<br />
Lunch (12:30-14:30)<br />
14:30 Hong Tang (<strong>Yale</strong> University, USA)<br />
14:55 Alessandro Siria (CNRS, France)<br />
15:20 Arvind Narayanaswamy (Columbia University, USA)<br />
15:45<br />
C<strong>of</strong>fee Break<br />
16:15 Sven de Man (VU University Amsterdam, Netherlands)<br />
16:40 Gauthier Torricelli (University <strong>of</strong> Leicester, UK)<br />
17:05 Ho Bun Chan (University <strong>of</strong> Florida, USA)<br />
17:30 Peter van Zwol (University <strong>of</strong> Groningen, Netherlands)<br />
17:55 Woo-Joong Kim (<strong>Yale</strong> University, USA)<br />
18:30-20:30<br />
Welcome Reception with Dinner<br />
15
Monday, August 10<br />
Satellite Workshop on Casimir <strong>Force</strong>s and<br />
Their Measurement<br />
8:50 Opening Remarks<br />
Session I Chair: W.-J. Kim<br />
9:00 Non-retarded and retarded interactions between dielectric cylinders<br />
Rudi Podgornik<br />
9:30 Casimir <strong>Force</strong>s from Scattering Theory<br />
Noah Graham<br />
9:55 Multiple Scattering Casimir <strong>Force</strong> Calculations between Layered and Corrugated Materials<br />
Kimball Milton<br />
10:20 C<strong>of</strong>fee Break<br />
Session II Chair: R. Podgornik<br />
10:50 Drude corrections to Casimir force calculations in liquids<br />
Raul Esquivel-Sirvent<br />
11:15 Dispersive Casimir interactions between atoms and surfaces<br />
Diego Dalvit<br />
11:40 Van der Waals with a twist: how nanotube chirality impacts interaction strength<br />
Rick Rajter<br />
12:05 Using Casimir and capillary forces to model adhesion <strong>of</strong> MEMS cantilevers<br />
Maarten de Boer<br />
12:30 Lunch Break<br />
Session III Chair: A. Parsegian<br />
14:30 Measuring “Virtual Photon” <strong>Force</strong>s with “Real Photon” <strong>Force</strong>s<br />
Hong Tang<br />
14:55 Near-field radiative heat transfer<br />
Alessandro Siria<br />
15:20 Near-field radiative transfer measurements and implications for Casimir force<br />
measurements<br />
Arvind Narayanaswamy<br />
15:45 C<strong>of</strong>fee Break<br />
16
Monday, August 10<br />
Satellite Workshop on Casimir <strong>Force</strong>s and Their Measurement (cont.)<br />
Session IV<br />
17<br />
Chair: D. Dalvit<br />
16:15 Tricks and facts in a high precision measurement <strong>of</strong> the Casimir force with transparent<br />
conductors<br />
Sven de Man<br />
16:40 Measurements <strong>of</strong> the Casimir force gradient by AFM for Different Materials<br />
Gauthier Torricelli<br />
17:05 Measuring the topological dependence <strong>of</strong> the Casimir force on nanostructured silicon<br />
surfaces<br />
Ho Bun Chan<br />
17:30 Short range Casimir force measurements under ambient conditions and liquid<br />
environments<br />
Peter van Zwol<br />
17:55 Contact potential difference in a Casimir force measurement: How do we deal with it?<br />
Woo-Joong Kim<br />
Welcome Reception with Dinner (18:30-20:30)
Tuesday, August 11<br />
9:00 Opening Remarks<br />
Liquids I<br />
9:20 3D Scanning <strong>Force</strong> <strong>Microscopy</strong> at Solid/Liquid Interface<br />
T. Fukuma, Y. Ueda<br />
18<br />
Chair: H. Hölscher<br />
9:40 Anisotropic Hydration <strong>of</strong> Biological Molecules Visualized by Three-Dimensional Scanning<br />
<strong>Force</strong> <strong>Microscopy</strong><br />
H. Asakawa,Y. Ueda, T. Fukuma<br />
10:00 Experimental and Theoretical Studies on 3D Hydration Structures on Muscovite Mica<br />
Surfaces in Aqueos Solution<br />
N. Oyabu, K. Kimura, S. Ido, K. Suzuki, K. Kobayashi, T. Imai, H. Yamada<br />
10:20 Theory <strong>of</strong> Tip-Sample Interaction <strong>Force</strong> Mediated by Water<br />
M. Tsukada, M.Harada, K.Tagami<br />
10:40 C<strong>of</strong>fee Break<br />
<strong>Force</strong> Spectroscopy I<br />
11:20 Dynamic <strong>Force</strong> Spectroscopy <strong>of</strong> Single Chain-like Molecules<br />
D. Ebeling, H. Fuchs, F. Oesterhelt, H. Hölscher<br />
11:40 Spatial force fields above a single atom defect<br />
A. Schirmeisen, D. Weiner<br />
12:00 Simultaneous measurement <strong>of</strong> force and tunneling current<br />
D. Sawada, Y. Sugimoto, K.-I. Morita, M. Abe, S. Morita<br />
12:20 Atom Manipulation on Cu(110)-O Surface with LT-AFM<br />
Y. Sugawara, Y. Kinoshita, Y. J. Li, Y. Naitoh, M. Kageshima<br />
12:40 Lunch Break<br />
Chair: F. J. Giessibl<br />
Electronic, Photonic, & Casimir <strong>Force</strong>s Chair: S. Morita<br />
14:30 Water, Ions, Membranes, Real Metals, Finite Temperature: Is there ever a pure Casimir<br />
force? (Invited)<br />
Adrian Parsegian<br />
15:10 Short and medium range electrostatic forces analyzed by Kelvin probe force microscopy<br />
Th. Glatzel, S. Kawai, S. Koch, A. Barat<strong>of</strong>f, E. Meyer<br />
15:30 The Effective Quality Factor in Dynamic <strong>Force</strong> Microscopes with Fabry-Perot<br />
Interferometer Detection<br />
H. Hölscher, P. Milde, U. Zerweck, L. M. Eng, R. H<strong>of</strong>fmann<br />
Poster Session I (15:50 – 18:00)<br />
Chair: A. Oral
Wednesday, August 12<br />
Oxides Chair: A. Schwarz<br />
9:00 Imaging Single Atoms on Oxide Surfaces – Gold on Alumina/NiAl(110)<br />
M. Heyde, G. H. Simon, Th. König, H.-J. Freund<br />
9:20 Site-specific force spectroscopy on TiO2 (110) surface at low-temperature<br />
A. Yurtsever, A. Pratama, Y. Sugimoto, M. Abe, S. Morita<br />
9:40 Character <strong>of</strong> the short-range interaction between a silicon based tip and the TiO2(110)<br />
surface: a DFT study<br />
C. Gozalez, P. Jelínek, R. Pérez<br />
10:00 True atomic resolution imaging on an application-oriented system: Understanding<br />
photocatalytic reactivity <strong>of</strong> transition-metal doped TiO2<br />
R. Bechstein, M. Kitta, J. Schütte, H. Onishi, A. Kühnle<br />
10:20 Local surface photovoltage spectroscopy <strong>of</strong> molecular clusters using Kelvin probe force<br />
microscopy<br />
S. Sadewasser, M. Ch. Lux-Steiner<br />
10:40 C<strong>of</strong>fee Break<br />
Carbon-based Materials Chair: M. Reichling<br />
11:20 Why is Graphite so Slippery? Gathering Clues from Three-Dimensional Lateral <strong>Force</strong>s<br />
Measurements<br />
U. D. Schwarz, M. Z. Baykara, T. C. Schwendemann, B. J. Albers, N. Pilet, E. I. Altman<br />
11:40 Theoretical DFT simulations <strong>of</strong> the STM/AFM atomic scale imaging on graphite<br />
V. Rozsíval, M. Ondráček, P. Jelínek<br />
12:00 <strong>Atomic</strong>-Resolution Damping <strong>Force</strong> Spectroscopy on Nanotube Peapods with Different<br />
Tube Diameters<br />
M. Ashino, R. Wiesendanger, A. N. Khlobystov, S. Berber, D. Tománek<br />
12:20 Theoretical study <strong>of</strong> the forces and atomic configurations <strong>of</strong> NC-AFM experiments on lowdimension<br />
carbon materials<br />
P. Pou, R. Perez<br />
12:40 Lunch Break<br />
Molecules on Insulators Chair: R. Perez<br />
14:30 Anchoring highly polar molecules onto an ionic crystal<br />
J. Schütte, R. Bechstein, M. Rohlfing, M. Reichling, A. Kühnle<br />
14:50 Steering the formation <strong>of</strong> molecular nanowires and compact nanocrystallites on NaCl(001)<br />
S. Fremy, A. Schwarz, K. Laemmle, R. Wiesendanger, M. Prosenc<br />
15:10 2-Dimensional growth <strong>of</strong> phenylenediboronic acid assisted by H-bonding<br />
R. Pawlak, L. Nony, F. Bocquet, M. Sassi, V. Oison, J.-M. Debierre, Ch. Loppacher, L.<br />
Porte<br />
15:30 Molecular scale dissipation in oligothiophene monolayers measured by dynamic force<br />
microscopy<br />
C. J. Gómez, N. F. Martínez, W. Kamiński, C. Albonetti, F. Biscarini, R. Perez, R. Garcia<br />
Poster Session II (15:50 – 18:00) Chair: Y. Sugawara<br />
19
Thursday, August 13<br />
<strong>Force</strong> Spectroscopy II<br />
20<br />
Chair: P. Grütter<br />
9:00 Dependence <strong>of</strong> the atomic scale image <strong>of</strong> a Si adatom on the tip apex termination: a DFT<br />
study<br />
A. Campbellova, P. Pou , R. Pérez, P. Klapetek, P. Jelínek<br />
9:20 AFM probe tips with a small front atom<br />
T. H<strong>of</strong>mann, J. Welker, M. Ternes, C. P. Lutz, A. J. Heinrich, F. J. Giessibl<br />
9:40 Intramolecular features <strong>of</strong> organic molecules characterized by force field spectroscopy:<br />
The case <strong>of</strong> PTCDA on Cu and Ag<br />
G. Langewisch, D.-A. Braun, D. Weiner, B. Such, H. Fuchs, A. Schirmeisen<br />
10:00 Analysis <strong>of</strong> bimodal and higher mode small-amplitude near-contact AFM and energy<br />
dissipation<br />
S. Kawai, A. Barat<strong>of</strong>f, Th. Glatzel, S. Koch, B. Such, E. Meyer<br />
10:20 Adhesion-induced energy dissipation and atom-tracked tip changes<br />
S. Kawai, Th. Glatzel, S. Koch, B. Such, A. Barat<strong>of</strong>f, E. Meyer<br />
10:40 C<strong>of</strong>fee Break<br />
<strong>Force</strong>s & Charges<br />
Chair: H. Onishi<br />
11:20 Combined Qplus-AFM and STM imaging <strong>of</strong> the Si(100) surface: Activating the c(4x2) to<br />
p(2x1) transition with subnanometre oscillation amplitudes<br />
A. Sweetman, S. Gangopadhyay, R. Danza, P. Moriarty<br />
11:40 Measuring <strong>Atomic</strong> Charge States by nc-AFM<br />
L. Gross, F. Mohn, P. Liljeroth, J. Repp, F. J. Giessibl, G. Meyer<br />
12:00 Mechanism <strong>of</strong> Dissipative Interaction by Tunneling Single-Electrons<br />
Y. Miyahara, L. Cockins, S. D. Bennett, A. A. Clerk, S. A. Studenikin, P. Poole, A.<br />
Sachrajda, P. Grütter<br />
12:20 Controlling electron transfer processes on insulating surfaces with the NC-AFM<br />
Th. Trevethan, A. Shluger<br />
12:40 NC-AFM imaging with atomic resolution in a temperature range between 5 K and 1083 K<br />
A. Bettac, A. Feltz<br />
13:00 Lunch Break<br />
Guided <strong>Yale</strong> Campus Walking Tour (16:00-17:30)<br />
Conference Banquet (18:30 – 22:00)
Friday, August 14<br />
Method Development Chair: A. Schirmeisen<br />
9:00 <strong>Atomic</strong> scale elasticity mapping <strong>of</strong> Ge(001) surface by multifrequency FM-AFM<br />
Y. Naitoh, Z. Ma, Y. Li, M. Kageshima, Y. Sugawara<br />
9:20 Small amplitude atomic resolution NC-AFM imaging and force spectroscopy experiments<br />
using a stiff piezoelectric force sensor<br />
S. Torbrügge, J. Rychen, O. Schaff<br />
9:40 Determination <strong>of</strong> the Optimum Spring Constant and Oscillation Amplitude for<br />
<strong>Atomic</strong>/Molecular-Resolution FM-AFM<br />
Y. Hosokawa, K. Kobayashi, H. Yamada, K. Matsushige<br />
10:00 Visualization <strong>of</strong> Anisotropic Conductance in Polydiacetylene Crystal by Two-probe FM-<br />
AFM/KFM<br />
E. Tsunemi, K. Kobayashi, K. Matsushige, H. Yamada<br />
10:20 Scattering Scanning Near-Field Optical <strong>Microscopy</strong> performed by NC-AFM<br />
U. Zerweck, S. C. Schneider, M. T. Wenzel, H.-G. von Ribbeck, S. Grafström, R. Jacob, S.<br />
Winnerl, M. Helm, L. M. Eng<br />
10:40 C<strong>of</strong>fee Break<br />
Liquids II Chair: T. Fukuma<br />
11:20 <strong>Atomic</strong> resolution dynamic lateral force microscopy in liquid<br />
S. Nishida, D. Kobayashi, N. Okabe, H. Kawakatsu<br />
11:40 Molecular-scale Investigations <strong>of</strong> Biomolecules in Liquids by FM-AFM<br />
S. Ido, N. Oyabu, K. Kobayashi, Y. Hirata, M. Tsukada, K. Matsushige, H. Yamada<br />
12:00 Bimodal AFM imaging <strong>of</strong> antibodies and chaperonins in liquids<br />
E. T. Herruzo, C. Dietz, J. R. Lozano, R.Garcia<br />
12:20 Redox-state Dependent Reversible Change <strong>of</strong> Molecular Ensembles in Water Solution by<br />
Electrochemical FM-AFM<br />
K.-I. Umeda, Y. Yokota, K.-I. Fukui<br />
12:40 Closing Remarks<br />
21
POSTER Session I (Tuesday)<br />
<strong>Force</strong> Spectroscopy<br />
P.I-01 <strong>Force</strong> and Tunneling Current Measurements on the Semiconductor Surface<br />
D. Sawada, Y. Sugimoto, K.-I. Morita, M. Abe, S. Morita<br />
P.I-02 <strong>Force</strong> Map <strong>of</strong> <strong>Atomic</strong> <strong>Force</strong> <strong>Microscopy</strong> on Si(111)-(5x5)-DAS Surface<br />
A. Masago, M. Tsukada<br />
22<br />
Chair: A. Oral<br />
P.I-03 From non-contact to atomic scale contact between a Si tip and a Si surface analyzed using<br />
an nc-AFM and nc-AFS based instrument<br />
T. Arai, K. Kiyohara, T. Sato, S. Kushida, M. Tomitori<br />
P.I-04 Improved atomic-scale contrast via bimodal dynamic force microscopy<br />
S. Kawai, Th. Glatzel, S. Koch, B. Such, A. Barat<strong>of</strong>f, E. Meyer<br />
P.I-05 Static cantilever deflection in dynamic force microscopy<br />
S. Kawai, Th. Glatzel, S. Koch, B. Such, A. Barat<strong>of</strong>f, E. Meyer<br />
P.I-06 Resonance frequency shift due to tip-sample interaction in the thermal oscillations regime<br />
G. Malegori, G. Ferrini<br />
P.I-07 Influence <strong>of</strong> thermal noise on measurements <strong>of</strong> chemical bonds in UHV-AFM<br />
P. M. H<strong>of</strong>fmann<br />
P.I-08 <strong>Atomic</strong> force microscope cantilever resonance frequency shift based thermal metrology<br />
A. Narayanaswamy, C. Canetta, N. Gu<br />
Kelvin Probe <strong>Microscopy</strong><br />
P.I-09 Contact potential difference on the atomic-scale probed by Kelvin Probe <strong>Force</strong> <strong>Microscopy</strong>:<br />
an imaging scenario<br />
L. Nony, A. Foster, F. Bocquet, Ch. Loppacher<br />
P.I-10 Self-assembled Boronitride Nanomesh on Rh(111) Investigated by Means <strong>of</strong> Kelvin Probe<br />
<strong>Force</strong> <strong>Microscopy</strong><br />
S. Koch, M. Langer, J. Lobo-Checa, Th. Brugger, S. Kawai, B. Such, E. Meyer, Th. Glatzel<br />
P.I-11 Kelvin probe force microscopy in application to organic thin films: frequency modulation,<br />
amplitude modulation, and hover mode KPFM<br />
B. Moores, F. Hane, L. M. Eng, Z. Leonenko<br />
P.I-12 Resolution enhanced multifrequency electrostatic force microscopy under ambient<br />
conditions<br />
X. D. Ding, J. B. Xu, J. X. Zhang<br />
P.I-13 Deconvolution and Tip Geometry Effects in <strong>Atomic</strong>- and Nanoscale Kelvin probe <strong>Force</strong><br />
<strong>Microscopy</strong><br />
G. Elias, Y. Rosenwaks, A. Boag, E. Meyer, Th. Glatzel<br />
P.I-14 Kelvin <strong>Force</strong> <strong>Microscopy</strong> Dynamic Behavior and Noise Propagation<br />
H. Diesinger, D. Deresmes, J.-P. Nys, Th. Mélin<br />
P.I-15 Charge transfer from doped silicon nanocrystals<br />
Ł. Borowik, Th. Nguyen-Tran, P. Roca i Cabarrocas, K. Kusiaku, D. Theron, H. Diesinger,<br />
D. Deremes, Th. Mélin
Poster Session I cont. (Tuesday)<br />
Instrumentation<br />
P.I-16 Open source scanning probe microscopy control and data analysis s<strong>of</strong>tware package<br />
Gxsm<br />
P. Zahl<br />
P.I-17 2 nd generation Dynamic Nanostencil AFM/DFM/STM for in-situ (UHV) resistless patterning<br />
<strong>of</strong> nanostructures<br />
P. Zahl, P. Sutter<br />
P.I-18 Design <strong>of</strong> a Variable Temperature Variable Magnetic Field <strong>Noncontact</strong> Scanning <strong>Force</strong><br />
Microscope for the Characterization <strong>of</strong> Nanoscale Electronic and Magnetic Phenomena<br />
P. Staffier, M. Liebmann, J. Falter, N. Pilet, Ch. Ahn, U. D. Schwarz<br />
P.I-19 An Active Q Control System in Scanning <strong>Force</strong> <strong>Microscopy</strong><br />
J. Kim, M. Zech, J. E. H<strong>of</strong>fman<br />
P.I-20 Besocke style quartz tuning fork FM-AFM/STM for use in UHV and low temperatures<br />
S. M. Huston, R. T. Port, K. M. Andrews, Th. P. Pearl<br />
P.I-21 Design <strong>of</strong> a Low Temperature <strong>Noncontact</strong> <strong>Atomic</strong> <strong>Force</strong> Microscope Combined with a Field<br />
Ion Microscope<br />
J. Falter, D.-A. Braun, H. Hölscher, U. D. Schwarz, A. Schirmeisen, H. Fuchs<br />
P.I-22 A homebuilt low-temperature STM / tuning fork AFM combination<br />
M. Lange, J. Schaffert, N. Wintjes, R. Möller<br />
P.I-23 Development <strong>of</strong> quartz force sensors for noncontact atomic force microscopy/spectroscopy<br />
K. Hori, T. Arai, M. Tomitori<br />
P.I-24 High-Speed Frequency Modulation <strong>Atomic</strong> <strong>Force</strong> <strong>Microscopy</strong> using Wideband Digital<br />
Phase-Locked Loop Detector<br />
T. Fukuma, Y. Mitan<br />
Method Development<br />
P.I-25 Recent Advances in Multi-Spectral <strong>Atomic</strong> <strong>Force</strong> <strong>Microscopy</strong><br />
S. Jesse, N. Balke, P. Maksymovych, O. Ovchinnikov, A.P. Baddorf, S.V. Kalinin<br />
P.I-26 Deciphering Nanoscale Interactions: Artificial Neural Networks and Scanning Probe<br />
<strong>Microscopy</strong><br />
M. Nikiforov, S. Jesse, O. Ovchinnikov, S. V. Kalinin<br />
P.I-27 NC-AFM study <strong>of</strong> a cleaved InAs (110) surface using modified Si probes under ambient<br />
atmospheric pressure<br />
Y. Jeong, M. Hirade, R. Kokawa, H. Yamada, K. Kobayashi, N. Oyabu, H. Yamatani, T.<br />
Arai, A. Sasahara, M. Tomitori<br />
P.I-28 Dual-Frequency-Modulation AFM Spectroscopy<br />
G. Chawla, C. A. Wright, S. D. Solares<br />
P.I-29 Theory <strong>of</strong> Multifrequency Method in FM-AFM<br />
Z. Ma, Y. Naitoh, Y. Li, M. Kageshima, Y. Sugawara<br />
P.I-30 Internal Resonances and Spatio-Temporal Instabilities in Nonlinear Multi-mode NC-AFM<br />
Dynamics<br />
O. Gottlieb, S. Hornstein, W. Wu, A. Shavit<br />
23
Poster Session I cont. (Tuesday)<br />
P.I-31 Frequency Noise in Frequency Modulation <strong>Atomic</strong> <strong>Force</strong> <strong>Microscopy</strong><br />
K. Kobayashi, H. Yamada, K. Matsushige<br />
P.I-32 Relation between lateral forces and dissipation in FM-AFM<br />
M. Klocke, D. E. Wolf<br />
P.I-33 Experimental Study <strong>of</strong> Dissipation Mechanisms in AFM Cantilevers<br />
F. Zypman<br />
Nanolithography<br />
P.I-34 Ultrasonic Nanolithography on Hard Substrates<br />
M. T. Cuberes<br />
P.I-35 Silicon nanowire transistors with a channel width <strong>of</strong> 4 nm fabricated by atomic force<br />
microscope nanolithography<br />
J. Martinez, R. V. Martinez, R. Garcia<br />
P.I-36 Contacting self-ordered molecular wires by nanostencil lithography<br />
L. Gross, R. R. Schlittler, G. Meyer, Th. Glatzel, S. Kawai, S. Koch, E. Meyer<br />
24
POSTER Session II (Wednesday)<br />
Molecules<br />
25<br />
Chair: Y. Sugawara<br />
P.II-01 Molecular Structures <strong>of</strong> Organic Single Crystals Investigated by Frequency Modulation<br />
<strong>Atomic</strong> <strong>Force</strong> Microscopes<br />
T. Minato, H. Aoki, T. Wagner, K. Itaya<br />
P.II-02 Imaging <strong>of</strong> aromatic molecules by tuning-fork based LT-NC-AFM<br />
B. Such, Th. Glatzel, S. Kawai, S. Koch, A. Barat<strong>of</strong>f, E. Meyer, C. H. M. Amijs, P. de<br />
Mendoza, A. M. Echavarren<br />
P.II-03 One and Two Dimensional Structure <strong>of</strong> Water on Cu(110) and O/Cu(110)-(2x1) Surface<br />
B. Y. Choi, Y. Shi, T. Duden, M. Salmeron<br />
P.II-04 Dynamical simulations <strong>of</strong> truxene molecules adsorbed on the KBr (001) surface<br />
T. Trevethan, A. Shluger<br />
P.II-05 Temperature-dependent growth <strong>of</strong> C60 on CaF2(111)<br />
F. Loske, P. Maaß, J. Schütte, A. Kühnle<br />
P.II-06 Creating 1D nanostructures: Heptahelicene-carboxylic acid on Calcite<br />
P. Rahe, M. Nimmrich, J. Schütte, I. G. Stara, A. Kühnle<br />
P.II-07 <strong>Atomic</strong> <strong>Force</strong> <strong>Microscopy</strong> Study <strong>of</strong> Cross-Linked C32H66 Monolayer by Low-Energy (10eV)<br />
Hyperthermal Bombardment<br />
Y. Liu, H.Y. Nie, D.Q. Yang, M.W. Lau, J. Yang<br />
P.II-08 Towards a molecule-based Ferroelectric-OFET: surface modification <strong>of</strong> PZT mediated<br />
through functionalized thiophene derivates<br />
P. Milde, K. Haubner, E. Jaehne, D. Köhler, U. Zerweck, L. M. Eng<br />
P.II-09 Imaging and Detection <strong>of</strong> Single Molecule Recognition Events on Organic Semiconductor<br />
Surfaces<br />
N. S. Losilla, J. Preiner, A. Ebner, P. Annibale, F. Biscarini, R. Garcia, P. Hinterdorfer<br />
P.II-10 Transverse conductance image <strong>of</strong> DNA probed by current-feedback noncontact AFM<br />
T. Matsumoto, Y. Maeda, T. Kawai<br />
P.II-11 Imaging Schwann Cell NGF Receptors using <strong>Atomic</strong> <strong>Force</strong> <strong>Microscopy</strong><br />
R. Williamson, Cheryl Miller<br />
Liquids<br />
P.II-12 Comparative Studies on Water Structures on Hydrophilic and Hydrophobic Surfaces by<br />
FM-AFM<br />
K. Suzuki, N. Oyabu, K. Kobayashi, K. Matsushige, H. Yamada<br />
P.II-13 Molecular Resolution Investigation <strong>of</strong> Lysozyme Crystal in Liquid by Frequency-Modulation<br />
AFM<br />
K. Nagashima, M. Abe, S. Morita, N. Oyabu, K. Kobayashi, H. Yamada, R. Murai, H.<br />
Adachi, K. Takano, H. Matsumura, S. Murakami, T. Inoue, Y. Mori, M. Ohta, R. Kokawa<br />
P.II-14 <strong>Noncontact</strong> <strong>Atomic</strong> <strong>Force</strong> Microscope Observation <strong>of</strong> TiO2(110) Surface in Pure Water<br />
A. Sasahara, Y. Jeong, M. Tomitori<br />
P.II-15 Development <strong>of</strong> Multifrequency High-speed NC-AFM in Liquid<br />
Y. J. Li, K. Takahashi, N. Kobayashi, Y. Naitoh, M. Kageshima, Y. Sugawara
Poster Session II cont. (Wednesday)<br />
P.II-16 Frequency-Domain and Time-Domain Analyses <strong>of</strong> S<strong>of</strong>t-Matter Dynamics Using Wide-Band<br />
Magnetic Excitation AFM<br />
M. Kageshima, T. Ogawa, S. Kurachi, Y. Naitoh, Y. J. Li, Y. Sugawara<br />
P.II-17 <strong>Noncontact</strong> observation in liquid with van der Pol-type FM-AFM<br />
M. Kuroda, H. Yabuno, T. Someya, R. Kokawa, M. Ohta<br />
P.II-18 Development <strong>of</strong> a NC – AFM for Ambient and Liquid Environments<br />
H. I. Rasool, S. Sharma, J. K. Gimzewski<br />
P.II-19 Cantilever Holder Design for Spurious-Free Cantilever Excitation in Liquid by Piezoactuator<br />
H. Asakawa, T. Fukuma<br />
Oxides and Insulators<br />
P.II-20 The different faces <strong>of</strong> the calcite (10-14) surface<br />
J. Schütte, L. Tröger, P. Rahe, R. Bechstein, A. Kühnle<br />
P.II-21 Manipulation Mechanism <strong>of</strong> Single Cu Atoms on Cu(110)-O Surface with Low Temperature<br />
Non-Contact AFM<br />
Y. Kinoshita, T. Satoh, Y. J. Li, Y. Naitoh, M. Kageshima, Y. Sugawara<br />
P.II-22 Simultaneous NC-AFM/STM Imaging <strong>of</strong> the Surface Oxide Layer on Cu(100) and<br />
Identification <strong>of</strong> Lattice Sites<br />
M. Z. Baykara, T. C. Schwendemann, E. I. Altman, U. D. Schwarz<br />
P.II-23 nc-AFM Investigations <strong>of</strong> Metal Nanoclusters on α-alumina<br />
K. Venkataramani, M. C. R. Jensen, M. Reichling, F. Besenbacher, J. V. Lauritsen<br />
P.II-24 Atom-resolved AFM studies <strong>of</strong> the polar MgAl2O4 (001) surface<br />
M. K. Rasmussen, J. V. Lauritsen, F. Besenbacher<br />
P.II-25 Contrast formation on cross-linked (1x2) reconstructed titania (110)<br />
H. H. Pieper, S. Torbrügge, S. Bahr, K. Venkataramani, A. Kühnle, M. Reichling<br />
P.II-26 Nano volcanoes – the surface structure <strong>of</strong> antimony-doped TiO2(110)<br />
R. Bechstein, M. Kitta, J. Schütte, H. Onishi, A. Kühnle<br />
Electronic and Magnetic Properties<br />
P.II-27 Non-contact scanning nonlinear dielectric microscopy imaging <strong>of</strong> TiO2 (110) surfaces<br />
N. Kin, Y. Cho<br />
P.II-28 Characterizations <strong>of</strong> Carbon Material by Non-contact Scanning Non-linear Dielectric<br />
<strong>Microscopy</strong><br />
S. Kobayashi, Y. Cho<br />
P.II-29 Local Dielectric Spectroscopy <strong>of</strong> Nanocomposite Materials Interfaces<br />
M. Labardi, D. Prevosto, S. Capaccioli, M. Lucchesi, P.A. Rolla<br />
P.II-30 Probing Local Bias-Induced Phase Transitions on the Single Defect Level: from Imaging to<br />
Deterministic Mechanisms<br />
N. Balke, S. Jesse, P. Maksymovych, Y.H. Chu, R. Ramesh, S. Choudhury, L.Q. Chen,<br />
S.V. Kalinin<br />
P.II-31 Polarization-dependent electron tunneling into ferroelectric surfaces<br />
P. Maksymovych, S. Jesse, P. Yu, R. Ramesh, A. P. Baddorf, S. V. Kalinin<br />
P.II-32 Local ferroelectric and magnetic investigations on multiferroic thin films<br />
U. Zerweck, D. Köhler, P. Milde, Ch. Loppacher, S. Geprägs, S.T.B. Goennenwein, R.<br />
Gross, L.M. Eng<br />
26
Poster Session II cont. (Wednesday)<br />
P.II-33 Magnetic Resonance <strong>Force</strong> <strong>Microscopy</strong> in Anisotropic Systems<br />
T. Fan, V. I. Tsifrinovich<br />
P.II-34 Sub-10 nm resolution in Magnetic <strong>Force</strong> <strong>Microscopy</strong> (MFM) at ambient conditions<br />
Ö. Karcı, H. Atalan, M. Dede, Ü. Çelik, A.Oral<br />
P.II-35 Enhancement <strong>of</strong> the Exchange-bias Effect based on Quantitative Magnetic <strong>Force</strong><br />
<strong>Microscopy</strong> Results<br />
N. Pilet, M.A. Marioni, S. Romer, N. Joshi, S. Özer, H.J. Hug<br />
27
Oral<br />
Presentations<br />
Monday, 10 August<br />
28
Non-retarded and retarded interactions between dielectric cylinders<br />
Mo-0900<br />
R. Podgornik 1,2 , Antonio Šiber 3 , Rick Rajter 4 , Roger H. French 5 , W.Y. Ching 6 , and V.<br />
Adrian Parsegian 2<br />
1 Faculty <strong>of</strong> Mathematics and Physics, University <strong>of</strong> Ljubljana, Ljubljana, Slovenia and Department<br />
<strong>of</strong> Theoretical Physics, J. Stefan Institute, SI-1000 Ljubljana, Slovenia<br />
2 Laboratory <strong>of</strong> Physical and Structural Biology, NICHD, National Institutes <strong>of</strong> Health, Bldg. 9,<br />
Room 1E116, Bethesda, Maryland 20892-0924, USA.<br />
3 Institute <strong>of</strong> Physics, P.O. Box 304, 10001 Zagreb, Croatia<br />
4 Department <strong>of</strong> Materials Science and <strong>Engineering</strong>, Massachusetts Institute <strong>of</strong> Technology, Room 13-<br />
5046 Cambridge, Massachusetts 02139, USA<br />
5 DuPont Co. Central Research, Experimental Station, E400-5207 Wilmington, Delaware 19880, USA<br />
6 Department <strong>of</strong> Physics, University <strong>of</strong> Missouri-Kansas City, Kansas City, Missouri, 64110, USA<br />
I will present a complete theory <strong>of</strong> non-retarded and retarded van der Waals<br />
interactions between dielectric cylinders. It is based on the Lifshitz formulation <strong>of</strong> the<br />
interactions between two anisotropic semiinfinite media as was worked out by Yu.<br />
Barash [1] in the complete retarded case. One then recasts the two semiinfinite media<br />
problem into two anisotropic cylinders problem by expanding the dielectric response<br />
function as a function <strong>of</strong> the density <strong>of</strong> the dielectric cylinders that constitute the two<br />
media. The first order in the density expansion yields the semiinfinite plane-cylinder<br />
interaction and the second order term the cylinder-cylinder interaction. Explicit formulae<br />
are obtained for this interaction and the interaction is evaluated for different examples <strong>of</strong><br />
ab initio carbon nanotube dielectric response functions. The non-retarded case has<br />
already been discussed in our previous publications [2,3]. I will thus concentrate on the<br />
features <strong>of</strong> the van der Waals interaction that are introduced by the retardation and<br />
orientation effects.<br />
[1] Yu. S. Barash, Izv. Vyssh. Uchebn. Zaved. Radi<strong>of</strong>iz. 21 163 (1978). J. N. Munday, D. Iannuzzi, Y.<br />
Barash and F. Capasso, Phys. Rev. A 71, 042102 (2005). Erratum <strong>of</strong> the paper J. N. Munday, D.<br />
Iannuzzi, Y. Barash and F. Capasso, Phys. Rev. A 71, 042102 (2005).<br />
[2] Rick F. Rajter, Rudi Podgornik, V. Adrian Parsegian, Roger H. French, and W. Y. Ching: van der<br />
Waals-London dispersion interactions for optically anisotropic cylinders: Metallic and<br />
semiconducting single-wall carbon nanotubes, Phys. Rev B 76, 045417 (2007).<br />
[3] Rick Rajter, Roger H. French, Rudi Podgornik, W. Y. Ching, and V. Adrian Parsegian, Spectral mixing<br />
formulations for van der Waals–London dispersion interactions between multicomponent carbon<br />
nanotubes, Journal <strong>of</strong> Applied Physucs 104, 053513 (2008).<br />
29
Noah Graham 1<br />
Casimir <strong>Force</strong>s from Scattering Theory<br />
1 Department <strong>of</strong> Physics, Middlebury College, Middlebury, VT USA<br />
Mo-0930<br />
Because the parallel-plate geometry <strong>of</strong> Casimir's original calculation is one <strong>of</strong> the most<br />
difficult configurations in which to study the Casimir force experimentally, it is important<br />
to be able to extend this calculation to other situations. I will describe a general set <strong>of</strong><br />
techniques that allow one to obtain precise theoretical predictions <strong>of</strong> the Casimir force for<br />
a wide range <strong>of</strong> geometries and materials. It applies to any situation where the scattering<br />
matrix <strong>of</strong> each individual object can be calculated (or measured), in any basis for which<br />
the decomposition <strong>of</strong> a plane wave is known. Although this approach is simplest at large<br />
distances, it also yields precise results at any separation, as long as the objects do not<br />
overlap in the radial coordinates <strong>of</strong> the bases used for each object. In addition to the<br />
usual situation where the objects are outside <strong>of</strong> each other, these results extend to the case<br />
<strong>of</strong> one object inside another.<br />
The work I will report on has been done in collaboration with Thorsten Emig<br />
(Paris/Cologne) Robert L. Jaffe (MIT), Mehran Kardar (MIT), S. Jamal Rahi (MIT), and<br />
Saad Zaheer (MIT).<br />
30
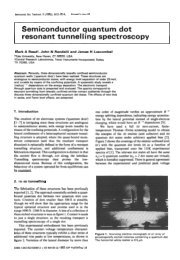
Mo-0955<br />
Multiple Scattering Casimir <strong>Force</strong> Calculations between Layered and<br />
Corrugated Materials<br />
Kimball A. Milton 1 , Inés Cavero-Peláez 2 , Prachi Parashar 1 , K.V. Shajesh 3 ,<br />
and Jef Wagner 1<br />
1 H.L. Dodge Department <strong>of</strong> Physics and Astronomy, University <strong>of</strong> Oklahoma, Norman, OK 73019, USA<br />
2 Laboratoire Kastler Brossel, Université Pierre et Marie Curie, F-75252 Paris, France<br />
3 St Edward's <strong>School</strong>, Vero Beach, FL 32963, USA<br />
Multiple scattering methods have recently proven useful in calculating quantum vacuum<br />
forces between distinct bodies. In fact, 40 years ago such an approach was used to derive<br />
the Lifshitz formula for the force between parallel dielectric slabs. More generally,<br />
numerical results can be readily obtained in many cases, but more remarkably, for weak<br />
coupling (e.g., for dilute dielectrics), closed-form exact expressions can be derived,<br />
reflecting the summation <strong>of</strong> Casimir-Polder forces or their analogues. We have recently<br />
used such methods to derive forces between corrugated planar and cylindrical surfaces.<br />
(See Fig. 1.) For scalar fields with Dirichlet boundary conditions, the forces can be<br />
computed perturbatively in the corrugation amplitudes; 4 th order perturbative results<br />
agree closely with the exact results for weak coupling. We are now extending such<br />
calculations to electromagnetism and to general multilayered surfaces (see Fig. 2), where<br />
again exact results can be obtained in many cases. These results will have important<br />
applications to experimentally accessible situations, and to nanomachinery. The<br />
extension to finite temperature will be explored in the near future.<br />
Fig. 1 Fig. 2<br />
Figure 1: Concentric corrugated gears. The corrugations have equal spatial frequency. The stable<br />
equilibrium configuration occurs when the outer troughs align with the inner peaks. If the gears<br />
are misaligned, a torque is exerted on one cylinder due to the other.<br />
Figure 2: Multilayered surface. The Casimir energy between two such layered potentials can be<br />
calculated in closed form.<br />
31
Drude corrections to Casimir force calculations in liquids<br />
Raul Esquivel-Sirvent 1<br />
1 Instituto de Física, Universidad Nacioanl Autónoma de México, México D.F. 01000.<br />
Mo-1050<br />
The Casimir force for metals immersed in different fluids has been measured recently<br />
[1,2,3]. The comparison with theory is based on the Lifshitz formula and the knowledge<br />
<strong>of</strong> the dielectric function <strong>of</strong> the involved materials. In the case <strong>of</strong> the reported<br />
experiments, Au is a common metal used in the force measurements. The data for the<br />
dielectric function <strong>of</strong> Au can be obtained from tabulated data with a low frequency<br />
interpolation using the Drude model. The data for the optical properties <strong>of</strong> Au are usually<br />
measured in air or partial vacuum. However, changes in the Drude parameters <strong>of</strong> metals<br />
when immersed in fluids have been reported in the literature. Gugger [4] using the<br />
method <strong>of</strong> total attenuated internal reflection measured the dielectric function <strong>of</strong> Ag films<br />
in contact with different liquids. The measurements showed a change in the dielectric<br />
function <strong>of</strong> the Ag film depending on the index <strong>of</strong> refraction <strong>of</strong> the fluids. The same<br />
conclusion was reached in the work <strong>of</strong> Chen [5] that by means <strong>of</strong> spectroscopic<br />
ellipsometry measured the Drude parameters for Au and Ag films immersed in liquids,<br />
confirming the change in the Drude parameters <strong>of</strong> the metals.<br />
In this paper we examine the change in the Casimir force between two Au surfaces<br />
immersed in different fluids and how the change in the Drude parameters affects the<br />
Casimir force calculations. In particular, we show that variations <strong>of</strong> the order <strong>of</strong> 8% are<br />
possible and observed discrepancies between theory and experiment can be explained<br />
by this effect. The change <strong>of</strong> the Drude parameters <strong>of</strong> a metal immersed in a fluid are<br />
described by a Bruggeman effective medium theory. Finally, we discuss the possible<br />
applications <strong>of</strong> effective medium theories within the Lifshitz formalism.<br />
[1] J. N. Munday and F. Capasso, Phys. Rev. A 75, 060102(R) (2007).<br />
[2] J. N. Munday, F. Capasso, V. A. Parseguian and S. M. Bezrukov, Phys. Rev. A 78,<br />
029906 (2008).<br />
[3] P. J. van Zwol, G. Palasantzas and J. Th. M. De Hosson, Phys. Rev. B 79, 195428<br />
(2009).<br />
[4] H. Guger, M. Jurich and J. D. Swalen, Phys. Rev. B 30, 4189 (1984).<br />
[5] L. Y. Chen and D. W. Lynch, Phys. Rev. B 36, 1425 (1987).<br />
32
Diego Dalvit 1<br />
Dispersive Casimir interactions between atoms and surfaces<br />
1 Theoretical Devision, MS B213 , Los Alamos National Laboratory, Los Alamos, NM 87545, USA.<br />
Mo-1115<br />
Casimir atom-surface interactions may be important in experiments involving atoms in<br />
proximity to surfaces, such as atom chips for quantum information processing. In this talk<br />
I will review a general scattering approach to Casimir atom-surface forces, and give some<br />
examples <strong>of</strong> its utility in the calculation <strong>of</strong> non-trivial geometrical effects <strong>of</strong> the quantum<br />
vacuum, such as lateral Casimir-Polder forces. I will then briefly describe two proposals<br />
to use Bose-Einstein condensates (BEC) to probe lateral Casimir forces for atoms above<br />
corrugated surfaces: a "BEC cantilever" sensitive to gradients <strong>of</strong> the atom-surface force,<br />
and BEC Bragg spectroscopy directly sensitive to the atom-surface potential.<br />
33
Mo-1140<br />
Van der Waals with a twist: how nanotube chirality impacts interaction<br />
Rick F. Rajter 1<br />
strength.<br />
1Department <strong>of</strong> Materials Science and <strong>Engineering</strong>, Massachusetts Institute <strong>of</strong> Technology, Cambridge,<br />
MA, USA<br />
The van der Waals - London dispersion interaction depends on the geometries and optical<br />
properties <strong>of</strong> all materials or components present within a given system. The ongoing<br />
investigation <strong>of</strong> the material property contribution to this interaction continues to yield<br />
novel and sometimes surprising phenomenon. A chronological review <strong>of</strong> these<br />
developments helps underline the importance <strong>of</strong> material property thinking and why these<br />
effects must be considered. When first discovered, the differences in interaction strength<br />
were largely attributed to variations in atomic composition, such as that between various<br />
noble gases. Once Lifshitz quantified the connection <strong>of</strong> interaction strength to the<br />
system’s optical properties, differences in said interactions were also predicted and<br />
confirmed for allotropes. Perhaps the most obvious example is that <strong>of</strong> carbon, which can<br />
take the form <strong>of</strong> diamond, graphite, graphene, nanotubes, buckyballs, ribbons, etc. Here,<br />
it was the bond type that was the differentiating factor. The most recent discovery was<br />
that bond twisting or bending within a given allotrope (i.e. carbon nanotubes) could lead<br />
to equally dramatic changes. One <strong>of</strong> the unique features <strong>of</strong> carbon nanotubes is that a<br />
very small change in the chirality or twist can greatly change the electronic structure<br />
properties, which are the key determining factor a material's optical properties. This<br />
work will show many examples <strong>of</strong> chirality-dependent optical properties and how this<br />
information can be used to create experiments to exploit these differences for a variety <strong>of</strong><br />
applications.<br />
34
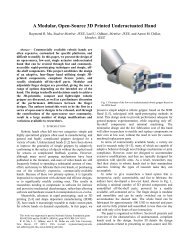
Using Casimir and capillary forces to model adhesion <strong>of</strong> MEMS<br />
cantilevers<br />
Maarten P. de Boer 1 and Frank W. DelRio 2<br />
1 MEMS Technology Dept. Sandia National Laboratories, Albuquerque, NM, USA<br />
2 National Institute <strong>of</strong> Standards and Technology, Gaithersburg, MD, USA<br />
Mo-1205<br />
Long-range Casimir forces set the lower limit <strong>of</strong> unwanted adhesion <strong>of</strong> microscale<br />
cantilevers to a substrate [1]. To quantify this adhesion, we measure deflections <strong>of</strong><br />
actuated MEMS cantilevers (Fig. 1) by interferometry (Fig. 2), and compare to an<br />
energy-release rate model. To understand the values, we develop a detailed model <strong>of</strong> the<br />
interface including surface roughness, contact mechanics and dispersion forces. We find<br />
that when surface roughness is less than 3 nm root mean square, the dispersion forces<br />
dominate adhesion. As surface roughness increases, the real area <strong>of</strong> contact dominates.<br />
Agreement between theory and model is within ± 20% when correlations between the<br />
upper and lower surfaces are taken into account [2]. Adhesion due to capillary forces is<br />
much greater than that from van der Waals forces. In that case, constitutive laws that<br />
incorporate disjoining pressure are needed to explain these very high values [3]. Linking<br />
single asperity models to rough surface models will further develop our understanding in<br />
these areas.<br />
Fig. 1 Cantilever adhesion geometry Fig. 2 Interferograms <strong>of</strong> microcantilevers<br />
References:<br />
[1] F. W. DelRio, M. P. de Boer, J. A. Knapp, E. D. Reedy, P. J. Clews and M. L. Dunn, “The role <strong>of</strong> van<br />
der Waals forces in adhesion <strong>of</strong> micromachined surfaces”, Nature Materials, 4 629 (2005).<br />
[2] F. W. DelRio, M. L. Dunn, L. M. Phinney, C. J. Bourdon and M. P. de Boer, “Rough surface adhesion<br />
in the presence <strong>of</strong> capillary adhesion”, Applied Physics Letters, 90 163104 (2007).<br />
[3] F. W. DelRio, M. L. Dunn and M. P. de Boer, “Capillary adhesion model for contacting<br />
micromachined surfaces. Scripta Materialia, (2008).<br />
Sandia is a multiprogram laboratory operated by Sandia Corporation, a Lockheed Martin<br />
Company, for the United States Department <strong>of</strong> Energy’s National Nuclear Security Administration<br />
under contract DE-AC04-94AL85000.<br />
35
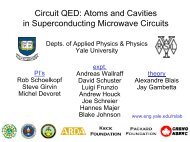
Measuring “Virtual Photon” <strong>Force</strong>s with “Real Photon” <strong>Force</strong>s<br />
Hong X. Tang<br />
Department <strong>of</strong> Electrical <strong>Engineering</strong>, <strong>Yale</strong> University, New Haven, USA<br />
Mo-1430<br />
We present an integrated, all-optical nanomechanical device platform to study Casimir<br />
effect. A versatile optical force 1,2 arising from guided lightwaves (or real photons)<br />
structure is harnessed to provide accurate counter measure <strong>of</strong> the Casimir force (the force<br />
arising from virtual photons). This optical NEMS platform eliminates the electrical<br />
connections to the devices. The interacting surface can be insulator, semiconducting or<br />
metallic. The residual potential problem, which has been recently identified to be a major<br />
source <strong>of</strong> errors in Casimir measurement, is circumvented by fabricating an electrical link<br />
between two interacting surface to null out contact potentials and trapped charges.<br />
c)<br />
Si Si<br />
a)<br />
b)<br />
c)<br />
si<br />
metal metal si<br />
actuator<br />
Metal<br />
Metal<br />
sensor<br />
Figures: All-optical schemes for on-chip measurement <strong>of</strong> Casimir forces. Figure 1: Repulsive optical force<br />
is used to counter the attractive Casimir force between two silicon beams. Figure 2: Optical force is used to<br />
balance the Casimir force between two metal beams.<br />
[1] Mo Li , W. Pernice, C. Xiong, T. Baehr-Jones, M. Hochberg, H. Tang , “Harnessing optical forces in<br />
integrated photonic circuits.”, Nature , 456, 480(2008)<br />
[2] M. Li. W. Pernice, H. Tang, “Tunable bipolar interactions between guided lightwaves” Nature<br />
Photonics (under review, 2009), see also: arxiv:0903.5117<br />
36
Near-field radiative heat transfer<br />
Mo-1455<br />
Alessandro Siria 1, 2 , Emmanuel Rousseau 3 , Jean-Jacques Greffet 3 and Joel Chevrier 1<br />
1 Institut Néel, CNRS and Université Joseph Fourier, 38042 Grenoble France<br />
2 CEA-LETI/MINATEC, 17 avenue des Martyrs 38042 Grenoble France<br />
3 Laboratoire Charles Fabry de L’Institut d’Optique, CNRS UMR, 91127 Palaiseau France<br />
Near-field force and energy exchange between two objects due to quantum and thermal<br />
induced electrodynamic fluctuations give rise to interesting phenomena, such as Casimir<br />
force and thermal radiative transfer exceeding Plank’s theory <strong>of</strong> blackbody radiation. A<br />
theoretical explanation, in the framework <strong>of</strong> stochastic electrodynamics introduced by<br />
Rytov [1] in the late sixties, accounts for quantum and thermodynamic fluctuations. This<br />
theory has been successfully applied to model Casimir forces [2] and radiative heat<br />
transfer [3]. While Casimir force has its origin in quantum fluctuations, related to zero<br />
point energy, near-field radiative heat transfer is only due to classical thermodynamics<br />
fluctuations.<br />
Although significant progresses have been made in the past on the precise measurement<br />
<strong>of</strong> the Casimir force [4, 5], a detailed quantitative comparison between theory and<br />
experiments in the nanometer regime is still lacking when speaking about heat transfer.<br />
Here, we report experimental data on the thermal flux spatial dependence. Theory based<br />
on the Derjaguin approximation, is successfully used here for the first time to describe<br />
radiative heat transfer from the far field to the near field regimes. It reproduces the<br />
measured dependence with an agreement better than 4 % for gaps varying between 40 nm<br />
and 5 μm.<br />
[1] Rytov, S.M., Kratsov, Yu.A., Tatarskii, V.I. Principles <strong>of</strong> statistical Radiophysics, vol<br />
3, Springer-Verlag, New-York, (1987) (Chapter 3)<br />
[2] Lifshitz, E. M. The theory <strong>of</strong> molecuar attractive forces between solids. Zh. Eksp.<br />
Teor. Fiz. 29, 94 (1955) [Sov. Phys. JETP 2, 73 (1956)].<br />
[3] A. V. Shchegrov, K. Joulain, R. Carminati, and J.-J. Greffet, Phys. Rev. Lett. 85, 1548 (2000)<br />
[4] U. Mohideen and A. Roy, Physical Review Letters 81, 4549 (1998)<br />
[5] G. Jourdan, A. Lambrecht, F. Comin, and J. Chevrier, EPL 85, 3, 31001 (2009)<br />
37
Near-field radiative transfer measurements and implications for<br />
Casimir force measurements<br />
Arvind Narayanaswamy 1 , Sheng Shen 2 , Ning Gu 3 , and Gang Chen 2<br />
1 Department <strong>of</strong> Mechanical <strong>Engineering</strong>, Columbia University, New York, USA<br />
2 Department <strong>of</strong> Mechanical <strong>Engineering</strong>, Massachusetts Institute <strong>of</strong> Technology, Cambridge, USA<br />
1 Department <strong>of</strong> Electrical <strong>Engineering</strong>, Columbia University, New York, USA<br />
Mo-1520<br />
Near–field force and energy exchange between two objects due to quantum electrodynamic<br />
fluctuations give rise to interesting phenomena such as Casimir and van der Waals forces,<br />
and thermal radiative transfer exceeding Planck’s theory <strong>of</strong> blackbody radiation. Although<br />
significant progress has been made in the past on the precise measurement <strong>of</strong> Casimir force<br />
related to zero-point energy, experimental demonstration <strong>of</strong> near-field enhancement <strong>of</strong><br />
radiative heat transfer is difficult. In this work, we present a sensitive technique <strong>of</strong> measuring<br />
near–field radiative transfer between a microsphere and a substrate using a bi–material<br />
atomic force microscope (AFM) cantilever, resulting in “heat transfer-distance” curves.<br />
Measurements <strong>of</strong> radiative transfer between a sphere and a flat substrate show the presence <strong>of</strong><br />
strong near–field effects resulting in enhancement <strong>of</strong> heat transfer over the predictions <strong>of</strong> the<br />
Planck blackbody radiation theory. We have been able to identify unambiguously the<br />
contribution <strong>of</strong> electromagnetic surface phonon polaritons to near-field radiative transfer. The<br />
implications <strong>of</strong> measurement <strong>of</strong> near-field radiative heat transfer for determining <strong>of</strong> the<br />
magnitude <strong>of</strong> the thermal component <strong>of</strong> the Casimir force will be discussed.<br />
38
Mo-1615<br />
Tricks and facts in a high precision measurement <strong>of</strong> the Casimir force<br />
with transparent conductors<br />
S. de Man 1 , K. Heeck 1 , R. J. Wijngaarden 1 and D. Iannuzzi 1<br />
1 Department <strong>of</strong> Physics and Astronomy, Faculty <strong>of</strong> Sciences, VU University Amsterdam, The Netherlands<br />
The most promising and simple tool to tailor the Casimir force is to alter the behavior <strong>of</strong><br />
quantum fluctuations by properly choosing the materials on the interacting surfaces.<br />
According to the Lifshitz theory, the interaction between two objects depends on their<br />
dielectric functions. Transparent dielectrics, for example, attract less than reflective<br />
mirrors. Unfortunately, transparent dielectrics are prone to charge accumulation. Even a<br />
small amount <strong>of</strong> charges can give rise to electrostatic forces that easily overcome the<br />
Casimir attraction. For this reason, most <strong>of</strong> the Casimir force experiments reported so far<br />
have been limited to the investigation <strong>of</strong> surfaces coated with metal. In that case,<br />
however, there is not much room to tune the interaction strength, because the diversity in<br />
the dielectric functions <strong>of</strong> different metals is simply not large enough.<br />
In this paper we present a precise experiment where we have investigated the Casimir<br />
force between a gold coated sphere and a glass plate coated with either a thick gold layer<br />
or a highly conductive, transparent oxide film [1]. The measurements were performed in<br />
air, and no electrostatic force due to residual charges was observed over several weeks in<br />
either case. The decrease <strong>of</strong> the Casimir force due to the different dielectric properties <strong>of</strong><br />
the reflective gold layer and the transparent oxide film resulted to be as high as 40%−<br />
50% at all explored separations (from 50 to 150 nm), the largest modification <strong>of</strong> the<br />
Casimir force ever observed at ambient conditions.<br />
In my talk, I will review the new experimental technique we have developed to<br />
simultaneously (i) calibrate the absolute separation between the two surfaces and the<br />
force sensitivity <strong>of</strong> the setup, (ii) compensate for and measure the contact potential, and<br />
(iii) measure the Casimir force. I will comment on the behavior <strong>of</strong> the contact potential as<br />
a function <strong>of</strong> both absolute surface separation and time. I will also address the issues<br />
related to mechanical drifts, and how we are able to control those down to a level <strong>of</strong> 1<br />
nm/hour [2]. Finally, I will discuss how our experimental technique allows us to double<br />
check the electrostatic calibration procedure by investigating the hydrodynamic force that<br />
arises from the cushion <strong>of</strong> air between the two interacting surfaces [1].<br />
[1] S. de Man, K. Heeck, R. J. Wijngaarden, and D. Iannuzzi. arXiv:0901.3720 (2009)<br />
[2] S. de Man, K. Heeck, and D. Iannuzzi. Phys Rev A 79, 024102 (2009)<br />
39
Mo-1640<br />
Measurements <strong>of</strong> the Casimir force gradient by AFM for Different<br />
Materials<br />
Gauthier Torricelli 1 , Stuart Thornton 1 , and Chris Binns 1<br />
1 Department <strong>of</strong> Physics and Astronomy, University <strong>of</strong> Leicester, UK.<br />
We present here quantitative measurements <strong>of</strong> the Casimir force gradient in the 50-600<br />
nm range using a commercial <strong>Atomic</strong> <strong>Force</strong> Microscope operating in UHV (VT AFM<br />
Omicron). The measurements were done in the sphere-plate geometry between a Au<br />
sphere and plates consisting <strong>of</strong> three different classes <strong>of</strong> materials, that is a metal (Au), a<br />
semimetal (HOPG) and a quasicrystal (AlPdMn). The variation in the optical properties<br />
<strong>of</strong> the materials produces clearly observed differences in the Casimir force as predicted<br />
by calculations using the Lifshitz formula. We will discuss in detail the method <strong>of</strong> our<br />
measurements, for which some <strong>of</strong> the key points are listed below:<br />
• The calibration <strong>of</strong> the system is performed using the electrostatic interaction<br />
without any contact between the sphere and the surface.<br />
• The electrostatic interaction is also used to verify the stability <strong>of</strong> our<br />
measurements notably if there is any variation <strong>of</strong> the contact potential.<br />
• A feedback loop is used between two acquisitions in order to prevent any<br />
changes in the distance separation which can be induce by thermal drift<br />
• Several measurements are performed in different area <strong>of</strong> the sample in order to<br />
test the reproducibility <strong>of</strong> the measurement.<br />
40
Measuring the topological dependence <strong>of</strong> the Casimir force on<br />
nanostructured silicon surfaces<br />
Mo-1705<br />
Ho Bun Chan 1 , Y. Bao 1 , J. Zou 1 , R. A. Cirelli 2 , F. Klemens 2 , W. M. Mansfield 2 , and C.<br />
S. Pai 2<br />
1 Department <strong>of</strong> Physics, University <strong>of</strong> Florida, Florida, USA<br />
2 Bell Laboratories, Lucent Technologies, New Jersey, USA.<br />
The Casimir force is usually regarded as an extension <strong>of</strong> the van der Waals (vdW)<br />
interaction between molecules in the retarded limit. By dividing two solid plates into<br />
small elementary constituents and summing up the vdW force, it is possible to recover<br />
the distance dependence <strong>of</strong> the Casimir force between them. For smooth curved surfaces,<br />
the Casimir force is <strong>of</strong>ten calculated using the proximity force approximation (PFA)<br />
when the separation is small. However, the PFA breaks down when the deformation is<br />
strong. In fact, one important characteristic <strong>of</strong> the Casimir force is its strong dependence<br />
on geometry. The Casimir energy for a conducting spherical shell or a rectangular box<br />
has been calculated to have opposite sign to parallel plates. Whether such geometries<br />
exhibit repulsive Casimir forces remains a topic <strong>of</strong> current interest.<br />
We performed an experiment to demonstrate the strong geometry dependence <strong>of</strong> the<br />
Casimir force [1]. The interaction between a gold sphere and a silicon surface with an<br />
array <strong>of</strong> nanoscale, rectangular corrugations is measured using a micromechanical<br />
torsional oscillator. Deviation <strong>of</strong> up to 20% from PFA is observed. The data will be<br />
compared to recent theories on strongly deformed surfaces. In particular, the interplay<br />
between finite conductivity corrections and geometry effects complicates the comparison<br />
<strong>of</strong> data with theories. Ongoing efforts on shallow corrugations will also be presented.<br />
a) b) c)<br />
Figure 1: (a) Cross section <strong>of</strong> the nanoscale rectangular trenches on a silicon surface. (b)<br />
Schematic <strong>of</strong> the experimental setup (not to scale) including the micromechanical torsional<br />
oscillator, gold spheres and silicon trench array. (c) Ratio ρ <strong>of</strong> the measured Casimir force<br />
gradient to the force gradient expected from PFA, for two samples with trench arrays with<br />
different periodicity. The lines represent calculations based on perfect conductors<br />
[1] H. B. Chan, Y. Bai, J. Zou, R. A. Cirelli, F. Klemens, W. M. Mansfiled and C. S. Pai, Phys. Rev. Lett.<br />
100, 030401 (2008).<br />
41
Mo-1730<br />
Short range Casimir force measurements under ambient conditions and<br />
liquid environments<br />
P.J. van Zwol 1 , V.B. Svetovoy 2 , G. Palasantzas 1 , J. Th. M. De Hosson 1<br />
1 Materials Innovation Institute and Zernike Institute for Advanced Materials<br />
University <strong>of</strong> Groningen, 9747 AG Groningen, The Netherlands<br />
2 MESA_Research Institute, University <strong>of</strong> Twente, PO 217, 7500 AE Enschede, The Netherlands<br />
We briefly review ellipsometry [1] and our force measurement in the sphere plane<br />
geometry [2,3] on smooth and rough gold surfaces, and focus specifically on the contact<br />
point between rough surfaces, and the optical quality <strong>of</strong> the surfaces in use. Furthermore<br />
we outline inverse colloid probe force measurements [4] in liquid environment (fig 1), for<br />
which we found local charge variation <strong>of</strong> glass spheres resulting in varying strengths <strong>of</strong><br />
the electrical double layer. In addition we show that when the dielectric function <strong>of</strong> the<br />
liquid becomes comparable to that <strong>of</strong> the surfaces, resulting Casimir forces are very<br />
small. However sample dependence and uncertainty in the measured dielectric functions<br />
indicate that the theory is even more uncertain than the measurements, even if measured<br />
dielectric data is available, for all materials, over all relevant frequency ranges. In the<br />
extreme limit this can lead to the weird situation that small variations in the dielectric<br />
data can lead to a complete change <strong>of</strong> shape <strong>of</strong> the force, flipping between atractive and<br />
repulsive, and multiple atractive-repulsive transitions with distance.<br />
Figure 1: Optical image <strong>of</strong> sintered borisilicate glass spheres on glass.<br />
[1] V. B. Svetovoy, P.J. van Zwol, G. Palasantzas, J. Th. M. DeHosson, Phys. Rev. B 77, 035439 (2008)<br />
[2] P.J. van Zwol, G. Palasantzas, J. Th. M. DeHosson, Phys. Rev. B 77, 075412 (2008)<br />
[3] P.J. van Zwol, G. Palasantzas, M. van de Schootbrugge, J. Th. M. De Hosson, Appl. Phys. Lett. 92, 054101 (2008)<br />
[4] P.J. van Zwol, G. Palasantzas, J. Th. M. DeHosson, To appear in Phys. Rev. E (2009).<br />
42
Mo-1755<br />
Contact potential difference (CPD) in a Casimir force measurement:<br />
How do we deal with it?<br />
W. J. Kim 1 , A. Sushkov 1 , D. A. R. Dalvit 2 , S. K. Lamoreaux 1<br />
1 P. O. Box 208120, Department <strong>of</strong> Physics, <strong>Yale</strong> University, New Haven, CT 06510-8120<br />
2 Theoretical Devision, MS B213 , Los Alamos National Laboratory, Los Alamos, NM 87545, USA<br />
In order to achieve the minimum force condition for a pair <strong>of</strong> conducting plates in electric<br />
force microscopy, one must always apply a non-zero value <strong>of</strong> electric potential difference<br />
across the plates. This so-called contact potential difference (CPD) is ubiquitously<br />
present in all force measurements and poses an enormous challenge for those wishing to<br />
accomplish precision quantification <strong>of</strong> a force <strong>of</strong> non-electrostatic origin, such as van der<br />
Waals force and Casimir force.<br />
In this talk, we will briefly review physical origins <strong>of</strong> CPD and how it has been taken into<br />
previous analysis <strong>of</strong> short-range force measurements. We will also discuss CPD in a<br />
broader context by presenting some <strong>of</strong> the experimental studies undertaken in other<br />
subfields in physics that are challenged by the similar surface potential effects including<br />
gravitational wave missions like LIGO and LISA as well as our recent measurement <strong>of</strong><br />
the Casimir force between Ge plates at <strong>Yale</strong>.<br />
43
Oral<br />
Presentations<br />
Tuesday, 11 August<br />
44
3D Scanning <strong>Force</strong> <strong>Microscopy</strong> at Solid/Liquid Interface<br />
Takeshi Fukuma 1,2 and Yasumasa Ueda 1<br />
1 Frontier Science Organization, Kanazawa University, Kanazawa, Japan<br />
2 PRESTO, Japan Science and Technology Agency, Kawaguchi, Japan.<br />
Tu-0920<br />
The solid/liquid interface inherently has a three-dimensional (3D) extent in XYZ<br />
directions. This is particularly evident when solvation layers exist at the interface [1]. In<br />
frequency modulation atomic force microscopy (FM-AFM), a tip is scanned in XY<br />
directions to produce a 2D height (or Δf ) image having no vertical extent in Z direction.<br />
Therefore, the information contained in a 2D FM-AFM image is insufficient for<br />
understanding 3D distribution <strong>of</strong> solvent molecules interacting with the atoms or<br />
molecules constituting the solid surface. In an effort to resolve this issue, 3D force<br />
mapping technique has been proposed, where a number <strong>of</strong> force curves are measured at<br />
arrayed XY positions. This, however, results in a considerable increase <strong>of</strong> imaging time<br />
and hence has been used mainly in vacuum at low temperatures.<br />
In this study, we propose a method referred to as “3D scanning force microscopy (3D-<br />
SFM)”, where a tip is scanned in Z as well as XY directions. While 3D force mapping is<br />
based on 1D force spectroscopy, 3D-SFM is based on 2D imaging technique. This<br />
methodological advancement, together with our recent development <strong>of</strong> high-speed<br />
scanner and frequency detector, has enabled us to obtain 3D-SFM image <strong>of</strong> mica/water<br />
interface in 53 sec (Fig. 1). The atomically-resolved XY and XZ cross-sectional images<br />
obtained from the 3D-SFM image allow us to correlate the lateral positions <strong>of</strong> the surface<br />
atoms with the vertical distribution <strong>of</strong> the force field. The site-specific Δf vs distance<br />
curves are obtained from the Z pr<strong>of</strong>iles <strong>of</strong> the 3D-SFM image, revealing the remarkable<br />
variation <strong>of</strong> the force pr<strong>of</strong>iles depending on the tip positions. The results demonstrate that<br />
3D-SFM provides diverse information that has not been accessible with conventional 2D<br />
imaging techniques.<br />
Figure 1: (a) XY and XZ cross-sectional images and (b) Δf vs distance curves obtained from a<br />
3D-SFM image <strong>of</strong> mica/water interface (53 sec / 3D image, 0.82 sec / XZ image, Raw data).<br />
[1] T. Fukuma, M. J. Higgins and S. P. Jarvis, Biophys. J. 92 (2007) 3603-3609.<br />
45
Tu-0940<br />
Anisotropic Hydration <strong>of</strong> Biological Molecules Visualized by Three-<br />
Dimensional Scanning <strong>Force</strong> <strong>Microscopy</strong><br />
Hitoshi Asakawa 1 , Yasumasa Ueda 1 and Takeshi Fukuma 1,2<br />
1 Frontier Science Organization, Kanazawa University, Japan<br />
2 PRESTO, JST, Japan<br />
Hydration <strong>of</strong> biological molecules has grave impact on important biological processes<br />
such as membrane fusions and protein activities. However, molecular-scale details <strong>of</strong><br />
local hydration structures have remained to be understood due to the lack <strong>of</strong> a method<br />
able to visualize their three-dimensional (3D) distribution at sub-nanometer resolution. In<br />
order to resolve this issue, we have recently developed a novel technique referred to as<br />
3D scanning force microscopy (3D-SFM). Combined with frequency modulation atomic<br />
force microscopy (FM-AFM) in liquid, the method allows us to record 3D volume data <strong>of</strong><br />
frequency shift (Δf ) induced by tip-sample interaction force in less than 1 min. We are<br />
able to slice the obtained 3D-SFM image in any directions to produce 2D cross-sectional<br />
Δf images.<br />
In this study, we have investigated hydration structures formed at the interface between<br />
a model biological membrane and aqueous solution. A dipalmitoylphosphatidylcholine<br />
(DPPC) bilayer was formed on a cleaved mica surface as a model biological membrane in<br />
HEPES buffer solution. The XY cross-sectional Δf image inserted in Fig. 1(a) was<br />
obtained by slicing the 3D-SFM image near the tip position closest to the membrane<br />
surface. The image shows the pseudo-hexagonal packing <strong>of</strong> DPPC molecules. The<br />
periodic Δf variation corresponding to the DPPC molecule is also found in a crosssectional<br />
image obtained by slicing the 3D-SFM image with a plane perpendicular to the<br />
membrane surface (Fig. 1(b)). The image reveals formation <strong>of</strong> multiple hydration layers<br />
on the DPPC bilayer. In addition, we found that the first hydration layer shows<br />
anisotropic distribution around the DPPC headgroups elongated in one direction in a 3D<br />
space as indicated by the white arrows. The result demonstrates the capability <strong>of</strong> 3D-SFM<br />
for visualizing 3D distribution <strong>of</strong> water molecules interacting with a biological molecule.<br />
a) b)<br />
Figure 1: 3D-SFM images <strong>of</strong> the interface between a DPPC bilayer and HEPES/NaCl (10/100<br />
mM, pH 7.4) buffer solution. (a) Schematic illustration <strong>of</strong> a membrane/water interface. Inset: XY<br />
cross-sectional Δf image, (b) Z cross-sectional Δf image.<br />
46
Tu-1000<br />
Experimental and Theoretical Studies on 3D Hydration Structures<br />
on Muscovite Mica Surfaces in Aqueous Solution<br />
N. Oyabu 1 , K. Kimura 2 , S. Ido 1 , K. Suzuki 1 , K. Kobayashi 3 T. Imai 4 , and H. Yamada 1<br />
1 Department <strong>of</strong> Electronic Science & <strong>Engineering</strong>, Kyoto University, Japan<br />
2 Department <strong>of</strong> Chemistry, Kobe University, Japan<br />
3 Innovative Collaboration Center (ICC), Kyoto University, Japan<br />
4 Computational Science Research Program, RIKEN, Japan<br />
Recent progress in the two-dimensional (2D) frequency shift (Δf) mapping method<br />
using the high-resolution FM-AFM in liquids allows us to investigate molecular-scale<br />
hydration structures on various solid surfaces [1]. A precise comparison <strong>of</strong> the<br />
experimental data with theoretical calculations <strong>of</strong> water structures requires the threedimensional<br />
(3D) Δf mapping method, which can clarify more the relationship between<br />
the crystal site on the surface and the hydration structure. However, there are several<br />
difficulties in the 3D-Δf mapping in liquids including a large, linear and nonlinear<br />
thermal drift <strong>of</strong> the tip position relative to the surface.<br />
We have developed a low-thermal-drift FM-AFM working in liquids based on a<br />
commercial AFM. A sufficiently low, lateral thermal drift rate <strong>of</strong> less than 1 nm/min was<br />
achieved in liquids by an accurate temperature control <strong>of</strong> the environment and by a large<br />
reduction <strong>of</strong> the liquid evaporation. We obtained 3D-Δf data on a muscovite mica surface<br />
in a 1M KCl solution. Figure 1 shows three examples <strong>of</strong> the 2D-Δf image taken out <strong>of</strong> the<br />
3D-Δf data. Figures 2(a) and (b) are constant height (Δf distribution) X-Y images<br />
reconstructed from the 3D-Δf data. The vertical position (Z) <strong>of</strong> the plane <strong>of</strong> Fig. 2(a) is<br />
about 0.2 nm closer to the surface compared to that <strong>of</strong> Fig. 2(b). Figures 2(c) and (d) are<br />
X-Y water density distributions calculated using the 3D reference interaction site model<br />
(3D-RISM) theory at the corresponding vertical positions, respectively. At each position<br />
the experimental image agrees well with the calculated density distribution. In addition,<br />
this 3D-Δf mapping method in liquids has been also applied to the study <strong>of</strong> hydration<br />
structures on biomolecules.<br />
Z1 Z0 Z<br />
Y<br />
X<br />
Figure 1: Three examples <strong>of</strong> the 2D<br />
(X-Z)-Δf mapping image taken out <strong>of</strong><br />
the 3D-Δf data (X = 3 nm, Y = 3 nm, Z<br />
= 3 nm).<br />
Figure 2: (a), (b) Constant height X-Y images reconstructed from<br />
the 3D-Δf data at different heights. The Z-position (a) is 0.2 nm<br />
closer to the surface than the position (b). (c), (d) Water density<br />
distributions calculated by the 3D-RISM theory at the<br />
corresponding heights.<br />
[1] K. Kimura et al., The 11 th International conference on Non-Contact <strong>Atomic</strong> <strong>Force</strong> <strong>Microscopy</strong>, Sept.<br />
2008, Madrid, Spain, Abstract booklet, p62<br />
47
Theory <strong>of</strong> Tip-Sample Interaction <strong>Force</strong> Mediated by Water<br />
M.Tsukada 1 , M.Harada 2 , and K.Tagami 2<br />
1 WPI-Advanced Institute for Materials Research, Tohoku University, Sendai, Japan<br />
2 Advance S<strong>of</strong>t Corp. Tokyo, Japan<br />
Tu-1020<br />
<strong>Noncontact</strong> AFM(ncAFM) in liquids is a powerful method for observing nano-scale<br />
images <strong>of</strong> s<strong>of</strong>t-materials as protein. We are developing theoretical simulation<br />
methodologies <strong>of</strong> ncAFM in liquid[1,2], and by the simulation, we found various<br />
remarkable features <strong>of</strong> tip-surface interaction force mediated by water[2]. They are<br />
obtained either by the molecular dynamics (MD) calculation or by the 3D-RISM<br />
(Reference Interacting Site Model) calculation.<br />
As a case study <strong>of</strong> the MD method, ncAFM images and 3D force map <strong>of</strong> mica surface<br />
in water were calculated and compared with the experiments by Yamada’s Group. The<br />
oscillatory layer structures <strong>of</strong> water exist around the interface tracing the nano-scale<br />
shapes <strong>of</strong> the sample. The phase/amplitude <strong>of</strong> the force oscillation is changed depending<br />
on the lateral tip position, and the 3D force map shows a complicated network structure<br />
<strong>of</strong> attractive and repulsive regions. The numbers <strong>of</strong> the water layers in the narrow gap<br />
decreased abruptly and finally disappears when the tip approaches to the surface.<br />
The 3D-RISM method was applied to clarify the local charge separation effect on the<br />
interaction force in water. The distribution <strong>of</strong> water molecules around the atomically<br />
charged portion on the substrate is considerably disturbed, and this effect is observed in<br />
the force map from far region. We discuss how drastically different the water mediated<br />
tip-sample force compared with that in vacuum, and how they influence on the images.<br />
a) b)<br />
Figure 1 a) Simulated force map <strong>of</strong> mica in water by the MD method, and b)<br />
The distribution function <strong>of</strong> water molecules near the flat solid surface. The atom shown<br />
with red and blue sphere are ionized positively and negatively, respectively.<br />
[1]M. Tsukada, N. Watanabe, Jpn.J.Appl.Phys., vol.48 No.3 2009<br />
[2] Tsukada, Tagami , J.Phys.Soc.Jpn., submitted.<br />
48
Dynamic <strong>Force</strong> Spectroscopy <strong>of</strong> Single Chain-like Molecules<br />
Daniel Ebeling 1 , Harald Fuchs 1 , Filipp Oesterhelt 2 , and Hendrik Hölscher 3<br />
Tu-1120<br />
1<br />
Center for Nanotechnology (CeNTech), Heisenbergstrasse 11, 48149 Münster, Germany and<br />
Physikalisches Institut, Westfälische Wilhelms-Universität Münster, Wilhelm-Klemm-Strasse 10, 48149<br />
Münster, Germany<br />
2<br />
Institut für Physikalische Chemie II, Heinrich-Heine-Universität Düsseldorf, Universitätsstrasse 1,<br />
40225 Düsseldorf, Germany<br />
3<br />
Institute for Microstructure Technology (IMT), Forschungszentrum Karlsruhe, P.O. box 36 70, 76021<br />
Karlsruhe, Germany<br />
In order to measure forces acting on a single chain-like molecule during a stretching<br />
experiment in liquid, we introduce a dynamic approach based on the frequencymodulation<br />
technique with constant-excitation. In difference to the classical approach<br />
where the force is recorded as a conventional force vs. distance curve in a static<br />
measurement, we are able to detect simultaneously the conservative force as well as the<br />
energy dissipation during the elongation <strong>of</strong> a chain-like molecule.<br />
Therefore the amplitude and the frequency shift <strong>of</strong> an oscillating cantilever are measured<br />
during the retraction from the surface (Fig. 1a and b) [1]. The tip-sample force (Fig. 1c)<br />
and the energy dissipation (Fig. 1d) can be reconstructed from these data sets via an<br />
analytical approach. We apply this technique to dextran monomers and demonstrate the<br />
agreement <strong>of</strong> the experimental force curves with a ``single-click'' model [2].<br />
Figure 1: a) Amplitude and b) frequency shift curves measured during approach to and retraction<br />
from the surface covered with dextran molecules. c) <strong>Force</strong> acting on the dextran molecule as a<br />
function <strong>of</strong> the actual tip position. The experimental result is well described by a ``single-click''<br />
model (solid line) d) Energy dissipation per oscillation cycle.<br />
[1] D. Ebeling, F. Oesterhelt, H. Hölscher (submitted).<br />
[2] R. G. Haverkamp, A. T. Marshall, and M. A. K. Williams, Phys. Rev. E 75, 021907 (2007).<br />
49
Spatial force fields above a single atom defect<br />
André Schirmeisen 1 and Domenique Weiner 2<br />
1 CeNTech (Center for Nanotechnology) and Institute <strong>of</strong> Physics, University <strong>of</strong> Muenster, Germany<br />
2 SPECS Zurich GmbH, Switzerland<br />
Tu-1140<br />
<strong>Atomic</strong> force microscopy under ultrahigh vacuum conditions is a powerful tool to<br />
investigate the atomic structure <strong>of</strong> surfaces. The method <strong>of</strong> 3D force field spectroscopy<br />
[1] allows the spatial analysis <strong>of</strong> vertical and lateral interatomic forces [2], as well as the<br />
potential energy landscape with atomic resolution [3]. In this study we focus on the<br />
analysis <strong>of</strong> surface defects on a NaCl(001) crystal by 3D force field spectroscopy. The<br />
spatial force fields along different crystallographic directions were measured above a<br />
defect, which appeared as a valley <strong>of</strong> molecular dimensions in the surface topography.<br />
We find that the vertical tip-sample force directly above the defect is repulsive. From the<br />
force fields we calculate the atomic scale potential energy landscape, which is compared<br />
to model calculations. This model is based on electrostatic interactions <strong>of</strong> hard spheres<br />
and assumes an ion terminated tip apex. According to this model our experimental<br />
potential energy fields agree best with a situation where a single ion is missing in the<br />
surface. This raises interesting questions about the unexpected stability <strong>of</strong> single charge<br />
defects in an ionic surface.<br />
Figure 1: Left: Topography scan <strong>of</strong> NaCl(001) showing a surface defect. Right: Frequency shift<br />
slice extracted from 3D spectroscopy data along a row <strong>of</strong> ions including the surface defect. The<br />
force and energy pr<strong>of</strong>iles best agree with a model assuming a singular missing ion.<br />
[1] Hölscher, Langkat, Schwarz, Wiesendanger, Appl. Phys. Lett. 81, 4428 (2002)<br />
[2] Ruschmeier, Schirmeisen, H<strong>of</strong>fmann, Phys. Rev. Lett 101, 156102 (2008)<br />
[3] Schirmeisen, Weiner, Fuchs, Phys. Rev. Lett. 97, 136101 (2006)<br />
50
Simultaneous measurement <strong>of</strong> force and tunneling current<br />
Tu-1200<br />
Daisuke Sawada, Yoshiaki Sugimoto, Ken-ichi Morita, Masayuki Abe, and Seizo Morita<br />
Graduate school <strong>of</strong> <strong>Engineering</strong>, Osaka University, Osaka, Japan<br />
We have performed simultaneous STM and AFM measurements in the dynamic mode<br />
using Pt-Ir coated Si cantilevers at room temperature. Frequency shift (Δf) and timeaverage<br />
tunneling current () images were obtained by tip scanning on the Si(111)-<br />
(7×7) surface at constant height mode to prevent a crosstalk between these two channels<br />
[Fig.1 (a)]. To compensate the thermal drift <strong>of</strong> the tip-surface distance, feed forward<br />
technique was applied [1]. Analysis <strong>of</strong> 25 sets <strong>of</strong> AFM/STM images using different tips<br />
shows that when atomic resolution is obtained simultaneously by both AFM and STM,<br />
the tunneling current is much larger than the typical values in conventional STM. We<br />
have also performed simultaneous measurements <strong>of</strong> site-specific force/tunneling<br />
spectroscopy. The Δf and versus tip-surface distance curves were converted into the<br />
short-range force (FSR) and the tunneling current (It) at closest separation between the<br />
sample surface and the oscillating tip [Fig.1 (b)]. We observed the drop in the tunneling<br />
current due to the chemical interaction between the tip apex atom and the surface adatom,<br />
which was found recently [2], and estimated the value <strong>of</strong> the chemical bonding force.<br />
Furthermore, scanning tunneling spectroscopy (STS) was performed on the same site<br />
using the same tip [Fig.1 (c)]. The spectrum is in good agreement with previous STM<br />
results. Our results demonstrate that one can quantitatively measure the local density <strong>of</strong><br />
state and the chemical bonding force above the same atom using the same tip [3].<br />
Figure 1: (a) Δf and images <strong>of</strong> a Si(111)-(7×7) surface simultaneously obtained in the<br />
constant height mode at room temperature. The acquisition parameters are f0=284092.5 Hz,<br />
A=300 Å, k=22.9 N/m, and Vs=-400 mV respectively. (b) It-z and FSR-z curves derived from z<br />
and Δf-z curves obtained above a center adatom in a faulted half unit cell, respectively. (c) STS<br />
spectrum and Δf - Vs curves obtained at z=4.4 Å.<br />
[1] M. Abe, et al., Appl. Phys. Lett. 90, 203103 (2007).<br />
[2] P. Jelinek, M. Svec, P. Pou, R. Perez, and V. Chab, Phys. Rev. Lett. 101, 176101 (2008).<br />
[3] D. Sawada, Y. Sugimoto, K. Morita, M. Abe, and S. Morita, Appl. Phys. Lett. in press.<br />
51
Atom Manipulation on Cu(110)-O Surface with LT-AFM<br />
52<br />
Tu-1220<br />
Yasuhiro Sugawara, Yukinori Kinoshita, Yan Jun Li, Yoshitaka Naitoh, and Masami<br />
Kageshima<br />
Department <strong>of</strong> Applied Physics, Osaka University, Suita, Japan<br />
Manipulation <strong>of</strong> single atoms and molecules is an innovative experimental technique<br />
<strong>of</strong> nanoscience. So far, a scanning tunneling microscopy (STM) has been widely used to<br />
fabricate artificial structures by laterally pushing, pulling or sliding single atoms and<br />
molecules. However, the driving forces involved in manipulation have not been<br />
measured. Recently, an atomic force microscopy (AFM) has been also used to manipulate<br />
single atoms and molecules. Atom manipulation with an AFM is particularly promising,<br />
because it allows the direct measurement <strong>of</strong> the required forces [1].<br />
Recently, we investigated the forces in AFM lateral manipulation for a top single Cu<br />
atom (super Cu atom) on the Cu(110)-O surface. In the case <strong>of</strong> Cu-adsorbed AFM tip, the<br />
super Cu atom on the surface was pulled at a lateral tip position on the adjacent binding<br />
site. In contrast, in the case <strong>of</strong> O-adsorbed AFM tip, the super Cu atom was pushed over<br />
the top <strong>of</strong> the super Cu atom. Thus, we found that the forces (attractive or repulsive<br />
forces) to move an atom laterally on the surface strongly depend on the atom species <strong>of</strong><br />
the AFM tip apex and the surface.<br />
In the present study, in order to further clarify the manipulation process depending on<br />
the chemical nature <strong>of</strong> tip-sample interaction, we investigate the full tip-sample potential<br />
landscape necessary to manipulate atoms.<br />
All experiments were performed by using homebuilt noncontact AFM using frequency<br />
modulation technique operating in ultrahigh vacuum at a temperature <strong>of</strong> about 78 K. The<br />
AFM tip apex was coated with Cu or O atoms in situ by slightly making a tip-sample<br />
mechanical contact on the Cu(110)-O surface prior to the imaging. The tip-sample<br />
potentials are determined form the frequency shift versus distance curves by<br />
mathematical analysis. We found that the tip-sample potentials to move the super Cu<br />
atom laterally on the surface strongly depend on the atom species <strong>of</strong> the AFM tip apex<br />
and the surface. These results strongly suggest that the chemical nature <strong>of</strong> tip-sample<br />
interaction plays an important role in lateral atom manipulation. Furthermore, we discuss<br />
the pathways for moving the super Cu atom.<br />
Reference<br />
[1] M. Ternes, C. P. Lutz, C. F.<br />
Hirjibehedin, F. J. Gissibl and<br />
Andreas J. Heinrich. Science,<br />
319, 66 (2008).<br />
(a) (b)<br />
Figure 1: AFM images (a) before and (b) after atom<br />
manipulation performed on Cu(110)-O surface at 78K.
Water, Ions, Membranes, Real Metals, Finite Temperature:<br />
Is there ever a pure Casimir force?<br />
Adrian Parsegian 1<br />
1 National Institutes <strong>of</strong> Health, Bethesda, MD 20892-0924<br />
Tu-1430<br />
The powerful idea <strong>of</strong> vacuum fluctuations strictly confined between ideal metals<br />
dominates the psychology <strong>of</strong> much thinking about electrodynamic forces. In fact, most<br />
systems reveal interactions that depend on material properties wherein fluctuations<br />
penetrate unto permeate interacting bodies. This talk will attempt to delineate<br />
the conditions under which true Casimir forces can be expected as compared with the<br />
material-based van der Waals forces formulated by Lifshitz, Dzyaloshinskii, and<br />
Pitaevskii, then generalized by their descendents.<br />
53
Short and medium range electrostatic forces analyzed by<br />
Kelvin probe force microscopy<br />
Th. Glatzel, S. Kawai, S. Koch, A. Barat<strong>of</strong>f, and E. Meyer<br />
Department <strong>of</strong> Physics, University <strong>of</strong> Basel, 4056 Basel, Switzerland.<br />
Tu-1510<br />
We discuss the influences <strong>of</strong> short and medium range electrostatic forces on the local<br />
contact potential difference (LCPD) by means <strong>of</strong> amplitude modulated Kelvin probe<br />
force microscopy (AM-KPFM) measured on single crystal KBr(100) surfaces. Bias- and<br />
z-spectroscopic curves at atomic scale showing clear features related to the influence <strong>of</strong><br />
the short range electrostatic interaction [1].<br />
In Fig.1 a typical nc-AFM /KPFM measurement <strong>of</strong> a KBr(100) in UHV is shown. While<br />
the topography (a) was measured at the first resonance frequency <strong>of</strong> the cantilever<br />
(approx 160kHz), the LCPD image (b) was measured by compensating the inphase signal<br />
detected at he second resonance (approx 1MHz). A clear contrast between the different<br />
ionic sides is observed. To clarify the origin <strong>of</strong> this contrast we performed bias- and zspectroscopy<br />
measurements. c) shows a bias-spectroscopy measurement illustrating the<br />
amplitude R, the inphase signal X, and the frequency shift at a maxima <strong>of</strong> the topography.<br />
Comparing these measurements with the ones at the minimas <strong>of</strong> the topography (not<br />
presented here) clearly shows the expected CPD difference.<br />
Figure 1: Typical topography (3x3nm 2 , �z=100pm) and<br />
local contact potential image (�LCPD=300mV) <strong>of</strong> a<br />
KBr(100) surface. In c) the lockin signals amplitude R,<br />
inphase X (second resonance <strong>of</strong> the cantilever) as well as<br />
the frequency shift <strong>of</strong> the first resonance �f are plotted<br />
over the bias voltage applied to the sample. The<br />
measurement was done at a maxima <strong>of</strong> the topography.<br />
[1] F. Bocquet et al., Phys. Rev. B 78, (2008), 035410.<br />
54
Tu-1530<br />
The Effective Quality Factor in Dynamic <strong>Force</strong> Microscopes with<br />
Fabry-Perot Interferometer Detection<br />
Hendrik Hölscher 1 , Peter Milde 2 , Ulrich Zerweck 2 , Lukas M. Eng 2 , Regina H<strong>of</strong>fmann 3<br />
1 Institute for Microstructure Technology (IMT), Forschungszentrum Karlsruhe, Karlsruhe, Germany<br />
2 Institut für Angewandte Photophysik, Technische Universität Dresden, Germany<br />
3 Physikalisches Institut and DFG-Center for Functional Nanostructures, Universität Karlsruhe, Germany<br />
Recently, the self-oscillation <strong>of</strong> micr<strong>of</strong>abricated silicon resonators by photo-induced<br />
forces has become a focus <strong>of</strong> current research in order to reach the quantum ground state<br />
[1]. Having these results in mind, it is interesting to note that the experimental set-up<br />
used in these studies is similar in design to the standard instrumentation <strong>of</strong> lowtemperature<br />
ultra-high vacuum atomic force microscopes (LT-UHV-AFM) using<br />
interferometer detection [2,3].<br />
In order to quantify the relevance <strong>of</strong> photo-induced forces for NC-AFM<br />
experiments, we analyzed the oscillation behavior <strong>of</strong> a micr<strong>of</strong>abricated cantilever in a<br />
LT-UHV-AFM with a Fabry-Perot interferometer. We observed that photo-induced<br />
forces depend on the cantilever-fiber distance and that they lead to a pr<strong>of</strong>ound change <strong>of</strong><br />
the effective quality factor <strong>of</strong> the cantilever. Depending on the slope <strong>of</strong> the interference<br />
signal, the effective quality factor <strong>of</strong> the cantilever is increased or decreased. The overall<br />
effect increases with the laser power <strong>of</strong> the laser diode and decreases for higher<br />
temperatures. The Q-factor <strong>of</strong> the cantilever, however, is an essential parameter when the<br />
energy dissipation between tip and sample is measured with a dynamic force microscope.<br />
Hence, the effect addressed here has to be taken into account whenever the cantilever<br />
oscillation is measured with an interferometer at low temperatures.<br />
a) b) c)<br />
Figure 1: (a) Schematic set-up <strong>of</strong> the interferometer used for the detection <strong>of</strong> the cantilever<br />
vibration in dynamic force microscopy (b) The resulting interference intensity is periodic and has<br />
a positive or negative slope. (c) Depending on the slope and the temperature the resonance curves<br />
change dramatically due to a change <strong>of</strong> the effective Q-factor <strong>of</strong> the cantilever.<br />
[1] C. Höberger-Metzger and K. Karrai, Nature 432, 1002 (2004).<br />
[2] D. Rugar, H. J. Mamin, and P. Guethner, Appl. Phys. Lett. 55, 2588 (1989).<br />
[3] A. Moser et al., Meas. Sci. Technol. 4, 769 (1993).<br />
55
Oral<br />
Presentations<br />
Wednesday, 12 August<br />
56
We-0900<br />
Imaging Single Atoms on Oxide Surfaces – Gold on Alumina/NiAl(110)<br />
Markus Heyde, Georg Hermann Simon, Thomas König, and Hans-Joachim Freund<br />
Fritz-Haber-Institute <strong>of</strong> the Max-Planck-Society, Faradayweg 4-6, D-14195 Berlin, Germany<br />
A logical next step after gaining atomic resolution on complex surfaces <strong>of</strong> wide<br />
band-gap materials with FM-DFM is the determination and characterization <strong>of</strong> ad-atom<br />
adsorption sites on such materials. Imaging metal ad-atoms on complex oxide surfaces<br />
with atomic resolution is <strong>of</strong> a certain value in the study <strong>of</strong> these materials and has not<br />
been shown before. Here we present recent work on adsorbed gold atoms on the ultrathin<br />
alumina on NiAl(110) with its large complex surface unit cell as an example. It can be<br />
shown that an established contrast in FM-DFM [1,2] enables the determination <strong>of</strong><br />
adsorption sites with atomic scale precision. This holds despite the fact that gold is rather<br />
easily removed by the tip and gives confidence for atomic scale characterisation and<br />
manipulation <strong>of</strong> ad-species on oxide surfaces with FM-DFM. Obtained results are<br />
compared to density functional theory calculations for preferred adsorption sites <strong>of</strong> gold<br />
atoms on this alumina film [3].<br />
Figure 1: (a) <strong>Atomic</strong> resolution FM-DFM image <strong>of</strong> the ultrathin alumina on NiAl(110). The<br />
large unit cell (here an A domain) is indicated (scan range 4.2 nm × 4.2 nm ). (b) FM-DFM image<br />
<strong>of</strong> adsorbed gold atoms on the alumina film (scan range 10 nm × 10 nm). (c) Preferential<br />
adsorption sites for gold atoms as determined by density functional theory [3].<br />
[1] G. H. Simon, T. König, M. Nilius, H.-P. Rust, M. Heyde, and H.-J. Freund; Phys. Rev. B 78 (2008)<br />
113401.<br />
[2] G. Kresse, M. Schmid, E. Napetschnig, M. Shishkin, L. Köhler, and P. Varga; Science 308 (2005)<br />
1440.<br />
[3] N. Nilius, M.V. Ganduglia-Pirovano, V. Brázdová, M. Kulawik, J. Sauer, and H.-J. Freund; Phys.<br />
Rev. Lett. 100 (2008) 096802.<br />
57
Site-specific force spectroscopy on TiO2 (110) surface at lowtemperature<br />
A. Yurtsever, A. Pratama, Y. Sugimoto, M. Abe, and S. Morita<br />
Graduate <strong>School</strong> <strong>of</strong> <strong>Engineering</strong>, Osaka University, Osaka, Japan<br />
We-0920<br />
Non-contact AFM (nc-AFM) has opened the way for the measurement <strong>of</strong> the forces<br />
that are generated between different kinds <strong>of</strong> interaction on surfaces. Using the homemade<br />
low temperature nc-AFM, we study the site-specific force spectroscopy on the<br />
rutile TiO2 (110)-(1x1) metal oxide surface. The rutile TiO2(110) surface has been<br />
intensively used as a subject <strong>of</strong> numerous surface science investigations over the years<br />
due to its wide variety <strong>of</strong> technological applications such as catalysis, solar cells, surface<br />
protective coatings, and gas sensing devices for pollution control [1]. In AFM, imaging <strong>of</strong><br />
metal-oxide surfaces, the image contrast strongly depends on the chemical constitution <strong>of</strong><br />
the surface layer and the chemical identity <strong>of</strong> the tip-apex structure [2]. Depending on the<br />
polarity <strong>of</strong> tip-apex charged state, the distinct types <strong>of</strong> image contrast are observed. In<br />
order to clarify the imaging mechanism <strong>of</strong> each contrast modes, we need to perform the<br />
measurement <strong>of</strong> force-displacement curves on this surface. By employing the atomtracking<br />
technique [3], force–distance measurements over three different atomic sites,<br />
using three different tip states, were obtained. We observe that the maximum attractive<br />
interaction force is smallest on OH groups for different tip-apex states. In this<br />
contribution, we will discuss the effect <strong>of</strong> the different tip terminations on interaction<br />
force over surface atomic (e.g., Ob, Ti) and defect (e.g., OH) sites.<br />
Figure 1: Low-temperature atomic force microscopy spectroscopic measurements over various<br />
sites in the TiO2 (110) surface. The force versus distance data obtained with a neutral tip (e.g., Si)<br />
(a) and with a positively terminated tip (b). Inset: Shows the corresponding topographic images <strong>of</strong><br />
each contrast modes at the same surface area.<br />
[1] U. Diebold, Surf. Sci. Rep. 48, 53-229 (2003).<br />
[2] G. H. Enevoldsen et al., Phys. Rev. B 78, 045416 (2008).<br />
[3] M. Abe et al., Appl. Phys. Lett. 90, 203103 (2007).<br />
58
We-0940<br />
Character <strong>of</strong> the short-range interaction between a silicon based tip and<br />
the TiO2(110) surface: a DFT study<br />
Cesar Gonzalez 1,2 , Pavel Jelínek 1 , and Ruben Pérez 3<br />
1<br />
Department <strong>of</strong> Thin Films, Institute <strong>of</strong> Physics <strong>of</strong> the ASCR, Prague, Czech Republic<br />
2<br />
Departamento de Superficies y Recubrimientos, Instituto de Ciencia de Materiales de Madrid del CSIC,<br />
Spain<br />
3 Departamento de Fisica Teorica de la Materia Condensada, Universidad Autonoma de Madrid, Spain<br />
Non-contact atomic force microscopy (NC-AFM) provides a rich variety <strong>of</strong> atomic<br />
contrasts on the rutile TiO2 (110) surface, imaging either the bridging oxygen atoms<br />
(hole mode) or the titanium atoms (protrusion mode) [1]. These contrast modes have been<br />
assigned to purely electrostatic interaction. Another contrast mode that does not ?t into<br />
the scheme <strong>of</strong> purely electrostatic interaction, the so-called neutral mode, has also been<br />
reported[]. Recently it has been demonstrated that NC-AFM is capable <strong>of</strong> imaging both,<br />
the bridging oxygen atoms and the titanium rows simultaneously in a new “all inclusive”<br />
mode [3]. Such diversity <strong>of</strong> contrast modes can be attributed to the complex character <strong>of</strong><br />
the short range interaction between tip and characteristic sites <strong>of</strong> the rutile TiO2 (110)<br />
surface driven by (i) a weak short-range electrostatic interaction [4] depending on atomic<br />
termination <strong>of</strong> tip and its polarization and (ii) the onset <strong>of</strong> chemical bond formed between<br />
a tip and surface [5]. A proper characterization <strong>of</strong> the different regimes in the short-range<br />
interaction regime Si-based tips and this oxide surface is crucial for the interpretation <strong>of</strong><br />
the experimental images and the design <strong>of</strong> protocols for single atom manipulation and<br />
chemical identification.<br />
Here we have employed density-functional theory (DFT) calculations to understand<br />
the character <strong>of</strong> tip-sample interaction between clean and contaminated Si-based tips and<br />
the TiO2 surface. We have performed a detailed analysis <strong>of</strong> electronic structure and the<br />
charge transfer between tip and sample. Our calculations show that the relative<br />
contribution <strong>of</strong> the weak short-range electrostatic interaction and the on-set <strong>of</strong> chemical<br />
bonding between the closest tip and surface atoms is very sensitive to the tip-sample<br />
distance, de?ning di? erent interaction regimes along the tip-sample distance. In<br />
particular, we show the short-range electrostatic interaction in weak interaction regime<br />
can provide a complex atomic contrast such as the experimentally reported neutral and<br />
all-inclusive contrast modes.<br />
[1] J.V. Lauritsen et al., Nanotechnology 17, 3436 (2006).<br />
[2] G.H. Enevoldsen et al., Phys. Rev. B 78, 045416 (2008).<br />
[3] R. Bechstein et al (submitted).<br />
[4] A.S. Foster et al., Phys. Rev. B 68, 195420 (2003).<br />
[5] R. Pérez et al., Phys, Rev. B 58, 10835 (1998).<br />
59
We-1000<br />
True atomic resolution imaging on an application-oriented system:<br />
Understanding photocatalytic reactivity <strong>of</strong> transition-metal doped TiO2<br />
Ralf Bechstein 1,2 , Mitsunori Kitta 3 , Jens Schütte 1 , Hiroshi Onishi 3 , and Angelika Kühnle 1<br />
1 Fachbereich Physik, Universität Osnabrück, Barbarastraße 7, 49076 Osnabrück, Germany<br />
2 present address: iNano, Aarhus University, DK-8000 Aarhus C, Denmark<br />
3 Department <strong>of</strong> Chemistry, Kobe University, Rokko-dai, Nada-ku, Kobe 657-8501, Japan.<br />
The influence <strong>of</strong> transition-metal dopants, namely chromium and antimony, on the<br />
surface structure <strong>of</strong> TiO2(110) was investigated at the atomic level using frequency<br />
modulation NC-AFM. We found the vacancy density created upon doping to depend<br />
strongly on the dopant ratio [1, 2], explaining differences in photocatalytic reactivity [3,<br />
4]. The surface roughness and the arrangement at the atomic scale (see e.g. Fig. 1) gave<br />
further insight into the implications <strong>of</strong> doping <strong>of</strong> titanium dioxide.<br />
This work demonstrates that NC-AFM is capable <strong>of</strong> true atomic resolution, even on<br />
rough and highly corrugated surfaces. Thus, it constitutes a step towards investigating<br />
more realistic, application-oriented systems using NC-AFM, revealing detailed insights<br />
into the implications <strong>of</strong> transition-metal doping on the surface structure <strong>of</strong> the wide band<br />
gap photocatalyst titanium dioxide.<br />
(a) (b)<br />
Figure 1: NC-AFM detuning images <strong>of</strong> TiO2(110) codoped with chromium and antimony.<br />
Enhanced surface roughness is observed (a). At a first glance, the atomic structure <strong>of</strong> the doped<br />
surface resembles the structure <strong>of</strong> pristine TiO2(110) (b). A careful analysis <strong>of</strong> the high-resolution<br />
images unravelled a surface reconstruction that closely resembles a (1 x 4) structure, indicating a<br />
firm integration <strong>of</strong> the dopant atoms into the titanium dioxide crystal.<br />
[1] R. Bechstein et al., J. Phys. Chem. C, 113, 3277 (2009).<br />
[2] R. Bechstein et al., submitted to J. Phys. Chem. C (2009).<br />
[3] H. Kato and A. Kudo, Catal. Today 78, 561 (2003).<br />
[4] T. Ikeda et al., J. Phys. Chem. C 112, 1167 (2008).<br />
60
We-1020<br />
Local surface photovoltage spectroscopy <strong>of</strong> molecular clusters using<br />
Kelvin probe force microscopy<br />
Sascha Sadewasser, Martha Ch. Lux-Steiner<br />
Helmholtz Zentrum Berlin für Materialien und Energie, Glienicker Str. 100, 14109 Berlin, Germany<br />
The high optical absorption properties <strong>of</strong> organic molecules are <strong>of</strong> high interest for<br />
photovoltaic application, as well in purely organic as in dye sensitized solar cells. In the<br />
latter, the electron conductor is typically a porous TiO2, which is used to enhance the<br />
surface and contact areas. Investigation <strong>of</strong> the local optoelectronic properties <strong>of</strong> such<br />
molecules and interfaces is <strong>of</strong> high interest for the understanding <strong>of</strong> charge separation<br />
processes and ultimately the improvement <strong>of</strong> these types <strong>of</strong> solar cells.<br />
With the goal to gain access to optoelectronic properties on the nanometer scale, we<br />
have recently set up a surface photovoltage spectroscopy (SPS) system in combination<br />
with a Kelvin probe force microscope (KPFM) operated in ultra high vacuum (UHV).<br />
Sample illumination is realized by a halogen lamp and monochromator in the visible<br />
spectrum range using an optical fiber introduced into the UHV. Using chopped light and<br />
lock-in detection the SPV signal can be measured with a sensitivity <strong>of</strong> better than 1mV.<br />
For the KPFM operation we use the resonant amplitude modulation technique, which<br />
allows using a low modulation voltage (~0.1V).<br />
Here we present a study <strong>of</strong> various organic molecules used in organic and dye<br />
sensitized solar cells. For the case <strong>of</strong> the dye N3, small amounts <strong>of</strong> molecules were<br />
deposited onto TiO2 single crystals and subsequently measured by SPS in the UHV-<br />
KPFM. Fig. 1 shows the topography and work function image <strong>of</strong> the sample, clearly<br />
showing a higher work function for the molecule clusters. Spectroscopy in various points<br />
on the sample shows clearly distinct spectra on the molecules as compared to the TiO2<br />
surface. The absorption and charge separation <strong>of</strong> the various molecules will be discussed<br />
comparatively.<br />
Figure 1: (a) Topography (800×800 nm 2 ) and (b) corresponding work function image obtained<br />
by KPFM. The symbols indicate the position <strong>of</strong> SPV spectra. (c) Averaged SPV spectra taken on<br />
TiO2 (squares) and on N3 molecule clusters (circles). Clearly the enhanced absorption <strong>of</strong> N3 in<br />
the range below ~ 600 nm can be seen.<br />
61
We-1120<br />
Why is Graphite so Slippery? Gathering Clues from Three-Dimensional<br />
Lateral <strong>Force</strong>s Measurements<br />
Udo D. Schwarz 1 , Mehmet Z. Baykara 1 , Todd C. Schwendemann 1,2 , Boris J. Albers 1 ,<br />
Nicolas Pilet 1 , and Eric I. Altman 2<br />
1<br />
Department <strong>of</strong> Mechanical <strong>Engineering</strong> and Center for Research on Interface Structures and Phenomena<br />
(CRISP), <strong>Yale</strong> University, New Haven, USA<br />
2<br />
Department <strong>of</strong> Chemical <strong>Engineering</strong> and Center for Research on Interface Structures and Phenomena<br />
(CRISP), <strong>Yale</strong> University, New Haven, USA<br />
Conventional lateral force experiments give insufficient insight into the fundamental<br />
reasons for graphite’s outstanding qualities as a solid lubricant due to an averaging effect<br />
caused by the finite contact area <strong>of</strong> the tip with the sample. To overcome this limitation,<br />
we used a noncontact atomic force microscopy-based approach that enables use <strong>of</strong><br />
atomically sharp tips. The new technique [1], performed using a home-built low<br />
temperature, ultrahigh vacuum atomic force microscope [2], allows the measurement <strong>of</strong><br />
normal and lateral surface forces in all three dimensions with picometer and piconewton<br />
resolution.<br />
In this presentation, we analyze the height and lattice site dependence <strong>of</strong> lateral forces,<br />
their dependence on normal load, and the effect <strong>of</strong> tip shape in detail. The lateral forces<br />
are found to be heavily concentrated in the hollow sites <strong>of</strong> the graphite lattice, surrounded<br />
by a matrix <strong>of</strong> vanishingly small lateral forces. It will be argued that this astonishing<br />
localization may be a reason for graphite’s excellent lubrication properties. In addition,<br />
the distance and load dependence <strong>of</strong> the lateral forces experienced along possible “escape<br />
routes” from the hollow sites, which would be followed by a slider that is dragged out <strong>of</strong><br />
them, are studied. Surprisingly, the maximum lateral forces along these escape routes,<br />
which ultimately determine the static friction, are found to depend linearly on normal<br />
load, suggesting the validity <strong>of</strong> Amontons' law in the noncontact regime.<br />
Figure 1: a) Possible escape routes which would be preferred by a nanoslider as it is dragged<br />
away from a hollow site. b) Dependence <strong>of</strong> static friction in direction (I) on normal load.<br />
[1] B. J. Albers et al., Nature Nanotechnology 4, 307 (2009).<br />
[2] B. J. Albers et al., Rev. Sci Instrum. 79, 033704 (2008).<br />
62
We-1140<br />
Theoretical DFT simulations <strong>of</strong> the STM/AFM atomic scale imaging on<br />
graphite.<br />
Vít Rozsíval 1 , Martin Ondráček 1 , Pavel Jelínek 1<br />
1 Department <strong>of</strong> Thin Films, Institute <strong>of</strong> Physics <strong>of</strong> the ASCR, Prague, Czech Republic<br />
Graphite is used as a standard benchmark surface to achieve atomic resolution by<br />
Scanning Probe Methods (SPM). True atomic scale contrast <strong>of</strong> graphite provided by<br />
simultaneous measurement <strong>of</strong> both forces and tunneling current is still source <strong>of</strong><br />
controversy [1-3]. The hexagonal surface unit cell contains to non-equivalent atoms: the<br />
α-site atom located directly above adjacent planes and β-site atom above the hollow site.<br />
While there is a consensus on STM measurements seeing every second, β-site, atom in<br />
the hexagonal unit cell [4], the situation turns more conflicting in the case <strong>of</strong> nc-AFM<br />
experiments. Main doubt arises where the maximum <strong>of</strong> the contrast is located: (i) over<br />
hollow site [2] or one C atom [1]; and (ii) if the α and β atoms can be distinguished by<br />
nc-AFM.<br />
The direct quantitative interpretation <strong>of</strong> SPM measurements in the near-to-contact<br />
mode is a not straightforward task due to several factors playing an important role in<br />
imaging processes. Realistic conductance calculations have to involve properly several<br />
effects: e.g. the tip/surface structural relaxations and multiple electron scattering to<br />
understand properly the relation between forces and currents measured in experiments<br />
[5]. Here we performed state-<strong>of</strong>-the-art theoretical studies based on a combination <strong>of</strong> total<br />
energy DFT calculations with a Green's function approach for the electron STM transport<br />
[5] between silicon or tungsten tip and graphite. We analyzed the electronic structure<br />
evolution along tip-sample distance. In addition, we analyzed the relation between the<br />
chemical short-range force and the conductance from the tunnelling to the contact<br />
regime.<br />
[1] S. Hembacher, F. J. Giessibl, J. Mannhart, and C. F. Quate, PNAS 100, 12539 (2003).<br />
[2] H. Holscher, W. Allers, U.D. Schwarz, A. Schwarz, and R. Wisendanger Phys. Rev. B 62, 6967 (2000)<br />
[3] S, Kawai and H. Kawakatsu, Phys. Rev. B 79, 115440 (2009).<br />
[4] G. Binning et al, Europhys. Lett. 1, 31 (1986).<br />
[5] P. Jelínek, M. Švec, P. Pou, R. Pérez and V. Cháb, Phys.Rev. Lett. 101 (2008).<br />
63
We-1200<br />
<strong>Atomic</strong>-Resolution Damping <strong>Force</strong> Spectroscopy on Nanotube Peapods<br />
with Different Tube Diameters<br />
M. Ashino 1 , R. Wiesendanger 1 , A. N. Khlobystov 2 , S. Berber 3,4 , and D. Tománek 4<br />
1 Inst. <strong>of</strong> Applied Physics & Microstructure Research Center, University <strong>of</strong> Hamburg, Hamburg, Germany<br />
2 <strong>School</strong> <strong>of</strong> Chemistry, University <strong>of</strong> Nottingham, Nottingham, UK<br />
3 Physics Department, Gebze Institute <strong>of</strong> Technology, Gebze, Turkey<br />
4 Physics and Astronomy Department, Michigan State University, East Lansing, USA.<br />
Damping <strong>of</strong> the oscillating cantilever in dynamic atomic force microscopy (AFM)<br />
includes valuable information about the local vibrational structure and elastic compliance<br />
<strong>of</strong> the samples. We present atomically-resolved maps <strong>of</strong> damping in nanotube peapods,<br />
showing their capability <strong>of</strong> identifying the presence and location <strong>of</strong> encapsulated Dy@C82<br />
metall<strong>of</strong>ullerenes as well as their packing structure in the different diameters <strong>of</strong> carbon<br />
nanotubes. In our study, the physical origin <strong>of</strong> damping is elucidated in a microscopic<br />
model, and its relationship to the outer tube diameter is quantitatively interpreted by<br />
calculating the vibrational spectrum and energy dissipation in peapods with different<br />
diameters using ab initio total energy and molecular dynamics calculations [1].<br />
In our experiment we probed sparsely deposited (Dy@C82)@SWNT peapods on insulating<br />
oxide layers <strong>of</strong> a Si substrate by dynamic AFM under constant oscillation amplitude conditions in<br />
ultrahigh vacuum (p≈10 -8 Pa) and at low temperature (T≈13 K). As seen in Fig. 1(a), the<br />
atomically site-specific damping signal is obviously detected over the peapod. Besides,<br />
Figure 1(b) shows that its maximum energy is closely related to the enclosing nanotube<br />
diameter d, determined on the basis <strong>of</strong> the simultaneously observed topographic images.<br />
(a) (b)<br />
Figure 1: (a) Simultaneously obtained dynamic AFM topography (left) and damping (right)<br />
images <strong>of</strong> an empty SWNT (1,3) and a (Dy@C82)@SWNT peapod (2,4) with the same outer<br />
tube diameter d≈1.62 nm. (b) Relationship between outer tube diameter d and the maximum<br />
damping energy ΔEmax.<br />
[1] M. Ashino, R. Wiesendanger, A. N. Khlobystov, S. Berber, and D. Tománek,<br />
submitted for publication.<br />
64
We-1220<br />
Theoretical study <strong>of</strong> the forces and atomic configurations <strong>of</strong> NC-AFM<br />
P. Pou 1 , and R. Perez 1<br />
experiments on low-dimension carbon materials.<br />
1 Dpto. de Física Teórica de la Materia Condensada, Universidad Autónoma de Madrid, Madrid, Spain<br />
During the last years we have been witnessing the rise <strong>of</strong> low-dimension carbon-based<br />
materials. Fullerenes, nanotubes and graphene are nowadays key materials nowadays key<br />
materials for nanotechnology applications due to their promising electronic and<br />
mechanical properties. The outstanding capabilities <strong>of</strong> NCAFM to image, manipulate and<br />
determine the tip-surface forces at the atomic scale make it the technique <strong>of</strong> choice for<br />
the study <strong>of</strong> the basic properties and for the development <strong>of</strong> these materials [1-5].<br />
In this work we present a DFT study <strong>of</strong> the interaction <strong>of</strong> a large set <strong>of</strong> AFM tips<br />
with different low-dimension carbon materials. We have considered several possible tip<br />
terminations: reactive clean Si tip apexes, non-reactive apexes, oxygen contaminated Si<br />
apexes and metallic tips. For each <strong>of</strong> these tips, we have characterized both the<br />
conservative and non-conservative part <strong>of</strong> the tip-sample interaction, determining the<br />
force versus distance curves during approach and retraction and calculating also the<br />
dissipated energy. Our results provide insight into the origin <strong>of</strong> the atomic contrast<br />
observed in recent experiments on both graphite and a SWNT [2-4]. Moreover, we have<br />
studied the atomic origin <strong>of</strong> the particular 3D <strong>Force</strong> mapping obtained in the experiments<br />
on peapods constituted by endo-fullerenes inserted in a SWNT [1] (see Fig. 1).<br />
a) b)<br />
Figure 1: (a) Ball-and-stick model <strong>of</strong> Si tip apex model over (Dy@C82)@SWNT. (b) Electronic<br />
charge density calculated with DFT in a plane parallel to the peapod over the top atoms <strong>of</strong> the<br />
SWNT. A slight modulation produced by the Dy@C82 is observed.<br />
[1] M. Ashino et al. Nature Nanotech. 3, 337 (2008).<br />
[2] B. J. Albers et al. Nature Nanotech. 4, 57 (2009).<br />
[3] S. Hembacher et al. PNAS. 100, 12539-12542 (2003); S. Hembacher et al. PRL 94, 056101 (2005).<br />
[4] M. Ashino et al. PRL 93, 136101 (2004); M. Ashino et al. Nanotechnology 16, S134-S137 (2005).<br />
[5] H. Hölscher et al. Phys. Rev. B 62, 6967-6970 (2000).<br />
65
Anchoring highly polar molecules onto an ionic crystal<br />
We-1430<br />
Jens Schütte 1 , Ralf Bechstein 1,2 , Michael, Rohlfing 1 , Michael Reichling 1 , and Angelika<br />
Kühnle 1<br />
1 Fachbereich Physik, Universität Osnabrück, Barbarastraße 7, 49076 Osnabrück, Germany<br />
2 present address: iNano, Aarhus University, DK-8000 Aarhus C, Denmark<br />
Precise control <strong>of</strong> molecular structure formation on surfaces is most important for<br />
creating functional molecular devices for future molecular (opto)electronics applications.<br />
So far, however, controlled structure formation on dielectric surfaces has <strong>of</strong>ten been<br />
hindered by weak molecule-substrate interactions, frequently leading to clustering at step<br />
edges [1]. Here, we explore the possibility <strong>of</strong> increasing the molecule-substrate<br />
interaction by deposition <strong>of</strong> a molecule having a high dipole moment, cytosine, onto the<br />
surface <strong>of</strong> an ionic crystal, CaF2(111). Our results reveal molecular trimer structures that<br />
are stable at room temperature. Density-functional theory calculations provide insights<br />
into molecular diffusivity and structure formation. Our findings indicate that employing<br />
well-adapted molecules with high dipole moment constitutes a promising strategy for<br />
controlling structure formation on insulating surfaces.<br />
Figure 1: (a) Overview image showing cytosine structures on CaF2(111) at room temperature.<br />
The most dominant structure is a trimer as marked by a box. (b) Zoom into the marked region <strong>of</strong><br />
(a), revealing a molecular structure that can be explained by three cytosine molecules forming a<br />
hydrogen-bonded ring. The model in the lower part illustrates a plausible adsorption position with<br />
respect to the underlying substrate.<br />
[1] T. Kunstmann et al., Phys. Rev. B 71, 121403 (2005); S. Maier et al., Small 4, 1115 (2008).<br />
66
Steering the formation <strong>of</strong> molecular nanowires and compact<br />
nanocrystallites on NaCl(001)<br />
We-1450<br />
Sweetlana Fremy 1 , Alexander Schwarz 1 , Knud Laemmle 1 , Roland Wiesendanger 1 , and<br />
Marc Prosenc 2<br />
1 Institute <strong>of</strong> Applied Physics, University <strong>of</strong> Hamburg, Jungiusstr. 11, 20355 Hamburg, Germany<br />
2 Institute <strong>of</strong> Anorganic and Applied Chemistry, University <strong>of</strong> Hamburg, Martin-Luther-King Platz 6, 20146<br />
Hamburg, Germany<br />
Recently, molecular-based magnetism raised a considerable interest in the scientific<br />
community. It is envisaged that the flexibility <strong>of</strong> organic synthesis might allow in the<br />
future to combine magnetism with other physical properties like transparency or optical<br />
switchability to create multifunctional devices. Investigations <strong>of</strong> such molecules using<br />
local probes have been mostly performed on metallic surfaces. However, due to strong<br />
hybridization the electronic state, and hence the magnetic properties as well, <strong>of</strong> adsorbed<br />
molecules is usually strongly modified.<br />
Fig. 1: (a) Co-Salen molecule. (b) Nanowire networks and compact nanocrystallites on NaCl(001).<br />
(c) Molecular resolution on a compact nanocrystallite reflecting the curved shape <strong>of</strong> Co-Salen.<br />
Therefore, we deposited Co-Salen (see Fig. 1a), a paramagnetic metal-organic Schiff-<br />
Base complex, on NaCl(001), a bulk insulator, by in-situ thermal evaporation. Since the<br />
molecular states are located in the band gap <strong>of</strong> this insulating substrate, hybridization<br />
effects are absent. Co-Salen on NaCl(001) forms either compact nanocrystallites or<br />
networks <strong>of</strong> nanowires or a mixture <strong>of</strong> both (see Fig. 1b). We found that the assembly <strong>of</strong><br />
these different molecular nanostructures can be controlled by adjusting appropriate<br />
growth parameters. Moreover, the arrangement <strong>of</strong> the molecules in both morphologies<br />
could be resolved by performing molecular resolution imaging (see Fig. 1c). It turned out<br />
that the adsorption geometry at step edges, where nucleation takes place, is crucial to<br />
understand initial formation and growth <strong>of</strong> the two different morphologies.<br />
67
2-Dimensional growth <strong>of</strong> phenylenediboronic acid assisted by<br />
H-bonding<br />
We-1510<br />
R. Pawlak, L. Nony, F. Bocquet, M. Sassi, V. Oison, J.-M. Debierre, Ch. Loppacher,<br />
and L. Porte<br />
IM2NP, Aix-Marseille Université, Avenue Escadrille Normandie-Niemen, F-13397 Marseille Cedex 20,<br />
and CNRS, IM2NP (UMR 6242), F-13397 Marseille-Toulon, France<br />
Christian.Loppacher@im2np.fr<br />
Organic molecules are <strong>of</strong>ten synthesized in order to support the formation <strong>of</strong> selfassembled<br />
nanostructures. In such a way, directed non-covalent [1] as well as covalent<br />
interactions [2] have already been used to tune the size as well as the shape <strong>of</strong> molecular<br />
assemblies. 1,4 Phenylenediboronic acids (C6H8B2O4, BDBA) are molecules which are<br />
designed to engage in multiple interactions with neighbors via their –B(OH)2 groups,<br />
either by hydrogen bonding or by covalent bonding (obtained by molecular dehydration).<br />
In our work, we investigate the molecular growth <strong>of</strong> BDBA on the surface <strong>of</strong> singlecrystal<br />
potassium chloride (KCl) as well as on highly oriented pyrolytic graphite (HOPG)<br />
by means <strong>of</strong> noncontact atomic force microscopy (ncAFM). Other than on the surface <strong>of</strong><br />
Ag(111) BDBA does not form the honey-comb like covalent network [3], but rather<br />
forms chains <strong>of</strong> hydrogen-bonded dimers, and the chains then associate by lateral<br />
hydrogen bonding to create sheets [4]. The ncAFM results displayed in the figure below<br />
show that extended and well organized monolayers <strong>of</strong> BDBA are formed on KCl. The<br />
observed structure fits very well to the one observed in crystals where the benzene ring is<br />
tilted by ~ 40° with respect to the mean plane <strong>of</strong> the sheet [4]. Interestingly, this structure<br />
seems to be very stable since it is also observed on the surface <strong>of</strong> HOPG. Experimental<br />
results are discussed in respect with structural models as well as calculations <strong>of</strong> the<br />
reaction path for the formation <strong>of</strong> covalent networks.<br />
Figure 1: 0.5 ML <strong>of</strong> BDBA adsorbed on KCl imaged by ncAFM. Large monolayer islands are<br />
formed which show the formation <strong>of</strong> sheets similar to the ones observed in single crystals.<br />
[1] T. Yokoyama et al., Nature 413, 619 (2001).<br />
[2] L. Grill et al., Nature Nanotechnology 2, 687 (2007)<br />
[3] N. Zwaneveld et al., JACS 190, 6678 (2008)<br />
[4] P. Rodriguez-Cuematzi et al., Acta Cryst. E60, o1315 (2004)<br />
68
Molecular scale dissipation in oligothiophene monolayers<br />
measured by dynamic force microscopy<br />
We-1530<br />
Carlos J. Gómez 1 , Nicolas F. Martínez 1 , Wojciech Kamiński 2,4 , Cristiano Albonetti 3 ,<br />
Fabio Biscarini 3 , Ruben Perez 4 and Ricardo Garcia 1<br />
1 Instituto de Microelectronica de Madrid, CSIC, Isaac Newton 8 28760 Tres Cantos, Madrid, Spain<br />
2 Institute <strong>of</strong> Experimental Physics, University <strong>of</strong> Wrocław, p. Maksa Borna 9, 50-204 Wrocław, Poland<br />
3 CNR- (ISMN) Via P. Gobetti 101, I-40129 Bologna, Italy<br />
4 Dep. de Física Teórica de la Materia Condensada,Universidad Autónoma 28049 Madrid, Spain<br />
Amplitude modulation atomic force microscopy has enabled high resolution imaging <strong>of</strong><br />
s<strong>of</strong>t materials 1 and Phase-imaging has been applied to identify nanoscale dissipation<br />
processes 2 . We perform a combined experimental and theoretical approach to establish<br />
the atomistic origin <strong>of</strong> dissipation occurring while imaging a molecular surface with an<br />
amplitude modulation force microscope 3 . The configuration space sampled by the tip<br />
depends on whether it approaches or withdraws from the surface. The asymmetry arises<br />
because <strong>of</strong> the presence <strong>of</strong> energy barriers among different deformations <strong>of</strong> the molecular<br />
geometry. This is the source <strong>of</strong> the material contrast provided by the images.<br />
[1] R. Garcia, R. Magerle, R. Perez, Nat. Mater. 7, 405 (2007).<br />
[2] R. Garcia, C. J. Gomez, N. F. Martinez, S. Patil, C. Dietz, R. Magerle, Phy. Rev. Lett. 97, 016103<br />
(2006).<br />
[3] Phy. Rev. Lett. (2009) Accepted.<br />
69
Oral<br />
Presentations<br />
Thursday, 13 August<br />
70
Dependence <strong>of</strong> the atomic scale image <strong>of</strong> a Si adatom on the tip apex<br />
termination: a DFT study<br />
Anna Campbellova 1 , Pablo Pou 2 , Ruben Pérez 2 , Petr Klapetek 1 and Pavel Jelínek 3<br />
1 Czech Metrology Institute, Brno, Czech Republic<br />
2 Department <strong>of</strong> Physics, <strong>Yale</strong> University, New Haven, Spain.<br />
3 Department <strong>of</strong> Thin Films, Institute <strong>of</strong> Physics <strong>of</strong> the ASCR, Prague, Czech Republic<br />
Th-0900<br />
High-resolution measurements <strong>of</strong> tip-sample forces became possible with dynamic force<br />
spectroscopy (DFS) [1]. Furthermore this technique was adopted to measure threedimensional<br />
force ?elds with atomic resolution [2,3]. In principle, these measurements<br />
can provide, by separating the short-range contribution from the total tip-sample<br />
interaction, detailed information about e.g. the surface energy landscape, adhesion forces<br />
and inter-atomic forces. Sub-atomic resolution <strong>of</strong> Si adatoms on Si(111)-(7x7) has also<br />
been reported and its interpretation is still source <strong>of</strong> debate.<br />
Here we have performed DFT simulations <strong>of</strong> a 3D scan over a silicon cluster –that<br />
reproduces the local coordination <strong>of</strong> a surface adatom--, using different Sibased tips [5].<br />
Our aim is to reveal the effect <strong>of</strong> apex atomic termination on the resulting atomic scale<br />
imaging <strong>of</strong> individual Si adatom. We have found a strong variation <strong>of</strong> the internal atomic<br />
contrast with the symmetry and chemical composition <strong>of</strong> the tip apex. In particular, the<br />
theoretical atomic image provided by a dimer-like Si tip with an oxygen atom positioned<br />
on apex mimics very well the characteristic subatomic features observed experimentally<br />
[4].<br />
Figure 1: Theoretical DFT images <strong>of</strong> Si adatom provided by three different apex tip structures.<br />
[1] M. A. Lantz et al, Science 291, 2580 (2001).<br />
[2] H. Hölscher, S. M. Langkat, A. Schwarz, and R. Wiesendanger, Appl. Phys. Lett. 81, 4428 (2002).<br />
[3] Y. Sugimoto, T. Namikawa, K. Miki, M. Abe, and S. Morita Phys. Rev. B 77, 195424 (2008).<br />
[4] F. J. Giessibl, S. Hembacher, H. Bielefeldt, and J. Mannhart, Science 289, 422 (2000)<br />
[5] P.Pou et al Nanotechnology accepted (2009)<br />
71
AFM probe tips with a small front atom<br />
Th-0920<br />
T. H<strong>of</strong>mann, 1 J. Welker, 1 M. Ternes, 2 C. P. Lutz, 2 A. J. Heinrich, 2 Franz J. Giessibl 1<br />
1 University <strong>of</strong> Regensburg, Institute <strong>of</strong> Experimental and Applied Physics, D-93040 Regensburg, Germany<br />
2 IBM Research Division, Almaden Research Center, 650 Harry Rd, San Jose, CA 95120, USA<br />
A direct comparison <strong>of</strong> scanning tunneling microscopy and AFM data showed that when<br />
probing a tungsten tip with a graphite surface (a “light-atom probe”), subatomic orbital<br />
structures with a spatial resolution <strong>of</strong> less than one Angstrom can be obtained in the force<br />
map, while a map <strong>of</strong> the tunneling current only shows the known atomic resolution. 1<br />
Optimized subatomic contrast is obtained when recording the higher harmonics <strong>of</strong> the<br />
cantilever motion. 1 The idea <strong>of</strong> the light atom probe was carried further by using an adsorbed<br />
CO molecule to probe the tip atom. It requires quite a large force to move a CO molecule<br />
laterally 2 and this molecule is an excellent probe for the orbital structure <strong>of</strong> the front atom <strong>of</strong><br />
the metal tip. In contrast to previous examples <strong>of</strong> “subatomic” resolution, where a flat sample<br />
with a periodic array <strong>of</strong> sample atoms created multiple tip images, using a single adsorbed CO<br />
molecule as a “tip” allows to isolate the force contribution <strong>of</strong> a single atom-pair contact.<br />
Ideally, one wishes to create a probe with a perfectly perpendicularly oriented CO molecule at<br />
the very end <strong>of</strong> the tip. First results will be discussed where a CO molecule has been picked<br />
up by a metal tip and used to image adsorbed atoms.<br />
In order to allow simultaneous STM and AFM, high electrical conductivity is another<br />
desirable property <strong>of</strong> a light atom probe. Because <strong>of</strong> its small atomic radius, high mechanical<br />
strength and fair electric conductivity Beryllium is a promising choice as a probe material.<br />
However, due to its high reactivity, preparation is a challenge. Results using Be tips prepared<br />
by high-voltage field emission for atomic imaging <strong>of</strong> Si(111)-(7×7) will be presented.<br />
1. S. Hembacher, F. J. Giessibl, J. Mannhart, Science 305, 380 (2004).<br />
2. M. Ternes, C. P. Lutz, C.F. Hirjibehedin, F. J. Giessibl, A. J. Heinrich, Science 319, 1066<br />
(2008).<br />
72
Th-0940<br />
Intramolecular features <strong>of</strong> organic molecules characterized by force<br />
field spectroscopy: The case <strong>of</strong> PTCDA on Cu and Ag<br />
Gernot Langewisch 1 , Daniel-Alexander Braun 1 , Domenique Weiner 2 ,<br />
Bartosz Such 3 , Harald Fuchs 1 , and Andre Schirmeisen 1<br />
1CeNTech (Center for Nanotechnology) and Institute <strong>of</strong> Physics, University <strong>of</strong> Muenster, Germany<br />
2 SPECS Zurich GmbH, Switzerland<br />
3 Marian Smoluchowski Institute <strong>of</strong> Physics, Jagiellonian University Krakow, Poland<br />
Thin films <strong>of</strong> π-conjugated organic molecules, like the organic semiconductor PTCDA,<br />
are <strong>of</strong> high relevance for nanoelectronic applications. We use non-contact atomic force<br />
microscopy in ultrahigh vacuum at room temperature to investigate the forces between<br />
the tip and PTCDA molecules deposited on Cu(111) and Ag(111) surfaces by molecular<br />
beam epitaxy.<br />
Submolecular features <strong>of</strong> the PTCDA layers on both substrates are resolved in the<br />
topography scans. In particular we find that the second layer molecules show an<br />
intramolecular structure with a height corrugation <strong>of</strong> up to 40pm, while molecules in the<br />
first layer above the substrate are depicted as featureless ovals [1]. To study this effect in<br />
detail, 2-dimensional cuts <strong>of</strong> the spatial tip-sample force landscape above individual<br />
molecules were obtained by force field spectroscopy. In the double layer these cuts, each<br />
consisting <strong>of</strong> 40 force spectroscopy curves, reveal an enhanced tip-sample force<br />
interaction at the molecular end groups compared to the centre <strong>of</strong> the molecule [2].<br />
However, for the monolayer molecules this effect is not present. This is interpreted with<br />
respect to different mechanical relaxation processes <strong>of</strong> the molecular functional end<br />
groups as well as variations <strong>of</strong> the internal electron density distributions <strong>of</strong> the molecules.<br />
Figure 1: Left: Topography scans <strong>of</strong> a double layer <strong>of</strong> PTCDA molecules on Cu(111) deposited<br />
by molecular beam epitaxy, showing intramolecular contrast. Right: <strong>Force</strong> field spectroscopy<br />
image along line in left image, visualizing the intramolecular variations <strong>of</strong> the tip-sample force.<br />
[1] B. Such, A. Schirmeisen, D. Weiner, and H. Fuchs, Appl. Phys. Lett. 98, 093104 (2006).<br />
[2] D.-A. Braun, D. Weiner, B. Such, H. Fuchs and A. Schirmeisen, Nanotechnology (2009) submitted.<br />
73
Th-1000<br />
Analysis <strong>of</strong> bimodal and higher mode small-amplitude near-contact<br />
AFM and energy dissipation<br />
S. Kawai, A. Barat<strong>of</strong>f, Th. Glatzel, S. Koch, B. Such, and E. Meyer<br />
Department <strong>of</strong> Physics, University <strong>of</strong> Basel, Klingelbergstr. 82, 4056 Basel Switzerland<br />
Recently enhanced atomic-scale contrast was achieved on KBr(001) in UHV using<br />
resonant self-excitation <strong>of</strong> the lowest two cantilever flexural modes with constant tip<br />
oscillation amplitudes A1 >> A2 by monitoring the interaction induced frequency shift Δf2<br />
while controlling the closest approach distance z via Δf1 [1]. Optimum sensitivity and<br />
contrast in non-contact AFM using the 2 nd mode alone can in principle be achieved for z<br />
below the interatomic separation and A2 close to the range <strong>of</strong> the tip-sample interaction [2<br />
3]. Stable operation under such conditions can, however, be jeopardized by atomic jumps<br />
even if macroscopic jump-to-contact is prevented by using a sufficiently stiff deflection<br />
sensor. Simultaneous excitation <strong>of</strong> the fundamental mode with a large A1 alleviates this<br />
problem for reasons to be discussed.<br />
Under the stated conditions, Δf2 is to a good approximation proportional to the time<br />
average <strong>of</strong> the interaction force gradient over one cycle <strong>of</strong> the fundamental oscillation, as<br />
demonstrated and verified by simulations and measurements [1]. An application <strong>of</strong> the<br />
same argument to atomic-scale Kelvin <strong>Force</strong> <strong>Microscopy</strong> using voltage modulation at f2<br />
shows that the resulting deflection signal at f2 is proportional to the time average <strong>of</strong> the<br />
electrostatic force [4].<br />
Measurements to be reported separately using the 2 nd mode alone with amplitudes as<br />
small as 0.5 nm show smooth force vs. distance curves extracted from Δf2, as well as a<br />
small time-averaged deflection proportional to the time-average <strong>of</strong> the force.<br />
In all three cases, the site-dependent distance dependence <strong>of</strong> the time-averaged force<br />
gradient, electrostatic or total force can be extracted from the measured frequency shift,<br />
deflection signal at f = f2 or f = 0 using slightly modified versions <strong>of</strong> inversion algorithms<br />
proposed for single-mode non-contact AFM [5, 6]<br />
The magnitude, distance and amplitude dependences <strong>of</strong> the interaction-induced energy<br />
dissipation per oscillation cycle simultaneously measured using the 2 nd mode suggest that<br />
the dominant cause <strong>of</strong> dissipation is a force hysteresis loop narrower than twice A, but<br />
significantly smeared by thermal activation. However, some velocity-dependent<br />
damping with a coefficient decaying with increasing distance must also be present.<br />
Possible mechanisms and a hitherto ignored difficulty in extracting meaningful<br />
"dissipative forces" in the presence <strong>of</strong> both mechanisms will be discussed.<br />
[1] S. Kawai et al., submitted.<br />
[2] F. J. Giessibl et al., Appl. Surf. Sci.140, 352 (1999).<br />
[3] S. Kawai et al., Appl. Phys. Lett. 89, 023113 (2006).<br />
[4] S. Kawai et al., unpublished<br />
[5] O. Pfeiffer et al., Phys. Rev. B 65, 161403R (2002)<br />
[6].J. E. Sader and S. P. Jarvis, Appl. Phys. Lett. 84, 1801 (2004)<br />
74
Th-1020<br />
Adhesion-induced energy dissipation and atom-tracked tip changes<br />
S. Kawai, Th. Glatzel, S. Koch, B. Such, A. Barat<strong>of</strong>f, and E. Meyer<br />
Department <strong>of</strong> Physics, University <strong>of</strong> Basel, Klingelbergstr. 82, 4056 Basel Switzerland<br />
We have simultaneously measured the frequency shift Δf and the interaction-induced<br />
dissipated energy per cycle Ets above a maximum in a topographic image <strong>of</strong> KBr(001).<br />
The measurements were performed at room temperature in UHV using the 2nd flexural<br />
mode <strong>of</strong> a silicon cantilever (1039369 Hz) at 11 constant amplitudes A between 12.8 and<br />
0.51 nm. As shown in fig. 1, Ets rises smoothly above the noise level, then almost<br />
saturates as the closest approach distance extends below the attractive force minimum.<br />
Whereas the conservative force vs. distance curves extracted from Δf were smooth and<br />
coincided apart from noise, Ets decreased smoothly by only a factor <strong>of</strong> 2 and became less<br />
noisy as A was reduced from 12.8 to 0.51 nm. This behavior, and the magnitude <strong>of</strong> Ets<br />
suggest that the dominant cause <strong>of</strong> dissipation is a force hysteresis loop narrower than<br />
twice A, but significantly smeared by thermal activation. However, some velocitydependent<br />
damping with a coefficient decaying with increasing distance is also present.<br />
Using A = 0.285 nm, one thousand approach-retraction curves were recorded, separated<br />
by intervals for atom-tracking (Nanonis AT4). In most cases one <strong>of</strong> three distinct Ets vs.<br />
distance curves are obtained, whereas the conservative force curves are almost the same,<br />
as shown in fig. 1 (a-c). This is consistent with the higher sensitivity <strong>of</strong> Ets to the tip apex<br />
configuration. In a few cases we observed jumps between curves corresponding to two <strong>of</strong><br />
those long-lived configurations, accompanied by significant deviations between approach<br />
and retraction. As shown in fig. 2, the tracked 3D motion <strong>of</strong> the sample relative to the tip<br />
at Δf = -150 Hz exhibits strong correlations between more frequent jumps (strongly<br />
reduced by averaging over each tracking interval). This suggests that tip changes occur<br />
over a range <strong>of</strong> time scales. Further implications <strong>of</strong> those results will be discussed.<br />
Figure 1 Figure 2<br />
75
Th-1120<br />
Combined Qplus-AFM and STM imaging <strong>of</strong> the Si(100) surface:<br />
Activating the c(4x2) to p(2x1) transition with subnanometre oscillation<br />
amplitudes<br />
A. Sweetman, S. Gangopadhyay, R. Danza, and P. Moriarty<br />
<strong>School</strong> <strong>of</strong> Physics and Astronomy, University <strong>of</strong> Nottingham,<br />
Nottingham NG7 2RD, UK<br />
We report the first combined Qplus AFM and STM images <strong>of</strong> the Si(100) surface. The<br />
study <strong>of</strong> the Si(100)-(2x1) and c(4x2) reconstructions using scanning probe methods<br />
(both STM and NC-AFM) has led to a variety <strong>of</strong> intriguing and controversial issues<br />
associated with identifying the ground state <strong>of</strong> the system [1]. Foremost among these<br />
have been the determination <strong>of</strong> whether the silicon dimers, which give rise to the (2x)<br />
periodicity at the Si(100) surface, are asymmetric or symmetric, and the extent to which<br />
the measurement technique might influence the energy balance. Previous experimental<br />
NC-AFM measurements (with ~ 10 nm amplitude) combined with theoretical<br />
calculations [2] showed that the AFM probe could strongly influence the Si(100) surface,<br />
stabilising a p(2x1) phase at low temperatures. Our Qplus measurements, taken with<br />
probe oscillation amplitudes ranging from 250 pm to 10 nm, not only confirm that the<br />
strong influence <strong>of</strong> the tip is retained at subnanometre oscillation amplitudes, but, as<br />
shown in Fig. 1, suggest that tip symmetry plays a central role in stabilisation <strong>of</strong> a<br />
particular surface phase. In addition, there are clear and striking differences between<br />
STM and Qplus AFM images <strong>of</strong> the Si(100)-(2x1) phase arising from the residual dimer<br />
buckling associated with probe-induced stabilisation <strong>of</strong> the p(2x1) structure.<br />
[1] Lev Kantorovich and Chris Hobbs, Phys. Rev. B 73 245420 (2006) and references therein<br />
[2] Yan Jun Li et al., Phys. Rev. Lett. 96 106104 (2006)<br />
Fig. 1 Qplus AFM images <strong>of</strong> the Si(100) surface. (a) Regions <strong>of</strong> both (2x1) and c(4x2)<br />
symmetry are visible. (df=-10.9 Hz, A vib=350 pm (700 pm pk-pk), V gap=+0.3V). (b) and (c)<br />
Images <strong>of</strong> the same surface region taken in parallel with identical scan parameters showing the<br />
influence <strong>of</strong> the scan direction on the surface phase. Image (b) was taken while the tip was<br />
moving from left to right. For Image (c) the tip was moving from right to left.<br />
76
Measuring <strong>Atomic</strong> Charge States by nc-AFM<br />
Th-1140<br />
Leo Gross 1 , Fabian Mohn 1 , Peter Liljeroth 1,2 , Jascha Repp 1,3 , Franz J. Giessibl 3 , and<br />
Gerhard Meyer 1<br />
1<br />
IBM Research, Zurich Research Laboratory, 8803 Rüschlikon, Switzerland<br />
2<br />
Debye Institute for Nanomaterials Science, Utrecht University, 3508 TA Utrecht, The Netherlands<br />
3<br />
Institute <strong>of</strong> Experimental and Applied Physics, University <strong>of</strong> Regensburg,<br />
93040 Regensburg, Germany<br />
We investigated the charge state switching <strong>of</strong> individual gold and silver adatoms on<br />
ultrathin NaCl films on Cu(111) using a qPlus tuning fork AFM operated at 5 Kelvin<br />
with oscillation amplitudes in the sub-Ångstrom regime. Charging <strong>of</strong> a gold adatom by<br />
one electron charge increases the force on the AFM tip by a few piconewtons. Moreover,<br />
the local contact potential difference is shifted depending on the sign <strong>of</strong> the charge and<br />
allows the discrimination <strong>of</strong> positively charged, neutral, and negatively charged atoms.<br />
Furthermore, we modified AFM tips by means <strong>of</strong> vertical manipulation techniques, i.e.<br />
deliberately picking up known adsorbates, to study the effect <strong>of</strong> the atomic tip<br />
termination on AFM contrast and sensitivity.<br />
77<br />
Figure 1: (a) Constant-current STM<br />
measurement (V = –50mV, I = 2pA) <strong>of</strong> a<br />
neutral (Au 0 , left) and a negatively charged<br />
gold adatom (Au − , right) adsorbed on<br />
NaCl(2ML)/Cu(111). The line scan is<br />
through the center <strong>of</strong> both adatoms shown<br />
in the inset (image size <strong>of</strong> insets:<br />
55Å × 17Å). (b) Current and (c) frequency<br />
shift recorded simultaneously in a constantheight<br />
measurement <strong>of</strong> the same area<br />
(Δz = 5.0Å, V = –5mV, A = 0.3Å).
Th-1200<br />
Mechanism <strong>of</strong> Dissipative Interaction by Tunneling Single-Electrons<br />
Yoichi Miyahara 1 , L. Cockins 1 , S. D. Bennett 1 , A. A. Clerk 1 , S. A. Studenikin 2 ,<br />
P. Poole 2 , A. Sachrajda 2 and P. Grutter 1<br />
1 Department <strong>of</strong> Physics, McGill University, Montreal, Canada<br />
2 Institute for Microstructural Science, National Research Council <strong>of</strong> Canada, Ottawa, Canada<br />
The frequency modulation mode atomic force microscopy (FM-AFM) can be used as a<br />
sensitive electrometer which can detect the motion <strong>of</strong> a single electron. An oscillating<br />
AFM tip with an applied dc-bias voltage (Vbias) can allow a single electron to tunnel back<br />
and forth between a quantum dot (QD) and a back-electrode by oscillating the chemical<br />
potential <strong>of</strong> the QD around that <strong>of</strong> the back-electrode, owing to Coulomb blockade effect.<br />
The resulting electron motion in turn modulates the electrostatic force acting on the tip<br />
and causes the dissipation as well as the resonance frequency shift (Δf) <strong>of</strong> the cantilever.<br />
Both dissipation and Δf images taken in constant-height mode show characteristic<br />
concentric rings around the QD, each <strong>of</strong> which reflects the above-mentioned single-<br />
electron tunneling. The corresponding features also appear as peaks (dips) in the<br />
dissipation (Δf) versus Vbias spectra taken above the QD. These spectra can be interepreted<br />
as addition energy spectra which enable us to investigate the electronic structure <strong>of</strong> a<br />
single QD.<br />
In this contribution, we present the mechanism <strong>of</strong> the dissipative electrostatic<br />
interaction due to the tunneling single-electrons in detail. In essence, this dissipative<br />
interaction arises from the delayed response <strong>of</strong> a single tunneling electron to the<br />
oscillating chemical potential induced by the oscillating tip. The delay is due to the finite<br />
tunneling rate which is determined by the tunnel barrier.<br />
We developed a theoretical model for this dissipation process and obtained a very<br />
good agreement between the theoretical dissipation versus Vbias curve and the<br />
experimental one (Fig. 1). We also discuss the effect <strong>of</strong> the tip oscillation amplitude and<br />
temperature and the relation between Δf and dissipation signal.<br />
78<br />
Figure 1: Theoretical (solid) and<br />
experimental (dashed) dissipation versus<br />
bias voltage curves. (T = 30 K, A=0.5 nm,<br />
Tip-QD distance = 15 nm)
Th-1220<br />
Controlling electron transfer processes on insulating surfaces with the<br />
NC-AFM<br />
Thomas Trevethan 1,2 and Alexander Shluger 2<br />
1 Department <strong>of</strong> Physics and Astronomy, University College London, London, UK<br />
2 WPI Advanced Institute for Materials Research, Tohoku University, Sendai, Japan.<br />
We present theoretical modeling that predicts how a single electron transfer process can<br />
be induced between two defects on an insulating surface using the non-contact <strong>Atomic</strong><br />
<strong>Force</strong> Microscope. On an insulating substrate one can realize the possibility <strong>of</strong> using the<br />
localized perturbation produced by an AFM tip to modify electronic structure locally on<br />
the surface, which could result in the control <strong>of</strong> electronic processes and transitions. The<br />
field produced by the tip at close approach may modify both the relative energies <strong>of</strong><br />
distinct electronic states as well as the potential energy barrier separating them.<br />
A model but realistic system is employed which consists <strong>of</strong> a neutral oxygen vacancy and<br />
a noble metal (Pt or Pd) adatom on the MgO (001) surface. We show that the ionization<br />
potential <strong>of</strong> the vacancy and the electron affinity <strong>of</strong> the metal adatom can be significantly<br />
modified by the electric field produced by an ionic tip apex at close approach to the<br />
surface. The relative energies <strong>of</strong> the two states are also a function <strong>of</strong> the separation <strong>of</strong> the<br />
two defects. Therefore the transfer <strong>of</strong> an electron from the vacancy to the metal adatom<br />
can be induced either by the field effect <strong>of</strong> the tip or by manipulating the position <strong>of</strong> the<br />
metal adatom on the surface. We also show how the transition <strong>of</strong> an electron can be<br />
observed in the change <strong>of</strong> image contrast. The realization <strong>of</strong> these procedures<br />
experimentally would mean that a single electron transfer process could be directly<br />
observed and controlled, and would herald a new regime <strong>of</strong> control on the atomic scale.<br />
Figure 1: (a) Schematic <strong>of</strong> the system, showing an Mg terminated MgO tip directly above a<br />
metal adatom on the surface, adjacent to an oxygen vacancy. (b) Illustration <strong>of</strong> adiabatic total<br />
energy curves for the two states at two defect separations (A > B), where Q is a structural degree<br />
<strong>of</strong> freedom. (c) Illustration <strong>of</strong> potential energy wells for the two states, depicting how barrier<br />
width increases at larger separation.<br />
79
Th-1240<br />
NC-AFM imaging with atomic resolution in a temperature range<br />
Andreas Bettac and Albrecht Feltz<br />
between 5 K and 1083 K<br />
Omicron NanoTechnology GmbH, Taunusstein, Germany<br />
We present the latest results <strong>of</strong> atomically resolved NC-AFM (QPlus) measurements on a<br />
Si(111) 7x7 surface at high sample temperatures. Starting at room temperature, the<br />
temperature was increased stepwise to 1083 K by direct current heating. Even at these<br />
high temperatures it is possible to achieve atomic resolution <strong>of</strong> the 7x7 reconstruction in<br />
NC-AFM mode (Fig 1a) .<br />
Since the phase transition between the 1x1 and the 7x7 reconstruction starts to occur at<br />
this temperatures, we focused our experiments on the observation <strong>of</strong> the phase transition.<br />
In NC-AFM and dynamic STM mode we observed fluctuating formations <strong>of</strong> step edges<br />
and kinks. Typically, these kinks have a width <strong>of</strong> half a unit cell - most likely due to<br />
breaking the dimer bonds. Both effects are indicators for the phase transition. At the same<br />
high temperature and without changing the sensor we were able to image this<br />
characteristic step movement in STM mode with atomic resolution <strong>of</strong> the 7x7<br />
reconstruction. The size <strong>of</strong> the 1x1 areas at the lower side <strong>of</strong> a step edge permanently<br />
changes - affecting the 7x7 area.<br />
With the developed instrument we could resolve the rest atoms <strong>of</strong> the Si(111) 7x7<br />
reconstruction at a sample temperature <strong>of</strong> 50 K and observed a different brightness for the<br />
rest atoms <strong>of</strong> the faulted and unfaulted half (Fig. 1b).<br />
Furthermore, atomic resolution in NC-AFM mode on metallic Au(111) and Ag(111)<br />
surfaces at 5 K will be presented [1].<br />
a) b) c)<br />
T= 1053 K<br />
T= 50 K T= 5 K<br />
Figure 1: NC-AFM results: a) atomically resolved<br />
Si(111) 7x7 at a sample temperature<br />
<strong>of</strong> 1053 K; b) Si(111) 7x7 at 50K, the atomically resolved image <strong>of</strong> the Si(111) 7x7<br />
surface clearly shows the restatoms and their different brightness for the faulted and<br />
unfaulted half; and c) atomically resolved Au(111) surface at 5K.<br />
[1]<br />
A. Bettac, J. Koeble, K. Winkler, B. Uder, M. Maier, and A. Feltz, Nanotechnology 20, 264009 (2009).<br />
80
Oral<br />
Presentations<br />
Friday, 14 August<br />
81
Th-1240 Fr-0900<br />
<strong>Atomic</strong> scale elasticity mapping <strong>of</strong> Ge(001) surface by multifrequency<br />
FM-AFM<br />
Yoshitaka Naitoh, Zongmin Ma, Yanjun Li, Masami Kageshima and Yasuhiro Sugawara<br />
Department <strong>of</strong> Applied Physics, Osaka University, Suita 565-0871, JAPAN<br />
Surface elasticity is quite important to study atomic scale properties <strong>of</strong> the surface<br />
such as bounding strength <strong>of</strong> surface atoms and surface phonons. The conventional FM-<br />
AFM provides topographic information <strong>of</strong> various surfaces at atomic scale. However, it is<br />
hardly accessible to the elasticity and the adhesion on surfaces. In this study, we propose<br />
a new technique, multifrequency FM-AFM, on Ge(001) surface using a commercial<br />
cantilever in order to investigate the surface elasticity at atomic scale with the<br />
topographic image.<br />
The cantilever <strong>of</strong> the multifrequency FM-AFM was simultaneously excited at the<br />
by two sets <strong>of</strong> automatic gain<br />
1st and the 2nd flexural resonant frequencies (f1st, f2nd)<br />
controller and phase locked loop electronics. Their oscillating amplitudes are set constant<br />
at A1st, A2nd. The cantilever oscillating signal, detected by an optical interferometer<br />
system, is divided into the 1st and the 2nd components through band pass filters. The<br />
surface topography is obtained from feedback signal maintaining the frequency shift <strong>of</strong><br />
the 1st component (Δf1st) constant. From the theoretical consideration, we found that the<br />
surface elasticity is obtained as a mapping <strong>of</strong> the frequency shift <strong>of</strong> the 2nd component<br />
(Δf2nd).<br />
The cleaned Ge(001) surface showing buckled dimer structure was adopted as a<br />
sample with the elastic distribution at atomic scale. Figures 1(a) and (b) show the<br />
simultaneously obtained topography and the Δf2nd mapping <strong>of</strong> the surface. The dimer<br />
structure <strong>of</strong> the surface was clearly resolved in both images. We found Δf2nd <strong>of</strong> the fig.<br />
1(b) was high at the dimer atom position in comparison with the topography. This result<br />
suggests multifrequency FM-AFM is a nicer tool for exploring the surface elasticity at<br />
atomic scale.<br />
Figure 1: (a) Topographic image <strong>of</strong> Ge(001) surface with Δf1st=-70Hz, f1st=160kHz and<br />
A1st=4nm. Scan area is 7x7 nm 2 . (b) Simultaneously obtained Δf2nd mapping <strong>of</strong> the surface area<br />
with Δf2nd=-21Hz, f2nd=1.0MHz and A2nd=0.3nm.<br />
82
Small amplitude atomic resolution NC-AFM imaging and force<br />
spectroscopy experiments using a stiff piezoelectric force sensor<br />
Stefan Torbrügge 1 , Jörg Rychen 2 , Oliver Schaff 1<br />
1 SPECS GmbH, Voltastrasse 5, 13355 Berlin, Germany<br />
2 SPECS Zurich GmbH, Technoparkstrasse 1, 8005 Zurich, Switzerland<br />
Fr-0920<br />
We present the design <strong>of</strong> the recently introduced KolibriSensor TM and its application to<br />
frequency modulation atomic force microscopy. The KolibriSensor TM , schematically<br />
shown in Fig. 1(a), is a new type <strong>of</strong> piezoelectric force sensor based on a quartz length<br />
extension resonator (LER) [1]. Key features <strong>of</strong> the KolibriSensor TM are a high spring<br />
constant (k~540,000 N/m), avoiding snap into contact when operated at small amplitudes,<br />
and a large Q-factor exceeding 10,000 at room temperature. Its high resonance frequency<br />
(fres~1 MHz) enables fast scanning and an excellent signal-to-noise ratio necessary for<br />
stable operation at sub-nanometer oscillation amplitudes. In-situ sputtering enables<br />
repeated sharpening <strong>of</strong> the separately contacted tungsten tip. Switching between AFM,<br />
STM, or combined feedback modes is possible on the fly during measurement.<br />
We demonstrate atomic resolution measurements on Si(111)-(7x7) and insulating<br />
KBr(001), see Fig. 1(b), with oscillation amplitudes down to 30 pm at room temperature<br />
and scanning speeds <strong>of</strong> several lines/s. Furthermore the performance <strong>of</strong> the sensor in<br />
force spectroscopy experiments is evaluated by acquisition <strong>of</strong> two-dimensional force<br />
maps measured on KBr(001) (see Fig. 1 (c)).<br />
Figure 1: (a) Schematic drawing <strong>of</strong> the KolibriSensor TM . (b) Topographic atomic resolution NC-<br />
AFM image <strong>of</strong> the KBr(001) surface recorded at room temperature. (c) Vertical tip-sample force<br />
map F(x,z) derived from 20 Δf(z) curves taken along the line in the insert image in (c).<br />
[1] T. An, et al. Appl. Phys. Lett., 88, 149903 (2006); T. An, et al., Rev. Sci. Instrum., 79, 033703 (2008)<br />
83
Fr-0940<br />
Determination <strong>of</strong> the Optimum Spring Constant and Oscillation<br />
Amplitude for <strong>Atomic</strong>/Molecular-Resolution FM-AFM<br />
Yoshihiro Hosokawa 1 , Kei Kobayashi 2 , Hir<strong>of</strong>umi Yamada 1 and Kazumi Matsushige 1<br />
1 Department <strong>of</strong> Electronic Science and <strong>Engineering</strong>, Kyoto University, Kyoto, Japan<br />
2 Innovative Collaboration Center, Kyoto University, Kyoto, Japan.<br />
Several studies have shown that the lateral resolution <strong>of</strong> FM-AFM on Si(111)-7x7 surface<br />
can be improved by oscillating a force sensor with a very high spring constant (> 1,000<br />
N/m) at a very small amplitude (< 1 nm) [1,2]. However, the resolution <strong>of</strong> FM-AFM on<br />
an organic thin film was not improved by the use <strong>of</strong> a cantilever with a spring constant <strong>of</strong><br />
about 700 N/m [3]. Here we propose a general procedure to determine the optimum<br />
imaging parameters (spring constant and oscillation amplitude) for obtaining atomic or<br />
molecular resolution by FM-AFM.<br />
We first determine the minimum distance between the tip and the sample, which is<br />
limited by the instability caused by jump-into-contact the sample or by the dissipative tipsample<br />
interaction forces. Then we defined effective signal intensity for atom/molecularresolution<br />
FM-AFM as the difference between the frequency shift on top <strong>of</strong> the<br />
atom/molecule and on the gap between the atoms/molecules at the minimum distance.<br />
Figure 1 shows a plot <strong>of</strong> the calculated signal-to-noise ratio on lead-phthalocyanine thin<br />
films on MoS2. The optimum spring constant and oscillation amplitude were 10 N/m and<br />
25 nm, respectively. Figure 2(a) is a preliminary experimental result using 7.4 N/m<br />
cantilever. Line pr<strong>of</strong>iles obtained from Fig. 2(a) (red, bold) and from the image (black,<br />
thin) using 40 N/m cantilever [3] are shown in Fig. 2(b). From Fig.2(b), the corrugation<br />
was larger and consequently signal-to-noise ratio was improved when we used a<br />
cantilever with a smaller spring constant and a larger oscillation amplitude.<br />
Figure 1: Signal-to-noise ratio for<br />
molecular-resolution FM-AFM on PbPc with<br />
various spring constant and oscillation<br />
amplitude. The optimum spring constant and<br />
oscillation amplitude is 10 N/m and 25 nm.<br />
[1] F. J. Giessibl et al., Appl. Surf. Sci., 140 (199) 352.<br />
[2] S. Kawai et al., Appl. Phys. Let., 86 (2005) 193107.<br />
[3] Y. Hosokawa et al., Jpn. J. Appl. Phys., 47(2008) 6125.<br />
84<br />
Figure 2: (a) Topographic<br />
image <strong>of</strong> PbPc<br />
obtained with using small spring constant<br />
cantilever (7.4 N/m) at large amplitude (15<br />
nm). (b) Line pr<strong>of</strong>iles obtained from (a)<br />
(red, bold) and from the image obtained<br />
using 40 N/m cantilever
Fr-1000<br />
Visualization <strong>of</strong> Anisotropic Conductance in Polydiacetylene Crystal<br />
by Two-probe FM-AFM/KFM<br />
Eika Tsunemi 1 , Kei Kobayashi 2 , Kazumi Matsushige 1 , and Hir<strong>of</strong>umi Yamada 1<br />
1 Department <strong>of</strong> Electronic Science & <strong>Engineering</strong>, Kyoto University, Katsura Nishikyo, Kyoto, Japan<br />
2 Innovative Collaboration Center, Kyoto University, Katsura Nishikyo, Kyoto, Japan<br />
<strong>Atomic</strong> force microscopy probe tips serve as a wide variety <strong>of</strong> roles such as<br />
nanometer-scale electrical probes or atom manipulation tools in addition to imaging tools.<br />
However, their simultaneous, multiple use is <strong>of</strong>ten limited because only a single probe is<br />
available in AFM. Implementation <strong>of</strong> two or more probe tips can tremendously expand<br />
the capability <strong>of</strong> AFM. We recently developed a high-resolution two-probe AFM system<br />
using the optical beam deflection method [1]. It allows us to make a multi-probe<br />
electrical measurement or to conduct stimulus-response experiments for various materials.<br />
In this presentation, anisotropic conduction in a polydiacetylene (PDA) single<br />
crystal was studied by the two-probe FM-AFM/KFM. A PDA single crystal shows an<br />
anisotropic conductance due to the quasi-one-dimentional electronic band structure along<br />
the diacetylene main chain. In this experiment, we used a poly-PTS (polydiacetylene<br />
para-toluene sulfonate) single crystal (inset <strong>of</strong> the right <strong>of</strong> Fig. 1). The left <strong>of</strong> Fig. 1<br />
shows an experimental setup. While a bias voltage was locally applied to the surface with<br />
Probe-1, the surface potential was mapped with Probe-2 as a FM-KFM probe to visualize<br />
the injected carrier distribution. An obtained KFM image (the right <strong>of</strong> Fig. 1) shows that<br />
the higher potential region extends linearly along the PDA main chain from the Probe-1<br />
contact point, which means that the carriers injected from Probe-1 travel mainly through<br />
the diacetylene chain. In addition, the effect <strong>of</strong> a defect on the carrier transport was<br />
investigated. We positioned Probe-1 at a point on a line parallel to the main chain through<br />
a line defect which we had found. The right image <strong>of</strong> Fig. 2 shows that the potential<br />
sharply drops near the edge <strong>of</strong> the defect, which indicates a resistance increase at this<br />
point.<br />
Figure 1: AFM (Left) and KFM (Right) images<br />
<strong>of</strong> a poly-PTS single crystal obtained by twoprobe<br />
FM-AFM/KFM. Schematic <strong>of</strong> two-probe<br />
measurement is also shown (Left).<br />
[1] E. Tsunemi et al, Jpn. J. Appl. Phys. 46, 5636 (2007).<br />
85<br />
Figure 2: AFM (Left) and KFM (Right)<br />
images <strong>of</strong> a poly-PTS single crystal surface<br />
with a line defect.
Scattering Scanning Near-Field Optical <strong>Microscopy</strong><br />
performed by NC-AFM<br />
Fr-1020<br />
Ulrich Zerweck 1 , S.C. Schneider 1 , M.T. Wenzel 1 , H.-G. von Ribbeck 1 , S. Grafström 1 ,<br />
R. Jacob 2 , S. Winnerl 2 , M. Helm 2 , and L.M. Eng 1<br />
1 Institute <strong>of</strong> Applied Photophysics, Technische Universität Dresden, Dresden, Germany,<br />
2 Forschungszentrum Dresden Rossendorf, Dresden, Germany<br />
Many samples <strong>of</strong> interest show resonances in the IR to THz range, which are based<br />
e.g. on phonons or on chemical bonding. At these wavelengths, the classical optical<br />
resolution is strongly limited by the diffraction limit. In scattering scanning near-field<br />
optical microscopy (s-SNOM), an AFM tip operated in the non-contact mode is used both<br />
for the electric field concentration and the field enhancement at the tip apex to increase<br />
the optical resolution. The method is independent <strong>of</strong> the wavelength, and hence allows<br />
for high resolution measurements even at very large wavelengths (IR and THz<br />
frequencies).<br />
We combine s-SNOM with the free-electron laser (FEL) at the Forschungszentrum<br />
Dresden-Rossendorf 2 used as a precisely tunable and monochromatic high-power light<br />
source covering a wavelength range from 4 to 200 µm. With this unique setup, we are<br />
able to perform optical imaging <strong>of</strong> a sample as well as spectroscopy by tuning the<br />
wavelength <strong>of</strong> the FEL [1] (see Fig. 1).<br />
We study different types <strong>of</strong> phonon-resonant samples such as ferroelectric LiNbO3<br />
and BaTiO3, semiconductors with different doping concentrations, and Si-SiO2<br />
nanostructures.<br />
Figure 1: a) Sketch <strong>of</strong> the s-SNOM setup inspecting uniaxial ferroelectric BaTiO3 with<br />
orientation <strong>of</strong> its optical axis perpendicular or parallel to the sample surface on different domains;<br />
b) near-field imaging <strong>of</strong> BaTiO3 with contrast reversal at different optical wavelengths, and c)<br />
distance-dependent near-field spectroscopy on BaTiO3.<br />
[1] S.C. Schneider, PhD thesis, TU Dresden, Germany (2007)<br />
86
<strong>Atomic</strong> resolution dynamic lateral force microscopy in liquid<br />
Shuhei Nishida, Dai Kobayashi, Noriyuki Okabe, and Hideki Kawakatsu<br />
Fr-1120<br />
Institute <strong>of</strong> Industrial Science, The University <strong>of</strong> Tokyo, 4-6-1 Komaba, Meguro-ku, Tokyo 153-8505, Japan<br />
snishida@iis.u-tokyo.ac.jp<br />
A key step to achieve atomic resolution imaging in dynamic lateral force<br />
microscopy (DLFM) is to reduce the lateral tip amplitude down to less than atomic lattice<br />
scale <strong>of</strong> the sample. Use <strong>of</strong> high-frequency cantilever vibration modes is effective for<br />
reducing the tip amplitude. In this contribution, we demonstrate atomic resolution DLFM<br />
imaging in liquid using a high-frequency torsional mode.<br />
We performed the DLFM imaging using an optically based method combining<br />
photothermal excitation and laser Doppler velocimetry for utilizing various cantilever<br />
vibration modes [1,2]. We excited and detected the first torsional mode with the<br />
resonance frequency <strong>of</strong> 1.15 MHz, and reduced the lateral tip amplitude down to 1.3 Å<br />
with keeping vibration stability.<br />
Figure 1(a) shows a DLFM image <strong>of</strong> a muscovite mica surface immersed in purified<br />
water. The small tip amplitude around a quarter <strong>of</strong> the mica’s lattice constant allowed us<br />
to achieve atomic resolution imaging. Cross sectional analysis <strong>of</strong> the image at the<br />
meandering features suggests that the force acting on the tip from a tetrahedral silicate<br />
group was overlapped with the force from the neighboring silicate group along the<br />
vibration direction (Fig. 1(b)).<br />
(a) (b)<br />
Figure 1: DLFM imaging <strong>of</strong> a muscovite mica surface immersed in purified water. (a) A<br />
topographic image, drive frequency: 1,158,225 Hz, scan size: 10 x 10 nm 2 . (b) A line pr<strong>of</strong>ile<br />
along the solid line in (a).<br />
[1] S. Nishida, D. Kobayashi, T. Sakurada, T. Nakazawa, Y. Hoshi, and H. Kawakatsu, Rev. Sci. Instrum.<br />
79, 123703 (2008).<br />
[2] S. Nishida, D. Kobayashi, H. Kawakatsu, and Y. Nishimori, J. Vac. Sci. Technol. B 27, 964 (2009).<br />
87
Fr-1140<br />
Molecular-scale Investigations <strong>of</strong> Biomolecules in Liquids by FM-AFM<br />
Shinichiro Ido 1 , Noriaki Oyabu 1,2 , Kei Kobayashi 2,3 , Yoshiki Hirata 4 , Masaru Tsukada 5 ,<br />
Kazumi Matsushige 1 , and Hir<strong>of</strong>umi Yamada 1,2<br />
1 Department <strong>of</strong> Electronic Science and <strong>Engineering</strong>, Kyoto University, Kyoto, Japan<br />
2 Japan Science and Technology Agency /Adv. Meas. & Analysis, Japan<br />
3 Innovative Collaboration Center, Kyoto University, Kyoto, Japan<br />
4 National Institute <strong>of</strong> Advanced Industrial Science and Technology, Tsukuba, Japan<br />
5 Advanced Institute for Materials Research,Tohoku University ,Sendai, Japan<br />
Recent, rapid progress in high-resolution frequency modulation atomic force<br />
microscopy (FM-AFM) in liquid environments has opened a new way to directly<br />
investigate "in vivo" biological processes with molecular resolution [1,2]. In this study,<br />
submolecular-resolution imaging <strong>of</strong> DNA molecules and proteins has been conducted<br />
toward the molecular scale analysis <strong>of</strong> DNA-protein interactions dominating site-specific<br />
binding <strong>of</strong> proteins to DNA. In addition, three-dimensional (3D) hydration structures on<br />
the biomolecules have been visualized for exploring the roles <strong>of</strong> water molecules in the<br />
biological functions.<br />
A low-thermal-drift FM-AFM developed based on a commercial AFM apparatus<br />
with a home-built low-noise electronics system. Figure 1(a) shows an FM-AFM image <strong>of</strong><br />
a pUC18 plasmid DNA (2686 bp) adsorbed onto a mica surface in a buffer solution<br />
containing 50 mM NiCl2. The major grooves (2.2 nm wide) indicated by the gray arrows<br />
and the minor grooves (1.2 nm wide) indicated by the white arrows along the DNA<br />
chains were clearly resolved. Figure 1(b) shows an FM-AFM image <strong>of</strong> bR trimers on the<br />
cytoplasmic side <strong>of</strong> a purple membrane patch on a mica substrate in a phosphate buffer<br />
solution. A two-dimensional (2D) frequency shift (Δf) mapping image (X-Z) on the<br />
membrane was also shown.<br />
a) b)<br />
Figure 1: (a) FM-AFM image <strong>of</strong> pUC18 plasmid DNA on a mica substrate in 50mM NiCl2<br />
solution. Image size: 48.4 nm × 20.0 nm. Inset: simulated structural model <strong>of</strong> DNA taking the tip<br />
size effect into account. Image size: 10.0 nm × 5.5 nm. (b) FM-AFM image (image size: 29.1 nm<br />
× 29.1 nm) and 2D frequency shift mapping image (image size: 29.1 nm × 2.5 nm) <strong>of</strong> a purple<br />
membrane patch in buffer solution.<br />
[1] T. Fukuma, K. Kobayashi, K. Matsushige, and H. Yamada. Appl. Phys Lett. 87, 034101 (2005).<br />
[2] S. Rode, N. Oyabu, K. Kobayashi, H. Yamada, A. Kuhnle. Langmuir 25, 2850 (2009).<br />
88
Bimodal AFM imaging <strong>of</strong> antibodies and chaperonins in liquids<br />
E.T. Herruzo, C. Dietz, J.R. Lozano and R.Garcia<br />
Instituto de Microelectrónica de Madrid (CSIC), Madrid, Spain<br />
Fr-1200<br />
Bimodal AFM is novel probe microscopy method based on the simultaneous excitation <strong>of</strong><br />
the first two flexural modes <strong>of</strong> the cantilever. The instrument opens up additional<br />
channels (amplitude and phase <strong>of</strong> the 2 nd mode) which can be used for imaging with<br />
enhanced lateral resolution and compositional contrast with respect to amplitude<br />
modulation AFM.<br />
Here, we discuss the performance <strong>of</strong> the Bimodal AFM in water and buffer solutions by<br />
imaging and resolving the structural components <strong>of</strong> isolated biomolecules and packed<br />
protein arrays. Bimodal AFM images <strong>of</strong> antibodies reveal the subunits in both monomer<br />
and pentameric forms by applying very low forces. Unprocessed high resolution images<br />
<strong>of</strong> GroEL reveal the seven-fold symmetry <strong>of</strong> the protein.<br />
We also perform theoretical and numerical simulations to characterize Bimodal AFM<br />
operation. Our model allows us to study the material contrast sensitivity <strong>of</strong> the two<br />
additional channels (amplitude and phase <strong>of</strong> the 2 nd mode) that can be used for imaging.<br />
The theoretical approach also allows us to estimate the forces applied on the sample<br />
during bimodal AFM operation. The calculated forces are small, due to the enhanced<br />
sensitivity <strong>of</strong> 2 nd mode phase to detect changes while the cantilever is far away from the<br />
sample.<br />
Figure 1<br />
a) b)<br />
Figure 2<br />
Figure 1. Bimodal (a) and topography (b) image <strong>of</strong> an isolated IgM antibody in water.<br />
Figure 2. Topography image under Bimodal AFM imaging <strong>of</strong> GroEl chaperonins in buffer.<br />
[1] Rodriguez T R and Garcia R 2004 Appl. Phys. Lett. 84 449–51<br />
[2] Martinez N F, Patil S, Lozano J R and Garcia R 2006, Appl. Phys. Lett. 89 153115–3<br />
[3] Patil S, Martinez N F, Lozano J R and Garcia R 2007, J. Mol. Recognit. 20 516–23<br />
[4] Lozano J R and Garcia R 2008 Phys. Rev. Lett,100 076102–4<br />
[5] N F Martínez et al 2008 Nanotechnology 19 384011<br />
89
Fr-1220<br />
Redox-state Dependent Reversible Change <strong>of</strong> Molecular Ensembles in<br />
Water Solution by Electrochemical FM-AFM<br />
Ken-ichi Umeda 1† , Yasuyuki Yokota 2 , and Ken-ichi Fukui 2,3<br />
1 Department <strong>of</strong> Chemistry, Tokyo Institute <strong>of</strong> Technology, Tokyo, Japan.<br />
2 Department <strong>of</strong> Materials <strong>Engineering</strong> Science, Osaka University, Osaka, Japan.<br />
3 PRESTO, Japan Science and Technology Agency, Saitama, Japan.<br />
Electrochemisty can provide wide range <strong>of</strong> science and technology because <strong>of</strong> easy<br />
control <strong>of</strong> electrochemical potentials <strong>of</strong> interfaces and adsorbed molecules, which initiate<br />
electron transfer and chemical reactions hard to achieve in vacuum. Redox-active<br />
molecules fixed on the electrode can reversibly change their charges depending on the<br />
electrode potential, which makes it possible to introduce a point charge at the<br />
electrode/solution interface. Following the recipe in literature to reduce the deflection<br />
noise density in liquid-phase measurements, we have developed a frequency-modulation<br />
AFM applicable in electrochemical environments with controlling the potential <strong>of</strong> the tip<br />
and the sample. By using the EC-FM-AFM, we have studied how the charging <strong>of</strong> the<br />
molecule fixed at the electrode/solution interface affect the local structure.<br />
Ferrocenylundecanethiol (FcC11H22SH) molecules were embedded in an n-decanethiol<br />
(C10H21SH) self-assembled monolayer (SAM) matrix as molecular islands In Figure 1(a),<br />
the Fc-islands are shown as bright protrusions, whose apparent height differ depending<br />
on their lateral size (number <strong>of</strong> involved molecules). By changing the charge <strong>of</strong> Fcterminal<br />
groups from Fc 0 to Fc +1 , the apparent height and the lateral size <strong>of</strong> each Fcisland<br />
has clearly increased as shown in Figure 1(b). The process was reversible against<br />
the potential change, and originated from the change in the local charge. Simultaneously<br />
obtained energy dissipation signal has decreased at the island when the Fc-islands had<br />
positive charge. These results can be reasonably explained by the formation <strong>of</strong> ion<br />
network from Fc + and ClO4 - counter anions supplied from the electrolyte water solution.<br />
(a) Fc (b) 0<br />
Fc +1<br />
Figure 1: In situ EC-FM-AFM images (Δƒ = +528 Hz) <strong>of</strong> FcC11H22SH islands embedded in<br />
C10H21SH SAM (200×160 nm 2 50 nm 50 nm<br />
) at different electrochemical potentials: (a) substrate potential (Es)<br />
= tip potential (Et) = -0.8 V, (b) Es = Et = -0.4 V vs. Au/AuOx, respectively. The amplitude <strong>of</strong><br />
cantilever vibration was maintained in a feedback loop to be 0.5 nm.<br />
†<br />
Present address: Department <strong>of</strong> Electronic Science and <strong>Engineering</strong>, Kyoto University, Japan.<br />
90
Poster<br />
Session I<br />
Tuesday, 11 August<br />
91
P.I-01<br />
<strong>Force</strong> and Tunneling Current Measurements on the Semiconductor<br />
Surface<br />
Daisuke Sawada, Yoshiaki Sugimoto, Ken-ichi Morita, Masayuki Abe, and Seizo Morita<br />
Graduate <strong>School</strong> <strong>of</strong> <strong>Engineering</strong>, Osaka University, 2-1 Yamada-Oka, Suita, Osaka, 565-0871, Japan.<br />
Non-contact atomic force microscopy (NC-AFM) and scanning tunneling microscopy<br />
(STM) enable us to obtain atomically-resolved information, for example, chemical<br />
bonding force or local density <strong>of</strong> state (LDOS). Recently, at the near contact region, the<br />
drop <strong>of</strong> the tunneling current was reported using conventional STM [1]. The drop <strong>of</strong> the<br />
tunneling current was explained by the chemical bonding formation, however, such<br />
correlation has not been measured experimentally. We measured the force and the<br />
tunneling current simultaneously using metal coated Si cantilevers. Here, we report our<br />
results on both the Si(111)-(7×7) surface and the Ge(111)-c(2×8) surface at room<br />
temperature using the feedforward technique in order to compensate the thermal drift [2].<br />
In constant height simultaneous measurement, atomic image contrast between the<br />
AFM image and the STM image are different [Fig.1 a), b)]. We obtained FSR-z and It-z<br />
curves on the adatom <strong>of</strong> the Ge(111)-c(2×8) surface by measuring Δf-z and -z curves<br />
[Fig.1 c)]. The drop <strong>of</strong> It was oabserved at the onset <strong>of</strong> FSR with decreasing the tip-surface<br />
distance. The drops were observed on the Ge(111)-c(2×8) surface as well as the Si(111)-<br />
(7×7) surface [3].<br />
A part <strong>of</strong> this work was supported by Grant-in-Aid for Scientific Research on<br />
Priority Areas “Nano Materials Science for <strong>Atomic</strong> Scale Modification” and Global COE<br />
Program, “Center for Electronic Devices Innovation”.<br />
Figure 1: Δf image a) and image b) were obtained simultaneously in the constant height<br />
mode. The sample bias (Vs) is +500 mV. c) FSR-z and It-z curves measured on the Ge adatom<br />
at Vs= +500 mV.<br />
[1] P. Jelínek, et al., Phys. Rev. Lett. 101, 176101 (2008).<br />
[2] M. Abe, et al., Appl. Phys. Lett. 90, 203103 (2007).<br />
[3] D. Sawada, et al., Appl. Phys. Lett. 94, 173117 (2009).<br />
92
P.I-02<br />
<strong>Force</strong> Map <strong>of</strong> <strong>Atomic</strong> <strong>Force</strong> <strong>Microscopy</strong> on Si(111)-(5x5)-DAS Surface<br />
Akira Masago and Masaru Tsukada<br />
WPI-AIMR, Tohoku University, 2-1-1 Katahira, Aoba, Sendai, 980-8577 Japan<br />
Recently, lateral force mapping has been performed by atomic force microscopy (AFM)<br />
on the Si(111)-(7x7)-(Dimer-Adatom-Stacking fault (DAS)) surface, as well as potential<br />
and vertical force mapping. We believe that they provide us with useful information for<br />
atomic identification and manipulation. In this study, we simulated force maps along the<br />
long diagonal direction <strong>of</strong> the unit cell <strong>of</strong> the Si(111)-(5x5)-DAS surface using the<br />
density-functional based tight-binding (DFTB) calculation. As a result, we obtained force<br />
maps shown in Fig. 1, using a Si4H9 cluster tip. In the vertical force map, the small peaks<br />
located at the rest atoms (Rs) as well as the large peaks at the adatoms (Ad). Moreover,<br />
the plateaus also exist at bridge site (Br) <strong>of</strong> the adatoms out <strong>of</strong> the scan trajectory. In the<br />
lateral force maps, we can see paired peaks located at the adatoms and rest atoms. These<br />
characters must be related with the atomic configuration <strong>of</strong> the tip apex. In our<br />
presentation, we will talk about the relation between remarkable characters that present<br />
on the force maps and various configurations <strong>of</strong> the tip apex.<br />
Figure 1: Vertical and lateral force maps when the tip scans along a long diagonal line <strong>of</strong> a unit<br />
cell <strong>of</strong> the Si(001)-(5x5)-DAS surface as well as side and top views <strong>of</strong> the surface. All circles<br />
denote Si atoms, where open and fill circles denote adatoms and rest atoms, respectively. In<br />
particular, open circles written in bold face are adatoms on the scan trajectory.<br />
93
From non-contact to atomic scale contact between a Si tip and a Si<br />
surface analyzed using an nc-AFM and nc-AFS based instrument<br />
P.I-03<br />
Toyoko Arai 1 , Kosei Kiyohara 1 , Taiki Sato 1 , Shugaku Kushida 2 and Masahiko Tomitori 2<br />
1 Graduate <strong>School</strong> <strong>of</strong> Natural science & Technology, Kanazawa University, Kanazawa, Ishikawa, Japan<br />
2 <strong>School</strong> <strong>of</strong> Materials Science, Japan Advanced Institute <strong>of</strong> Science and Technology, Nomi, Ishikawa Japan<br />
The scanning probe microscopy (SPM) is a powerful tool to observe a sample surface<br />
with atomic resolution as well as spectroscopic measurements and atom/molecule<br />
manipulation. Since the advent <strong>of</strong> SPM, we are able to bring an atomically sharpened tip<br />
very close to a sample in a well-controlled manner, in particular, by non-contact atomic<br />
force microscopy (nc-AFM); the force interaction detected by nc-AFM changes so<br />
drastically at atomically close separations that the precise control <strong>of</strong> separation is<br />
performed. The quantum mechanical properties become prominent at those distances<br />
between a tip and a sample; chemical covalent bonding is formed at less than 1 nm, the<br />
tunneling barrier between them collapses, and at closer distances, an atomically necking<br />
can be shaped and quantized conductance comes up through atomically confined<br />
channels or intermediate electronic states in between. The quantized phenomena at the<br />
point contact have attracted much interest, including its formation process from noncontact<br />
through pseudo-contact to contact. Not only the force interaction, but also the<br />
electric conductance properties can be evaluated using an instrument based on nc-AFM<br />
combined with spectroscopic methods at those separations, i.e., bias-voltage non-contact<br />
atomic force spectroscopy (nc-AFS) with the ability to measure electric current with<br />
respect to bias voltage between a tip and a sample [1]. From a viewpoint <strong>of</strong> application,<br />
contact formation between two pieces <strong>of</strong> condensed matter is crucial to fabricate novel<br />
nanoscale devices. Here we focus on Si-Si contact and non-contact states analyzed by an<br />
nc-AFM and nc-AFS based instrument. Although silicon-silicon contacts sounds very<br />
important in industries and various types <strong>of</strong> Si nanowires have been synthesized, there are<br />
few reports on their nanoscale electromechanical properties.<br />
Experiments were conducted using a home-made UHV-AFM/AFS instrument with a<br />
B-doped Si piezoresistive cantilever having a [001]-oriented Si for samples <strong>of</strong> n- and ptype<br />
Si(111). After cleaning the tip and the sample by heating in UHV, we took nc-AFM<br />
images simultaneously with current, averaged over a cantilever oscillation cycle, and<br />
damping with changing bias voltage, while taking spectroscopic curves <strong>of</strong> frequency shift<br />
current and damping versus bias voltage or tip-sample separation. By slowly approaching<br />
and retracting with compensation <strong>of</strong> z-direction thermal drift, the current-separation<br />
curves with a good S/N ratio exhibited features from tunneling regime to saturation<br />
toward tunneling barrier collapse, leading to chemical bond formation. The damping also<br />
exhibited curious features possibly due to charge change around the tip and the sample.<br />
For Si point contacts current-voltage curves showed p-p or p-n junction characteristics<br />
with staircase behaviors. The details and discussion will be presented.<br />
1. [1] T. Arai and M. Tomitori: Phys.<br />
Rev. B 73 (2006) 073307.<br />
94
P.I-04<br />
Improved atomic-scale contrast via bimodal dynamic force microscopy<br />
S. Kawai, Th. Glatzel, S. Koch, B. Such, A. Barat<strong>of</strong>f, and E. Meyer<br />
Department <strong>of</strong> Physics, University <strong>of</strong> Basel, Klingelbergstr. 82, 4056 Basel Switzerland<br />
We extend multi-frequency AFM to atomically resolved frequency-modulation<br />
dynamic force microscopy and demonstrate a further improvement <strong>of</strong> spatial resolution in<br />
ultra-high vacuum [1]. The first and second flexural resonance modes <strong>of</strong> a commercially<br />
available Si cantilever are simultaneously self-excited with given amplitudes, and the<br />
resonance frequency shifts (Δf1st and Δf2nd) are demodulated by two phase-locked loop<br />
circuits (Nanonis: Dual-OC4). The combination <strong>of</strong> sub-angstrom amplitude oscillation<br />
A2nd at the second resonance with the commonly used large amplitude oscillation A1st at<br />
the first resonance enables higher resolution imaging at closer tip-sample distances while<br />
avoiding atomic jump-to-contact instabilities, which are more likely at such distances<br />
during small amplitude operation with a single mode [2-4].<br />
Figure 1 shows a series <strong>of</strong> simultaneously recorded Δf1st and Δf2nd maps <strong>of</strong> KBr(001),<br />
obtained with A1st=16 nm and A2nd=50 pm at decreasing tip-sample distances in the<br />
attractive region, recorded in the quasi-constant height mode. Being more sensitive to the<br />
short-range interaction, Δf2nd exhibits a stronger distance dependence and contrast than<br />
Δf1st at short distances. Although A2nd was much smaller then the width <strong>of</strong> the measured<br />
force minimum, the signal-to-noise in the Δf2nd map was higher than in the Δf1st map at<br />
close tip-sample distances [(e) and (f)]. The enhanced sensitivity to the short-range<br />
interaction could even reveal tip and/or sample deformations induced by the interaction<br />
force.<br />
Figure 1: A series <strong>of</strong> simultaneously recorded Δf1st and Δf2nd maps at decreasing tip-sample<br />
distances (a – f). The first and second resonance frequencies are 154021 Hz and 960874 Hz, and<br />
the Q factors and amplitudes are 31059 and 6246, and A1st=16 nm and A2nd=50 pm, respectively.<br />
[1] S. Kawai et al., submitted.<br />
[2] F. J. Giessibl et al., Science 289, 422 (2000).<br />
[3] S. Kawai et al., Appl. Phys. Lett. 86, 193107 (2005).<br />
[4] S. Kawai and H. Kawakatsu, Appl. Phys. Lett. 88, 133103 (2006).<br />
95
Static cantilever deflection in dynamic force microscopy<br />
S. Kawai, Th. Glatzel, S. Koch, B. Such, A. Barat<strong>of</strong>f, and E. Meyer<br />
Department <strong>of</strong> Physics, University <strong>of</strong> Basel, Klingelbergstr. 82, 4056 Basel Switzerland<br />
P.I-05<br />
So far, the influence <strong>of</strong> the time-averaged cantilever deflection in dynamic force<br />
microscopy (DFM) and spectroscopy [1] has been assumed negligibly small or constant,<br />
or else regarded as the source <strong>of</strong> jump-to-contact instabilities. But in fact, for a given tipsample<br />
distance <strong>of</strong> closest approach, the static deflection increases with decreasing<br />
oscillation amplitude. As a consequence, small-amplitude DFM is able to simultaneously<br />
detect the influence <strong>of</strong> atomic-scale interaction forces on time-averaged, as well as<br />
dynamic measured quantities. The use <strong>of</strong> higher resonances [2,3] is well-suited for this<br />
comparison because a typical static stiffness kc ~ 30 N/m can cause a measurable timeaveraged<br />
deflection. Nevertheless kc is still high enough to avoid cantilever jump-tocontact<br />
instabilities when a surface with a low reactivity is scanned with a sharp Si tip [4]<br />
We theoretically and experimentally studied the effects <strong>of</strong> the time-averaged<br />
deflection in DFM. Figure 1(a) and 1(b) shows a series <strong>of</strong> frequency shift and static<br />
deflection vs. distance curves measured using different amplitudes A2nd <strong>of</strong> the second<br />
flexural mode above a maximum <strong>of</strong> the topographic image <strong>of</strong> KBr(001). Figure 1(c)<br />
shows force vs. distance curves with and without compensation <strong>of</strong> the static deflection. It<br />
is found that the static deflection affects not only the Z-distance scale,<br />
but also the<br />
converted force. <strong>Force</strong> curves extracted from Δf2nd(Z) measured with different A2nd<br />
coincide if shifted along Z and exhibit a wiggle which is likely due to a sideways<br />
displacement <strong>of</strong> the tip apex towards a nearby counterion on the sample surface [1].<br />
Figure 1: A series <strong>of</strong> (a) frequency shift and (b) static deflection vs. distance curves. (c) <strong>Force</strong> vs.<br />
distance curves with (Zc) and without (Z’c) compensation <strong>of</strong> the static deflection.<br />
[1] A. Schirmeisen et al., Phys. Rev. Lett. 97, 136001 (2007).<br />
[2] S. Kawai et al., Appl. Phys. Lett. 86, 193107 (2005).<br />
[3] S. Kawai and H. Kawakatsu, Appl. Phys. Lett. 88, 133103 (2006)<br />
[4] S. Kawai and H. Kawakatsu, Phys. Rev. B 79, 115440 (2009).<br />
96
P.I-06<br />
Resonance frequency shift due to tip-sample interaction in the thermal<br />
oscillations regime<br />
Giovanna Malegori, Gabriele Ferrini<br />
Dipartimento di Matematica e Fisica, Università Cattolica, Brescia, Italy<br />
We present results on the interaction <strong>of</strong> a cantilever in the thermal oscillations regime<br />
with the force gradients near various kind <strong>of</strong> surfaces. As is well known, the power<br />
density spectrum <strong>of</strong> a cantilever freely oscillating in the absence <strong>of</strong> external modulation<br />
shows the thermal amplitude and resonance frequency <strong>of</strong> its flexural modes. As the tip<br />
approaches a surface, a frequency shift in the amplitude and resonance frequency <strong>of</strong> the<br />
thermally excited flexural modes is measured as a function <strong>of</strong> the tip-sample separation,<br />
until jump-to-contact sets in. After jump-to-contact, the power density spectrum <strong>of</strong> the<br />
cantilever fluctuations changes due to the fact it has a supported end. A comparison with<br />
available models permits to identify the flexural modes in the two situations (we detect<br />
four flexural modes for the free end cantilever and two for the supported end cantilever)<br />
and to extract information about the interaction force gradients. The mean vibration<br />
amplitude in the various flexural modes is in the range <strong>of</strong> 10-100 pm at room<br />
temperature, according to the stiffness <strong>of</strong> the cantilever. Finally, we describe the<br />
acquisition techniques and background requirements for the instrumentation.<br />
97
Influence <strong>of</strong> thermal noise on measurements <strong>of</strong><br />
chemical bonds in UHV-AFM<br />
Peter M. H<strong>of</strong>fmann<br />
Department <strong>of</strong> Physics and Astronomy, Wayne State University, Detroit, MI 48201<br />
P.I-07<br />
Ultra-high vacuum based AFM has been repeatedly shown to provide high resolution<br />
measurements <strong>of</strong> forces and force gradients associated with chemical bonds 1-5 . However,<br />
the bond parameters, such as bond length and energies, have varied between<br />
measurements. One theory put forward for these discrepancies has been the influence <strong>of</strong><br />
thermal noise on measurements performed at room temperature. In FM-AFM it was<br />
originally found that bond force curves seem broadened when measured at room<br />
temperature 1 , and theoretically expected bond lengths were only recovered when<br />
measurements were obtained at low temperature 2 . On the other hand, AM-AFM<br />
performed at small amplitudes found no such broadening at room temperature 3 . More<br />
recent measurements using FM AFM at room temperature, however, also seem to show<br />
shorter interaction lengths 4,5 . What, if any, is the influence <strong>of</strong> cantilever thermal noise on<br />
measured interaction lengths? We present a simulation study <strong>of</strong> the influence <strong>of</strong> thermal<br />
noise on measurements <strong>of</strong> interaction forces using FM or AM AFM.<br />
[1] M. Guggisberg, et al., Phys. Rev. B 61, 11151 (2000).<br />
[2] M. A. Lantz, et al., Science 291, 2580 (2001).<br />
[3] P.M. H<strong>of</strong>fmann, et al.. Proc. Royal Soc. Lond. 457, 1161-1174 (2001).<br />
[4] Y. Sugimoto et al., Phys. Rev. B 77, 195424 (2008).<br />
[5] K. Ruschmeier et al., Phys. Rev. Lett. 101, 156102 (2008)<br />
98
P.I-08<br />
<strong>Atomic</strong> force microscope cantilever resonance frequency shift based<br />
thermal metrology<br />
Arvind Narayanaswamy 1 , Carlo Canetta 1 , and Ning Gu 2<br />
1 Department <strong>of</strong> Mechanical <strong>Engineering</strong>, Columbia University, New York, USA.<br />
2 Department <strong>of</strong> Electrical <strong>Engineering</strong>, Columbia University, New York, USA.<br />
The atomic force microscope (AFM) is now an indispensable tool not only in obtaining<br />
topographical images <strong>of</strong> the surfaces <strong>of</strong> physical objects but also measuring the forces,<br />
such as van der Waals and Casimir, between two objects, one <strong>of</strong> which is the tip <strong>of</strong> the<br />
AFM cantilever or a microsphere attached to the cantilever, and the other is a substrate<br />
mounted on a translation stage. We have used a bi-material AFM cantilever to measure<br />
the radiative transfer, instead <strong>of</strong> force, between a microsphere attached to a cantilever and<br />
a substrate, thereby extending the capabilities <strong>of</strong> a conventional AFM with minor<br />
modifications. Unlike force measurement, which can use the static deflection <strong>of</strong> the<br />
cantilever or the frequency shift <strong>of</strong> a resonance mode, the heat transfer can be measured<br />
only through the static deflection <strong>of</strong> the cantilever. However, with cantilevers to which<br />
microspheres are attached to the tip, the flexural as well as torsional modes <strong>of</strong> the<br />
cantilever exhibit a frequency shift due to the temperature changes <strong>of</strong> the cantilever that<br />
is independent <strong>of</strong> the variation <strong>of</strong> material properties with temperature. The frequency<br />
shift is due to the change in curvature <strong>of</strong> the cantilever, in this case due to temperature<br />
changes, and is more pronounced for higher order modes compared to the fundamental<br />
flexural resonance mode. Though not as sensitive a technique as measuring temperature<br />
changes via static deflection, the resonance frequency based technique is more robust and<br />
can be calibrated to measure the absolute temperature as opposed to temperature shifts<br />
alone. While the frequency shift <strong>of</strong> the first flexural mode is small enough not to affect<br />
current non-contact force measurement techniques, it could affect force detection based<br />
on higher order modes.<br />
99
P.I-09<br />
Contact potential difference on the atomic-scale probed by<br />
Kelvin Probe <strong>Force</strong> <strong>Microscopy</strong>: an imaging scenario<br />
Laurent Nony 1 , Adam Foster 2 , Franck Bocquet 1 , and Christian Loppacher 1<br />
1<br />
Aix-Marseille Université, IM2NP, Av. Escadrille Normandie-Niemen, F-13397 Marseille and CNRS, IM2NP (UMR<br />
6242), Marseille-Toulon, France<br />
2<br />
Department <strong>of</strong> Physics, Tampere University <strong>of</strong> Technology,<br />
P.O. Box 692 FIN-33101 Tampere, Finland<br />
A fully numerical analysis <strong>of</strong> the origin <strong>of</strong> the atomic-scale contrast in Kelvin probe force<br />
microscopy (KPFM) is presented. The numerical implementation mimics recent experimental<br />
results on the (001) surface <strong>of</strong> a bulk alkali halide single crystal for which a simultaneous<br />
topographical and Kelvin, so-called Contact Potential Difference (CPD), atomic-scale contrast<br />
had been reported [1]. In this work, we have combined atomistic simulations <strong>of</strong> the tip-sample<br />
force field with our non-contact AFM/KPFM simulator [2] to compute topographical and CPD<br />
images. The force field notably includes the required short-range bias voltage dependence to<br />
account for the CPD atomic-scale contrast. The sample is a NaCl(001) single crystal. The<br />
atomistic simulations have been performed by means <strong>of</strong> the code SCIFI [3]. The simulator has<br />
been used in the Frequency-Modulation KPFM operating mode. The tip consists <strong>of</strong> a spherical<br />
metallic cap within which a 4x4x4 NaCl cluster with the [111] direction pointing towards the<br />
surface is partly embedded. The sample consists <strong>of</strong> a 10x10x4 NaCl slab embedded within a<br />
semi-infinite continuous medium merely described by its dielectric constant. The sample, with a<br />
macroscopic height (several millimeters), lies on a metallic counter-electrode that is biased with<br />
respect to the tip. Beyond the short-range chemical and electrostatic forces computed with SCIFI,<br />
we have included a usual Van der Waals long-range term and a less usual, although fundamental,<br />
long-range electrostatic interaction. This term mimics the weak capacitive interaction between tip<br />
and sample holders and is necessary to describe the behavior <strong>of</strong> the CPD with the distance.<br />
Figs.1a and b show that the simulator is able to account for the simultaneous topographical and<br />
CPD atomic-scale contrast, respectively. The occurrence <strong>of</strong> such a contrast is intricately<br />
connected to the dynamic polarization <strong>of</strong> the ions <strong>of</strong> the slab triggered by the modulation <strong>of</strong> the<br />
bias voltage, unless otherwise no Kelvin contrast is measured. The nc-AFM/KPFM simulator is a<br />
tool which helps in interpreting the experimental data quantitatively.<br />
References :<br />
[1]- F. Bocquet et al., Phys. Rev. B<br />
78, 035410 (2008)<br />
[2]- L. Kantorovich et al., Surf. Sci.<br />
445, 283 (2000)<br />
[3]- L. Nony et al., Phys. Rev. B 74,<br />
235439 (2006); L. Nony et al.,<br />
accepted in Nanotechnology<br />
Fig.1a- Topography channel<br />
measured at 0.45nm to the<br />
surface: the vertical contrast is<br />
40pm<br />
100<br />
Fig.1b- simultaneously<br />
acquired CPD channel: The<br />
vertical contrast is 0.6V
Self-assembled Boronitride Nanomesh on Rh(111)<br />
Investigated by Means <strong>of</strong> Kelvin Probe <strong>Force</strong> <strong>Microscopy</strong><br />
P.I-10<br />
Sascha Koch 1 , Markus Langer 1 , Jorge Lobo-Checa 1,3 , Thomas Brugger 2 , Shigeki<br />
Kawai 1 , Bartosz Such 1 , Ernst Meyer 1 and Thilo Glatzel 1<br />
1 Department <strong>of</strong> Physics, University <strong>of</strong> Basel, 4056 Basel, Switzerland<br />
2 Department <strong>of</strong> Physics, University <strong>of</strong> Zurich, 8006 Zurich, Switzerland<br />
3 Centre d'Investigaciò en Nanociència i Nanotecnologia (CIN2), Campus Universitat Autònoma de<br />
Barcelona, Spain<br />
By high temperature exposure <strong>of</strong> borazine [(HBNH)3], a self-assembled hexagonal<br />
nanomesh with a periodicity <strong>of</strong> about 3nm and a hole size <strong>of</strong> 2nm is formed on Rh(111)<br />
under UHV conditions [1]. The stable and periodic structure is perfectly suitable for<br />
trapping single molecules at room temperature [2]. The determination <strong>of</strong> local work<br />
function variations is a major requirement to understand the process <strong>of</strong> molecular<br />
adsorption. NC-AFM combined with Kelvin probe force microscopy (KPFM) enables<br />
imaging <strong>of</strong> the surface and simultaneous detection <strong>of</strong> the work function map with subnanometer<br />
resolution [3].<br />
Figure 1(a) shows the topography signal <strong>of</strong> the nanomesh which is in good agreement<br />
with previous STM results [1,2,4]. The Rh(111) surface is found to be completely<br />
covered with the mesh. Figure 1(b) shows the simultaneously obtained LCPD signal <strong>of</strong><br />
this superstructure clearly resolving a work function difference <strong>of</strong> the structure. Here a<br />
variation <strong>of</strong> the LCPD <strong>of</strong> approximately 600mV was detected.<br />
Figure 1: (a) AFM image <strong>of</strong> the bn-nanomesh (20x20nm 2 ). Parameters:<br />
Δf=-35Hz, A=4nm, f0=153kHz; Δz=650pm. (b) Simultaneously measured<br />
LCPD image. ΔLCPD=600mV, VAC=500mV, f1≈fAC=954kHz.<br />
[1] M.Corso, W. Auwärter, M. Muntwiler, A. Tamai, T. Greber, J. Osterwalder, Science 303, 217 (2004)<br />
[2] H. Dil, J. Lobo-Checa, R. Laskowski, et al., Science 319, 1824 (2008)<br />
[3] Th. Glatzel, L. Zimmerli, S. Koch, S. Kawai, E. Meyer; Appl. Phys. Lett., 94, 3 (2009)<br />
[4] S. Berner, M. Corso, R. Widmer et al., Ang. Chem. Int. Ed. 46, 5115 (2007)<br />
101
Kelvin probe force microscopy in application to organic thin films:<br />
P.I-11<br />
frequency modulation, amplitude modulation, and hover mode KPFM<br />
Brad Moores 1 , Francis Hane 2 , Lukas Eng 3 , and Zoya Leonenko 1,2<br />
1 Department <strong>of</strong> Physics and Astronomy, University <strong>of</strong> Waterloo, Waterloo, Canada<br />
2 Department <strong>of</strong> Biology, University <strong>of</strong> Waterloo, Waterloo, Canada<br />
3 Institute <strong>of</strong> Applied Photophysics, Technical University <strong>of</strong> Dresden, Dresden, Germany<br />
We applied Kelvin probe force microscopy (KPFM) to visualize the lateral surface<br />
potential distribution in thiol self-assembled monolayers and lipid-protein films. We have<br />
shown earlier (Leonenko, et al. Biophys. J. 2007) that function <strong>of</strong> Bovine Lipid Extract<br />
Surfactant (BLES) is related to the specific molecular architecture <strong>of</strong> surfactant films.<br />
Defined molecular arrangement <strong>of</strong> the lipids and proteins <strong>of</strong> the surfactant film give rise<br />
to a local highly variable electrical surface potential <strong>of</strong> the interface. In this work the<br />
resolution <strong>of</strong> frequency modulation (FM-KPFM), amplitude modulation (AM-KPFM)<br />
and hover (HM-KPFM) modes were compared. At larger scale and larger surface<br />
potential deviations all modes give high resolution images. At smaller scans and smaller<br />
differences in surface potential FM-KPFM mode gives superior resolution, and therefore<br />
is preferable for imaging lipid- and lipid-protein films. The response and sensitivity <strong>of</strong><br />
KPFM modes was addressed with the help <strong>of</strong> force measurements.<br />
102
P.I-12<br />
Resolution enhanced multifrequency electrostatic force microscopy<br />
under ambient conditions<br />
X. D. Ding 1 , J. B. Xu 2 , and J. X. Zhang 1<br />
1 State Key Laboratory <strong>of</strong> Optoelectronic Materials and Technologies, and <strong>School</strong> <strong>of</strong> Physics Science &<br />
<strong>Engineering</strong>, Sun Yat-sen University, Guangzhou 510275, China<br />
2 Department <strong>of</strong> Electronic <strong>Engineering</strong>, and Materials Science and Technology Research Center, The<br />
Chinese University <strong>of</strong> Hong Kong, Shatin, New Territories, Hong Kong, China.<br />
Electrostatic force microscopy (EFM) and Kelvin probe force microscopy (KPFM)<br />
are widely used to study the electrical and electrochemical characteristics <strong>of</strong> a variety <strong>of</strong><br />
material. The lateral resolution for EFM ia better than 10~20nm under vacuum conditions<br />
In contrast, the lateral resolution reported in literature is only 100 nm or so under ambient<br />
conditions. Though suffering from strong mechanical non-linearity <strong>of</strong> repulsive tip–<br />
sample contact, multifrequency method has been introduced to EFM recently[1].<br />
Here, we report an extension <strong>of</strong> multifrequency AFM with enhanced resolution to<br />
measure electrostatic force under ambient conditions[2]. The first eigenmode <strong>of</strong> a<br />
cantilever is used for topography imaging, while the third eigenmode is resonantly<br />
excitated with a sinusoidal modulation voltage applied on tip to measure electrostatic<br />
force in lift mode. Figure 1 shows the images for a thermally evaporated aluminum (Al)<br />
film on Si(111). Due to the surface potential variation <strong>of</strong> the sample, the EFM image in<br />
figure 1(b) shows a well reproduced contrast different from its corresponding topographic<br />
image in figure 1(a). The lateral resolution is better than 15nm determined from the line<br />
pr<strong>of</strong>ile in figure 1(c). The enhancement <strong>of</strong> resolution is ascribed to the suppress <strong>of</strong> the<br />
cantilever-sample interactions and the increase <strong>of</strong> the tip-sample interactions due to the<br />
use <strong>of</strong> the third eigenmode <strong>of</strong> the probe.<br />
80nm<br />
30 50 70<br />
Position, nm<br />
(a) (b) (c)<br />
Figure 1: Experimental results <strong>of</strong> the multifrequency EFM for Al film on Si(111) under ambient<br />
conditions. (a) Topography image. (b) EFM Image, and (c) The line pr<strong>of</strong>ile along the arrow in (b)<br />
[1] R. W. Stark, N. Naujoks, and A. Stemmer, Nanotechnology 18, 065502 (2007).<br />
[2] X. D. Ding, C. Li, R. Y. Zeng, J. An, and J. B. Xu, Appl. Phys. Lett. (To be published)<br />
(X. D. Ding, Category 7-Kelvin probe microscopy is fitted and an Oral presentation is preferred)<br />
103<br />
Electrostatic <strong>Force</strong>, a.u.<br />
1.5<br />
1.0<br />
0.5<br />
10-15nm
P.I-13<br />
Deconvolution and Tip Geometry Effects in <strong>Atomic</strong>- and Nanoscale Kelvin probe<br />
<strong>Force</strong> <strong>Microscopy</strong><br />
George Elias 1 , Yossi Rosenwaks 1 , Amir Boag 1 , Ernst Meyer 2 , and Thilo Glatzel 2<br />
1 Dept. <strong>of</strong> Physical Electronics, Tel-Aviv University, Tel Aviv 69978, Israel<br />
2 Dept. <strong>of</strong> Physics, University <strong>of</strong> Basel, Klingelbergstr. 82, 4056 Basel, Switzerland<br />
In Kelvin probe force microscopy (KPFM) the long range electrostatic forces between the<br />
tip and the surface prevents quantitative measurement <strong>of</strong> nanostructures; however this<br />
can become feasible by developing appropriate deconvolution algorithms that restore the<br />
actual sample work function. We present such novel algorithms and methods that enable<br />
us to restore measurements conducted at tip-sample distances below 1 nm, while taking<br />
into account also the measured topography. Fitting the restored images with KPFM<br />
measurements <strong>of</strong> samples with well defined work function values has allowed us to<br />
extract the measuring tip geometry and validate our deconvolution methods.<br />
The three dimensional potential <strong>of</strong> the tip-sample system is calculated using an<br />
integral equation based boundary element method, combined with modeling the sample<br />
by an equivalent dipole-layer and image-charge model. The tip is modeled using MSC<br />
Patran finite element mesh, to create a high density mesh on the tip apex and a lower<br />
density mesh far from the sample as shown in Figure 1 (left). The middle figure shows a<br />
measured UHV-KPFM image <strong>of</strong> NaCl thin film grown on Cu (111) and a comparison<br />
with convolutions performed with 3 different tip apex radii (right). The excellent<br />
agreement obtained for a tip apex <strong>of</strong> 10nm allows to estimate the tip apex geometry, and<br />
helps to validate our convolution algorithms. Implications for real tip shapes (nanotips)<br />
and atomic resolution imaging is demonstrated and discussed<br />
Figure 1: (left) Full tip geometry mesh and tip apex mesh ; (middle) a KPFM measurement <strong>of</strong><br />
NaCl thin films grown on Cu(111); (right) a comparison between the measured KPFM line in the<br />
middle image and convolutions performed for 3 tip apex radii (half opening angle <strong>of</strong> 17.5º) <strong>of</strong> 3,<br />
6, and 10 nm.<br />
104
P.I-14<br />
Kelvin <strong>Force</strong> <strong>Microscopy</strong> Dynamic Behavior and Noise Propagation<br />
Heinrich Diesinger, Dominique Deresmes, Jean-Philippe Nys, and Thierry Mélin<br />
Institut d’Electronique, Microelectronique et Nanotechnologie, CNRS UMR 8520, Department<br />
ISEN,Avenue Henri Poincaré, 59652 Villeneuve d’Ascq, France<br />
The bandwidth <strong>of</strong> scanning probe control loops limits the sampling rate in data<br />
acquisition. In this work, the dynamic behavior <strong>of</strong> amplitude detection (AM) and<br />
frequency detection (FM) Kelvin force microscopy (KFM) setups is analyzed and<br />
optimized. Since enhanced bandwidth alone would increase speed at the cost <strong>of</strong> tolerating<br />
more noise, the origin <strong>of</strong> noise and its propagation within the control loops are studied in<br />
parallel.<br />
Laser Diode Photodetector<br />
F N = 4γk B T<br />
CPD<br />
V PD<br />
V PD, N = 10 μV/sqrt(Hz)<br />
In<br />
Lock-in<br />
Osc<br />
V<br />
bias, AC<br />
fres2 X<br />
PI Amplifier<br />
Kelvin Controller<br />
+<br />
Σ =<br />
+<br />
V Kelvin<br />
open closed<br />
Figure 1: Setup <strong>of</strong> the Kelvin control loop <strong>of</strong> an AM-KFM, consisting <strong>of</strong> a lock-in amplifier<br />
exciting the probe electrostatically at its second resonance, and a PI error amplifier to close the<br />
feedback loop and to apply the Kelvin voltage to the probe. The loop can be opened. Main noise<br />
sources are the thermal probe excitation force and white noise at the output <strong>of</strong> the photodetector.<br />
Fig. 1 shows the Kelvin control loop <strong>of</strong> an AM-KFM in ultrahigh vacuum, using the<br />
second cantilever resonance for KFM while distance control is based on the first, similar<br />
to the setup demonstrated by Kikukawa et al.[1]. The noise power spectral density <strong>of</strong> the<br />
Kelvin output signal can be modeled after the transfer functions <strong>of</strong> the different stages<br />
have been measured in open loop configuration. A benchmark criterium for comparing<br />
hardware with respect to noise is issued. An FM KFM close to the configuration<br />
suggested by Kitamura [2] is also analyzed. Advantages and drawbacks <strong>of</strong> both methods<br />
in terms <strong>of</strong> bandwidth and signal to noise are discussed.<br />
[1] A. Kikukawa, S. Hosaka, and R. Imura. Appl. Phys. Lett. 66, 3510 (1995).<br />
[2] S. Kitamura and M. Iwatsuki. Appl. Phys. Lett. 72, 3154 (1998)<br />
105
Charge transfer from doped silicon nanocrystals<br />
P.I-15<br />
Łukasz BOROWIK 1 , Thuat NGUYEN-TRAN 2 , Pere ROCA i CABARROCAS 2 , Koku<br />
KUSIAKU 1 , Didier THERON 1 , Heinrich DIESINGER 1 , Dominique DEREMES 1 , and<br />
Thierry MELIN 1<br />
1<br />
Institut d’Electronique, de Microélectronique et de Nanotechnologie, CNRS-UMR 8520, Av . Poincaré,<br />
BP 60069, 59652 Villeneuve d’Ascq, France<br />
2<br />
Laboratoire de Physique des Interfaces et des Couches Minces, CNRS-UMR 7647, Ecole Polytechnique<br />
91128 Palaiseau, France<br />
We present ultra-high vacuum (UHV) atomic force experiments performed on doped<br />
silicon nanocrystals fabricated by plasma enhanced chemical vapour deposition. The aim<br />
<strong>of</strong> this work is to study the doping properties and charge transfers from doped<br />
nanocrystals using UHV amplitude modulation Kelvin force microscopy (AM-KFM).<br />
The doping properties <strong>of</strong> hydrogen passivated nanocrystals are studied by monitoring the<br />
nanocrystal surface potential VS as a function <strong>of</strong> the nanocrystal and substrate doping,<br />
and also as a function <strong>of</strong> the nanocrystal size. The case <strong>of</strong> intrinsic nanocrystals is<br />
illustrated in Figure 1, in which the surface potential VS <strong>of</strong> the nanocrystals is plotted as a<br />
function <strong>of</strong> their height, showing - in average - positive or negative charge transfer from<br />
the p-doped and n-doped substrate, together with strong potential fluctuations attributed<br />
to the variation <strong>of</strong> the nanocrystal surface states. This situation is then compared to the<br />
case <strong>of</strong> n-doped nanocrystals, for which much lower potential fluctuations can be<br />
observed, and for which the nanocrystal surface potential VS is found almost independent<br />
<strong>of</strong> the doping level. These two effects are understood as stemming from the doping <strong>of</strong> the<br />
nanocrystal, which provides the necessary charge to compensate for the nanocrystal<br />
surface states, and induce a charge transfer to the substrate. The interpretation <strong>of</strong> the<br />
charge transfer equilibrium will be detailed quantitatively[1], using numerical simulations<br />
<strong>of</strong> the KFM signals taking into account capacitance averaging effects known to occur in<br />
KFM [2]. It will be shown that the charge transfer is enhanced due to the quantum<br />
confinement in nanocrystals with size
Open source scanning probe microscopy control and data analysis<br />
Percy Zahl 1<br />
s<strong>of</strong>tware package Gxsm.<br />
1 Brookhaven National Laboratory, Center for Functional Nanomaterials, Upton NY 11973, USA<br />
P.I-16<br />
Gxsm 1 is a full featured and modern scanning probe microscopy (SPM) s<strong>of</strong>tware. It can<br />
be used both in stand alone mode for powerful image processing and analysis and<br />
connected to an instrument operating many different flavors <strong>of</strong> SPM, e.g., scanning<br />
tunneling microscopy (STM) and atomic force microscopy (AFM) or in general twodimensional<br />
multi-channel data acquisition instruments. The Gxsm core can handle<br />
different data types, e.g., integer and floating point numbers. An easily extendable plugin<br />
architecture provides many image analysis and manipulation functions. A powerful<br />
digital signal processor (DSP) subsystem runs the feedback loop, does optional adaptive<br />
real-time signal filtering, generates the scanning signals and acquires all the data during<br />
SPM measurements. We will show lastest results and demonstrate the performance <strong>of</strong> the<br />
new SignalRanger Mark2 and Analog A810 now supported by GXSM. The<br />
programmable Gxsm vector probe engine (real-time, DSP based) performs virtually any<br />
thinkable spectroscopy and manipulation task, such as scanning tunneling spectroscopy<br />
(STS) or tip formation. The Gxsm s<strong>of</strong>tware is released under the GNU general public<br />
license (GPL) and can be obtained via the Internet.<br />
Visit and follow the Gxsm home page for further information:<br />
1 Homepage location: http://gxsm.sourceforge.net.<br />
107
2 nd generation Dynamic Nanostencil AFM/DFM/STM<br />
for in-situ (UHV) resistless patterning <strong>of</strong> nanostructures<br />
Percy Zahl 1 , Peter Sutter 1<br />
1 Brookhaven National Laboratory, Center for Functional Nanomaterials, Upton NY 11973, USA<br />
P.I-17<br />
The development and construction <strong>of</strong> the 2 nd generation Nanostencil, which will be an<br />
upgrade <strong>of</strong> the original and worldwide unique 1 st all-in-one Nanostencil as build at IBM<br />
Zurich Research Laboratory 1,2 . This Nanostencil instrument combines the shadow mask<br />
stencil method with an versatile scanning probe microscope and allows in-situ creation<br />
and inspection <strong>of</strong> even arbitrary single nanostructures down to 30nm as demonstrated at<br />
IBM.<br />
With the new design <strong>of</strong> the 2 nd generation Stencil a set <strong>of</strong> optimizations and partial<br />
redesigns will be incorporated. Nevertheless, this new CFN Nanostencil will be user<br />
accessible.<br />
The Nanostencil technique integrates a system for in-situ nano structuring and<br />
<strong>Atomic</strong>/Dynamic <strong>Force</strong> <strong>Microscopy</strong> (AFM/DFM) and Scanning Tunneling <strong>Microscopy</strong><br />
(STM) capability for in-situ structure analysis with atomic resolution capability but also<br />
wide (80µm for the 2 nd generation) scan range. In contrast to lithography methods, this is<br />
a direct writing or deposition method and no resist removal or etching steps are involved,<br />
allowing to make structures from any material which can be evaporated in UHV. Thus<br />
advanced sensitive or functional materials <strong>of</strong> an wide range (including metals, insulators,<br />
magnetic materials or even organic materials) can be used for patterning.<br />
The Scanning Probe <strong>Microscopy</strong> capabilities allow imaging and optional manipulation <strong>of</strong><br />
the deposited nanostructures/atoms and thus extends structure tune-ups down to the<br />
atomic scale.<br />
The 2 nd generation Nanostencil is currently in development at the CFN. It is expected to<br />
deliver similar or better stencil performance as the IBM-Stencil and will add more<br />
versality and a calibrated high precision scanning table with up to 80µm scan range. It<br />
will also provide a high resolution scanner (piezo tube style) for reaching atomic<br />
resolution. Optimized optical access for coarse alignments (Long Distance Microscope<br />
with 3µm resolution) while providing simultaneous access for deposition is planned.<br />
1<br />
All-in-one static and dynamic nanostencil atomic force microscopy/scanning tunneling microscopy<br />
system, P. Zahl, M. Bammerlin, G. Meyer and R.R. Schlittler, Rev. Sci. Instrum. 76, 0230707 (2005)<br />
2<br />
Fabrication <strong>of</strong> ultrathin magnetic structures by nanostencil lithography in dynamic mode, L. Gross, R.R.<br />
Schlittler, G. Meyer, A. Vanhaverbeke and R. Allenspach, Appl. Phys. Lett. 90, 093121 (2007)<br />
108
P.I-18<br />
Design <strong>of</strong> a Variable Temperature Variable Magnetic Field <strong>Noncontact</strong><br />
Scanning <strong>Force</strong> Microscope for the Characterization <strong>of</strong> Nanoscale<br />
Electronic and Magnetic Phenomena<br />
Peter Staffier 1 , Marcus Liebmann 1 , Jens Falter 1 , Nicolas Pilet 1 , Charles Ahn 2 , and Udo<br />
D. Schwarz 1<br />
1<br />
Department <strong>of</strong> Mechanical <strong>Engineering</strong> and Center for Research on Interface Structures and Phenomena<br />
(CRISP), <strong>Yale</strong> University, New Haven, USA<br />
2<br />
Department <strong>of</strong> Applied Physics and Center for Research on Interface Structures and Phenomena<br />
(CRISP), <strong>Yale</strong> University, New Haven, USA<br />
In thin film manganese oxides variations in the electric charge carrier density can result<br />
in increased conductivity, magnetic domain formation, and lattice distortions due to<br />
strong electron correlation effects. We intend to characterize the length scales at which<br />
the electronic, magnetic, and structural properties <strong>of</strong> thin films <strong>of</strong> La1-xSrxMnO3 remain<br />
correlated by using localized electrostatic fields to modulate the electric charge density<br />
while applying noncontact scanning force microscopy methods to observe the resulting<br />
phase changes. Since manganese oxides are most sensitive to electrostatic perturbation<br />
near their phase transition temperatures Tc, a critical part <strong>of</strong> the planned experiments will<br />
be to measure samples at various temperatures.<br />
For that purpose, we have developed a new ultrahigh vacuum variable temperature<br />
noncontact scanning force microscope (NC-AFM). The requirement to run experiments<br />
at distinct, stable temperatures shortly below and above Tc has been addressed by<br />
choosing a low vibration flow cryostat for cooling. Thermal gradients are minimized by<br />
cooling the entire microscope, in contrast to most commercially available variable<br />
temperature NC-AFMs. In addition, an electromagnet mounted to the vacuum system<br />
supplies magnetic fields up to 180 mT for in-field magnetic force measurements. A<br />
quartz microbalance and two evaporators allow for the preparation <strong>of</strong> multilayer<br />
magnetic force sensors in-situ. Both cantilever and sample stages permit the exchange <strong>of</strong><br />
force sensors and samples in-situ with the microscope at low temperatures. An x-y<br />
translation stage provides up to 4 mm × 4 mm <strong>of</strong> course motion in the horizontal plane so<br />
that we may measure at various positions on the sample. We will present the<br />
microscope’s design, initial measurements in topographical and magnetic operational<br />
modes, and details on some <strong>of</strong> the further planned experiments.<br />
109
An Active Q Control System in Scanning <strong>Force</strong> <strong>Microscopy</strong><br />
Jeehoon Kim 1 , Martin Zech 1 , and J. E. H<strong>of</strong>fman 1<br />
1 Department <strong>of</strong> Physics, Harvard University, Cambridge MA, USA<br />
P.I-19<br />
We have developed a high vacuum, cryogenic scanning force microscope with a fiber<br />
optic interferometer detection system. The microscope has several features: (1) flexibility<br />
to employ either a horizontal cantilever or a vertical cantilever; (2) rigidity <strong>of</strong> design to<br />
allow DC cantilever deflection detection as small as 1 picometer; (3) an x-y walker to<br />
position the tip above interesting features within a 3 mm × 3 mm area.<br />
We have also developed an active quality factor (Q) control system by employing a<br />
phase shifter using capacitive coupling. The active Q control system allows Q reduction<br />
by a factor <strong>of</strong> 60 without sacrificing signal to noise ratio. This active Q control system is<br />
essential for non-contact force microscopy with a vertical cantilever in order to increase<br />
both a force resolution and spatial resolution. The Q control system could also be used in<br />
either vertical or horizontal cantilever mode to increase scanning speed, or to employ<br />
amplitude modulation mode scanning in a vacuum or low temperature environment.<br />
a) b)<br />
Figure 1: (a) The home-built high vacuum, cryogenic magnetic force microscope and (b)<br />
Schematic <strong>of</strong> the active Q system, showing phase shifter and capacitive coupling.<br />
110
P.I-20<br />
Besocke style quartz tuning fork FM-AFM/STM for use in UHV and<br />
low temperatures<br />
Shawn M. Huston 1 , Rachel T. Port 1 , Katie M. Andrews 1 , and Thomas P. Pearl 1<br />
1 Department <strong>of</strong> Physics, North Carolina State University, Raleigh, USA<br />
The design and operation <strong>of</strong> a Besocke-style scanning probe microscope with both<br />
frequency modulated atomic force and scanning tunneling microscopy capabilities will be<br />
presented. This instrument has been optimized for use at low temperatures, either with<br />
helium or nitrogen cooling, in ultrahigh vacuum. FM-AFM is performed via a quartz<br />
crystal tuning fork in the qPlus sensor configuration. Cooling <strong>of</strong> the microscope is<br />
achieved through the use <strong>of</strong> a top-loaded bath cryostat that cools a pair <strong>of</strong> radiation<br />
shields which house the spring-suspended microscope assembly. This Besocke-style<br />
microscope is designed to record tunneling current and resonance frequency shift for a<br />
conductive tip mounted on the free prong <strong>of</strong> the tuning fork simultaneously Single<br />
molecule images <strong>of</strong> pentacene on Ag(111) at ~5 K recorded in both NC-AFM and STM<br />
modes will be pr<strong>of</strong>fered as a testament to the microscope’s effectiveness.<br />
111
P.I-21<br />
Design <strong>of</strong> a Low Temperature <strong>Noncontact</strong> <strong>Atomic</strong> <strong>Force</strong> Microscope<br />
Combined with a Field Ion Microscope<br />
J. Falter 1 , D.-A. Braun 1 , H. Hölscher 2 , U. D. Schwarz 3 , A. Schirmeisen 1 , and H. Fuchs 1<br />
1 CeNTech Center for Nanotechnology and Institute <strong>of</strong> Physics, University <strong>of</strong> Münster, Germany<br />
2 IMT, Forschungszentrum Karlsruhe, Germany<br />
3 Department <strong>of</strong> Mechanical <strong>Engineering</strong>, <strong>Yale</strong> University, New Haven, USA<br />
Non-contact atomic force microscopy has become a standard tool for imaging surfaces<br />
with atomic resolution. The underlying contrast mechanism is influenced by both<br />
interaction partners, the sample as well as the tip. Theoretical simulations <strong>of</strong> the force<br />
interaction allow a deeper insight in the contrast mechanisms but require information<br />
about the exact position <strong>of</strong> all atoms <strong>of</strong> sample and the tip. A method that is able to<br />
determine the configuration <strong>of</strong> the probing tip with atomic precision is the field ion<br />
microscope (FIM).<br />
We present a home-built low temperature ultra high vacuum (UHV) system that<br />
combines these two microscopy techniques. The design <strong>of</strong> the AFM has been proven to<br />
operate in UHV at low temperature and features a high mechanical stability [1]. The<br />
original design was modified to use piezoelectric tuning forks as force sensors, with a<br />
glued-on tungsten wire, prepared by the double lamella etching technique [2] (Figure 1a).<br />
For stable oscillation, the tuning fork is excited electronically [3] in the frequency<br />
modulation mode. Our force sensors have been successfully employed in the AFM as<br />
well as the FIM. Figure 1b shows a FIM image <strong>of</strong> a tuning fork tungsten tip allowing the<br />
atom-by-atom reconstruction <strong>of</strong> the tip apex demonstrated in Figure 1c.<br />
a) b) c)<br />
Figure 1: a) Image <strong>of</strong> the tuning fork force sensor with glued-on tungsten wire. b) FIM image <strong>of</strong><br />
a tuning fork tungsten tip, indicating the different crystallographic axis. A bright spot in the FIM<br />
image corresponds to a tip apex atom. c) Atom-by-atom reconstruction <strong>of</strong> the whole tip apex.<br />
[1] B. Albers et al, Rev. Sci. Instrum. 79 033704 (2008).<br />
[2] M. Kulawik et al, Rev. Sci. Instrum. 74, 1027 (2002)<br />
[3] J. Jersch et al, Rev. Sci. Instrum. 77, 083701 (2006)<br />
112
P.I-22<br />
A homebuilt low-temperature STM / tuning fork AFM combination<br />
Manfred Lange 1 , Johannes Schaffert 1 , Nikolai Wintjes 1 and Rolf Möller 1<br />
1 Department <strong>of</strong> Physics, University <strong>of</strong> Duisburg-Essen, Germany<br />
We present details on a homebuilt, compact scanning probe microscope (Fig. 1) which<br />
can be switched between tuning fork AFM and STM operation without breaking vacuum.<br />
The geometry <strong>of</strong> the microscope resembles a cylinder with a height <strong>of</strong> only 15 cm and a<br />
diameter <strong>of</strong> 4 cm. It is attached to a commercially available continuous flow cryostat<br />
which allows cooling to about 5-7 K. Because <strong>of</strong> the very compact design, low helium<br />
consumption <strong>of</strong> only 1 liter/hour is achieved. Drift rates in lateral direction are
Development <strong>of</strong> quartz force sensors for noncontact atomic force<br />
microscopy/spectroscopy<br />
Kenichirou Hori 1 , Toyoko Arai 1 and Masahiko Tomitori 2<br />
(a) (b)<br />
Amplitude[nm]<br />
Flexural oscillation amplitude and phase<br />
450<br />
400<br />
350<br />
300<br />
250<br />
200<br />
150<br />
100<br />
50<br />
0<br />
Amplitude[nm]<br />
Phase[degree]<br />
5370 5380 5390 5400 5410 5420 5430<br />
Frequency[Hz]<br />
P.I-23<br />
1 Graduate <strong>School</strong> <strong>of</strong> Natural science & Technology, Kanazawa University, Kanazawa, Ishikawa, Japan<br />
2 <strong>School</strong> <strong>of</strong> Materials Science, Japan Advanced Institute <strong>of</strong> Science and Technology, Nomi, Ishikawa Japan<br />
In order to extend the application <strong>of</strong> noncontact atomic force microscopy (nc-AFM),<br />
force sensors have still held the key to supplement the functions <strong>of</strong> nc-AFM, in particular,<br />
for force spectroscopy. For example, bias-voltage noncontact atomic force spectroscopy<br />
(nc-AFS) [1] developed on the basis <strong>of</strong> nc-AFM, invokes probes suitable to electric<br />
conductance measurements with high force sensitivity to characterize the relationship<br />
between binding state and electronic state. One possibility is to use quartz, one <strong>of</strong><br />
piezoelectric materials with a high Q, e.g., successfully demonstrated by Giessibl [2], on<br />
which a metal or a Si needle is attached as a probe. Though a Si probe seems suitable to<br />
examine the relationship between electronic states and chemical bonding force for Si<br />
samples from point contact to non-contact through pseudo-contact regime, a metallic<br />
needle sounds as a good conductor tip. The tip material is also desired to be easily<br />
exchangeable. Moreover, the reduction <strong>of</strong> cantilever oscillation amplitude takes<br />
advantage for conductance measurement [3], which were also realized using quartz force<br />
sensors. Here we report the development <strong>of</strong> a quartz force sensor using lithographic<br />
techniques from a quartz wafer, which has electrodes suitable to simultaneous<br />
conductance measurement with high sensitivity <strong>of</strong> force at a small oscillation amplitude<br />
with feasibility <strong>of</strong> probe material change.<br />
We fabricated a quartz sensor with gold-plated multi-electrodes, one <strong>of</strong> which is to<br />
fix the potential <strong>of</strong> a probe for conductance measurement. Figure 1 shows a schematic <strong>of</strong><br />
the sensor and mechanical characteristics <strong>of</strong> a flexure mode in air near its resonance<br />
frequency measured using a heterodyne optical interferometer. This sensor exhibits a<br />
longitudinal mode as well,<br />
analyzed them by a finite<br />
element method. To avoid Q<br />
degradation, bonding <strong>of</strong> Si tip<br />
onto quartz without adhesive<br />
agent is adopted.<br />
[1] T. Arai and M. Tomitori: Phys.<br />
Rev. B 73 (2006) 073307.<br />
[2] F.J. Giessibl: Appl. Phys. Lett. 76<br />
(2000) 1470.<br />
[3] T. Arai and M. Tomitori: Jpn. J.<br />
Appl. Phys. 39 (2000) 3753.<br />
100<br />
80<br />
60<br />
40<br />
20<br />
0<br />
-20<br />
-40<br />
-60<br />
-80<br />
-100<br />
Fig.1(a) Schematic <strong>of</strong> a fabricated sensor. (b) Resonance<br />
curves <strong>of</strong> the flexural mode <strong>of</strong> the sensor without a probe.<br />
114<br />
Phase[degree]
P.I-24<br />
High-Speed Frequency Modulation <strong>Atomic</strong> <strong>Force</strong> <strong>Microscopy</strong> using<br />
Wideband Digital Phase-Locked Loop Detector<br />
Takeshi Fukuma 1,2 and Yuji Mitani 1<br />
1 Frontier Science Organization, Kanazawa University, Kanazawa, Japan<br />
2 PRESTO, Japan Science and Technology Agency, Kawaguchi, Japan<br />
Recent advancement in the instrumentation <strong>of</strong> frequency modulation atomic force<br />
microscopy (FM-AFM) has enabled to operate FM-AFM in liquid with true atomic<br />
resolution. To date, liquid-environment FM-AFM has been used for several biological<br />
applications, which has demonstrated its excellent force sensitivity and high spatial<br />
resolution. However, unlike applications in vacuum, biological applications require highspeed<br />
operation <strong>of</strong> FM-AFM due to the mobile nature, high complexity and large<br />
dimension <strong>of</strong> biological systems. In this study, we develop a high-speed FM-AFM using<br />
FPGA-based digital signal processing circuit in order to improve the applicability <strong>of</strong> this<br />
method to practical biological studies.<br />
Development <strong>of</strong> high-speed FM-AFM requires enhancing the bandwidth and resonance<br />
frequencies <strong>of</strong> all the components involved in the tip-sample distance feedback loop. In<br />
particular, a frequency detector has been one <strong>of</strong> the major speed limiting factors in the<br />
feedback loop. A conventional frequency detector using a digital phase-locked loop<br />
(PLL) typically utilizes multiplication-based phase comparator, which has limited its<br />
bandwidth to less than 10 kHz. In this study, we have developed a wideband digital PLL<br />
using a subtraction-based phase comparator (Fig. 1(a)). The developed PLL detector has<br />
a bandwidth <strong>of</strong> wider than 1 MHz (Fig. 1(b)). A high-speed FPGA circuit has been used<br />
for implementing the PLL as well as the cantilever excitation circuit, the distance and<br />
amplitude feedback control circuits. Combined with our recently developed high-speed<br />
scanner and wideband photo-thermal excitation system, we aim at high-speed operation<br />
<strong>of</strong> FM-AFM in liquid.<br />
Figure 1: (a) Block diagram and (b) frequency response <strong>of</strong> the developed PLL using a<br />
subtraction-based phase comparator (fc : cut<strong>of</strong>f frequency <strong>of</strong> a low-pass filter at the output).<br />
115
Recent Advances in Multi-Spectral <strong>Atomic</strong> <strong>Force</strong> <strong>Microscopy</strong><br />
S. Jesse, N. Balke, P. Maksymovych, O. Ovchinnikov, A.P. Baddorf, S.V. Kalinin<br />
Oak Ridge National Laboratory, Oak Ridge, TN 37831<br />
P.I-25<br />
Piezoresponse force microscopy has become the primary method for the<br />
characterization <strong>of</strong> electromechanical activity on the nanometer scale. The recent<br />
introduction <strong>of</strong> the band excitation mode has allowed resonance enhancement in PFM<br />
through the detection <strong>of</strong> amplitude-frequency curve at each pixel. Similarly, switching<br />
spectroscopy PFM has allowed measurements <strong>of</strong> polarization dynamics. Both these<br />
techniques give rise to 3D data arrays. Combining both techniques into BE SSPFM yields<br />
4D data, while implementation <strong>of</strong> first order reversal curve measurements yields 5D data<br />
sets. In the absence <strong>of</strong> exact and reliable analytical models, data analysis <strong>of</strong> high<br />
dimensional data sets to elucidate relevant aspects <strong>of</strong> materials behavior and link them to<br />
theory represents a complex problem.<br />
Here we discuss an approach for the analysis <strong>of</strong> multi-dimensional, spectroscopicimaging<br />
data based on principal component analysis (PCA) coupled with neural network<br />
recognition algorithms. PCA selects and ranks relevant response components based on<br />
variance within the data. It is shown that for examples with small relative variations<br />
between spectra, the first few PCA components coincide with results obtained using<br />
model fitting, and achieves this at rates approximately 4 orders <strong>of</strong> magnitude faster. For<br />
cases with strong response variations, PCA allows an effective approach to rapidly<br />
process, de-noise, and compress data. The combination <strong>of</strong> PCA with correlation analysis<br />
is demonstrated as a means to delineate the principal components containing information<br />
from those dominated by noise. In ferroelectric data, PCA allows for the selection <strong>of</strong><br />
minute effects related to polarization orientation changes during switching. Here, the<br />
PCA based approach is used to study domain wall dynamics in ferroelectric and<br />
multiferroic materials and polarization behavior in ferroelectric capacitors and relaxors.<br />
Further prospects for other multidimensional SPM methods are discussed.<br />
Research was supported by the U.S. Department <strong>of</strong> Energy Office <strong>of</strong> Basic<br />
Energy Sciences Division <strong>of</strong> Scientific User Instruments and was performed at Oak<br />
Ridge National Laboratory which is operated by UT-Battelle, LLC.<br />
Figure 1: The first 4 PCA components <strong>of</strong> band excitation magnetic force microscopy image <strong>of</strong><br />
yttrium-iron garnet (data acquired in collaboration with R. Proksch, Asylum Research). PCA is<br />
able to decompose the data into 2 conservative, 1 background, and 1 dissipation component.<br />
116
P.I-26<br />
Deciphering Nanoscale Interactions: Artificial Neural Networks and<br />
Scanning Probe <strong>Microscopy</strong><br />
Maxim Nikiforov, Stephen Jesse, Oleg Ovchinnikov, and Sergei V. Kalinin<br />
Oak Ridge National Laboratory, Oak Ridge, TN 37831<br />
Scanning Probe <strong>Microscopy</strong> techniques provide a wealth <strong>of</strong> information on<br />
nanoscale interactions. The rapid emergence <strong>of</strong> spectroscopic imaging techniques in<br />
which the response to local force, bias, or temperature is measured at each spatial<br />
location necessitates the development <strong>of</strong> data interpretation and visualization techniques<br />
for 3- or higher dimensional data sets.<br />
In this presentation, we summarize recent advances in the application <strong>of</strong> neural<br />
network based artificial intelligence methods to scanning probe microscopy. The<br />
examples will include biological identification based on the dynamics <strong>of</strong> the<br />
electromechanical response, direct mapping <strong>of</strong> dynamic disorder in ferroelectric relaxors,<br />
and reconstruction <strong>of</strong> random bond-random field Ising model parameters in ferroelectric<br />
capacitors. The future prospects for smart, multispectral SPMs are discussed.<br />
Research was supported by the U.S. Department <strong>of</strong> Energy Office <strong>of</strong> Basic<br />
Energy Sciences Division <strong>of</strong> Scientific User Facilities and was performed at Oak Ridge<br />
National Laboratory which is operated by UT-Battelle, LLC.<br />
Figure 1: Results <strong>of</strong> neural network identification <strong>of</strong> bacteria (M. Lysodeikticus (red), P.<br />
Fluorescens (green)) are overlaid on the topographic image. Training area for neural network is<br />
outlined by black rectangle (in collaboration with A. Vertegel and V. Reukov, Clemson<br />
University).<br />
117
P.I-27<br />
NC-AFM study <strong>of</strong> a cleaved InAs (110) surface using modified Si probes<br />
under ambient atmospheric pressure<br />
Yonkil Jeong 1,2 , Masato Hirade 2,3 , Ryohei Kokawa 2,3 , Hir<strong>of</strong>umi Yamada 2,4 ,<br />
Kei Kobayashi 2,4 , Noriaki Oyabu 2,4 , Hiroshi Yamatani 2,5 , Toyoko Arai 2,5 ,<br />
Akira Sasahara 1,2 , and Masahiko Tomitori 1,2,*<br />
1 <strong>School</strong> <strong>of</strong> Materials Science, Japan Advanced Institute <strong>of</strong> Science and Technology, Ishikawa, Japan,<br />
2 JST Advanced Measurement and Analysis, 3 Shimadzu Corp., Kyoto, Japan,<br />
4 Kyoto University, Kyoto, Japan, 5 Kanazawa University, Ishikawa, Japan<br />
Characterization <strong>of</strong> crystalline defects in thin films with interfaces <strong>of</strong> lattice-mismatched<br />
III-V compound semiconductors such as GaAs and InP is an important issue for practical<br />
device application. We pursue a simple and quick method to characterize them on an<br />
atomic scale using NC-AFM by cleaving devices in a controlled environment without a<br />
UHV system. In this work, we demonstrate the possibilities <strong>of</strong> high-resolution imaging <strong>of</strong><br />
a cleaved InAs (110) surface using the NC-AFM under atmospheric pressure <strong>of</strong> air or<br />
pure Ar, and <strong>of</strong> acquiring charge state information with specially fabricated probes,<br />
which are designed to emphasize electronic interaction between the tip and the sample.<br />
High aspect ratio (HAR) Si and Ge/Si probes were fabricated from commercial<br />
AFM Si probes by an FIB and a Ge deposition system. Fig. 1(a) shows the changes in ? f<br />
due to the reduction <strong>of</strong> capacitance between probes and a sample. A high resolution<br />
image with a periodic structure was successfully obtained with a fabricated probe, in Fig.<br />
1(c); possibly residual H2O molecules were adsorbed on a cleaved InAs (110) surface.<br />
(a (b<br />
Δf = -43Hz, A = 0.4nm<br />
Figure 1: (a) Bias-Δf curves between probes and a sample surface. (b) SEM images <strong>of</strong><br />
FIB fabricated probes. (c) NC-AFM image <strong>of</strong> a cleaved InAs (110) with HAR-Si in Ar.<br />
*corresponding author e-mail: tomitori@jaist.ac.jp<br />
118<br />
(c)
Dual-Frequency-Modulation AFM Spectroscopy<br />
Gaurav Chawla, C. Alan Wright, and Santiago D. Solares<br />
Department <strong>of</strong> Mechanical <strong>Engineering</strong>, University <strong>of</strong> Maryland at College Park, USA<br />
P.I-28<br />
<strong>Force</strong> spectroscopy is an important application <strong>of</strong> atomic force microscopy (AFM),<br />
whereby tip-sample interaction forces are measured with probes <strong>of</strong> varying geometry and<br />
chemistry. Most methods rely on measuring either the instantaneous cantilever deflection<br />
in static mode or the frequency shift in low-amplitude frequency-modulation mode. In<br />
the first case the force is calculated directly from the cantilever deflection. In the second<br />
case the frequency shift is used to compute the tip-sample force gradient, from which the<br />
tip-sample force curve can be reconstructed after scanning a region for which a boundary<br />
condition is known. In both cases, acquiring a 3D representation <strong>of</strong> the tip-sample forces<br />
requires fine-grid scanning <strong>of</strong> a volume above the surface. Using computational<br />
simulations, we have developed a dual-frequency-modulation AFM spectroscopy method<br />
[1,2] in which the cantilever is simultaneously excited at the fundamental frequency and<br />
at a higher-order eigenfrequency (with a much smaller amplitude), such that<br />
topographical imaging is performed using the fundamental frequency response and force<br />
spectroscopy is performed using the higher-order response. Our results suggest that this<br />
method could enable measurement <strong>of</strong> the 3D tip-sample forces above the surface with a<br />
single 2D scan. The procedure was originally developed for ambient air, but has been<br />
extended to vacuum conditions, where we are evaluating the 3D imaging <strong>of</strong> atomic<br />
orbitals by integrating quantum mechanics and cantilever dynamics calculations. We are<br />
especially interested in the effect <strong>of</strong> tip apex geometry on the ability to image sub-atomic<br />
features. The method’s experimental implementation in air is in progress.<br />
1.85<br />
a b<br />
Dual-frequency tip response<br />
ν 1 band<br />
ν 2 band<br />
imaging<br />
spectroscopy<br />
Effective frequency, MHz<br />
1.75<br />
1.65<br />
1.55<br />
1.45<br />
0 20 40 60 80 100<br />
Time, ms<br />
Tip approach<br />
Tip retract<br />
Figure 1: (a) Illustration <strong>of</strong> the dual-frequency-modulation AFM concept, where the cantilever<br />
vibrates at two eigenfrequencies such that the fundamental response is used to perform imaging<br />
and the high-frequency response is used to perform force spectroscopy; (b) illustration <strong>of</strong> the<br />
instantaneous frequency <strong>of</strong> the self-excited high-frequency response for one full oscillation <strong>of</strong> the<br />
low-frequency response, under positive frequency shift for the fundamental frequency. Since the<br />
frequency shift follows the tip-sample force gradient, it is in principle possible under ideal<br />
conditions to extract the tip-sample force curve every low-frequency oscillation.<br />
[1] G. Chawla and Solares, S.D., Measurement Science and Technology 20, No. 015501 (2009).<br />
[2] S.D. Solares and G. Chawla, Measurement Science and Technology 19, No. 055502 (2008).<br />
119
Theory <strong>of</strong> Multifrequency Method in FM-AFM<br />
Zongmin Ma, Yoshitaka Naitoh, Yanjun Li, Masami Kageshima<br />
and Yasuhiro Sugawara<br />
Department <strong>of</strong> Applied Physics, Graduate <strong>School</strong> <strong>of</strong> <strong>Engineering</strong>, Osaka University, 2-1 Yamada-oka,<br />
Suita, Osaka 565-0871, Japan<br />
P.I-29<br />
FM-AFM has been succeeded in measuring topography and energy dissipation<br />
with atomic resolution on the surface. Furthermore, force spectroscopy is<br />
demonstrated to identify the atomic species. The elasticity information <strong>of</strong> the surface<br />
is important physical information <strong>of</strong> the sample materials. Actually, it has been<br />
measured by using multifrequency method in AM-AFM recently, which was proposed<br />
by Rodriguez and Garcia and successfully demonstrated its usefulness theoretically<br />
and experimentally [1-2].<br />
In this paper, for the first time, we<br />
proposed usage <strong>of</strong> the multifrequency<br />
f 2<br />
BPF PLL Δf 2<br />
method in FM-AFM to measure the<br />
AGC<br />
sample properties such as elasticity.<br />
Figure 1 shows the block diagram <strong>of</strong><br />
×<br />
multifrequency method in FM-AFM.<br />
f 1<br />
BPF PLL<br />
The cantilever is excited simultaneously<br />
at the first and the second resonances.<br />
Band pass filters (BPFs) are used to<br />
separate the vibration signals <strong>of</strong> the<br />
Optical<br />
interferometer<br />
+<br />
+<br />
AGC<br />
×<br />
cantilever. For each signal, the cantilever<br />
Cantilever<br />
Δf 1<br />
is vibrated by self-oscillation at the first<br />
Feedback<br />
and the second resonances. Topography<br />
Tube Scanner<br />
Topography<br />
<strong>of</strong> the sample is obtained by the<br />
feedback signal to keep the frequency<br />
Figure 1. Block diagram <strong>of</strong> multifrequency<br />
shift (△ f1) constant. The elasticity information <strong>of</strong> the sample surface is measured by<br />
frequency shift (△ f2) <strong>of</strong> the second resonance, which is proportional to the<br />
conservative force between tip and sample. Here, we show the theory for the<br />
multifrequency method in FM-AFM.<br />
[1] Rodriguez and R. Garcia, Appl. Phys. Lett. 84, 449 (2004).<br />
[2] Jose R. Lozano and Ricardo Garcia. Phy Rev B 79, 014110 (2009).<br />
120
P.I-30<br />
Internal Resonances and Spatio-Temporal Instabilities in Nonlinear<br />
Multi-mode NC-AFM Dynamics<br />
Oded Gottlieb, Sharon Hornstein, Wei Wu and Arthur Shavit<br />
Department <strong>of</strong> Mechanical <strong>Engineering</strong>, Technion - Israel Institute <strong>of</strong> Technology, Haifa, Israel<br />
The use <strong>of</strong> multi-mode excitation in atomic force microscopy has been proposed and<br />
validated in the past decade. Examples include the combined excitation <strong>of</strong> the first two<br />
bending modes where the latter has been found to be sensitive to low surface force<br />
variations [1], and excitation <strong>of</strong> a third bending mode in the vicinity <strong>of</strong> a torsion mode to<br />
map nanomechanical changes <strong>of</strong> a polymer near its glass transition [2]. While small<br />
amplitude excitation results in a single-valued frequency response, finite amplitude<br />
dynamics can yield nonlinear coexisting bi-stable solutions and complex aperiodic<br />
dynamics that reveal nonstationary energy transfer between multiple spatial modes. The<br />
accuracy <strong>of</strong> force estimation from measured data crucially depends on the quality <strong>of</strong> the<br />
mathematical model in use. Thus, as lumped mass models cannot describe multi-mode<br />
dynamics, a continuum mechanics description is required to consistently incorporate<br />
nonlinear atomic interaction and coupled elastic and internal damping forces that govern<br />
noncontact operation in ultrahigh vacuum. Thus, the objectives <strong>of</strong> this paper include<br />
theoretical derivation and analysis <strong>of</strong> a continuum spatio-temporal model for the<br />
vibrating NC-AFM cantilever that consistently incorporates both nonlinear atomic<br />
interaction and coupled thermo-visco-elastic damping. We derive a nonlinear initialboundary-value<br />
problem using the extended Hamilton's principle [3] for the coupled<br />
viscoelastic and temperature fields for torsion, transverse and out-<strong>of</strong>-plane bending. The<br />
continuum system is then reduced via a Galerkin procedure to a multi-mode dynamical<br />
system which is analyzed numerically. System response reveals that the dynamic jumpto-contact<br />
bifurcation threshold is not sensitive to the damping level but includes lengthy<br />
chaotic transients for low damping. Furthermore, both subharmonic and quasiperioic<br />
solutions are found when combination and internal resonances are excited. The latter<br />
reveal energy transfer between the 3rd and 2ond microbeam modes due to a strong 3:1<br />
internal resonance [Fig.1] and complex chaotic like spatio-temporal instabilities when<br />
this internal resonance is coupled with either its out-<strong>of</strong>-plane or torsion resonances.<br />
Figure 1: Quasiperiodic dynamics <strong>of</strong> a 3:1 internal resonance between the 3 rd and 2 nd bending<br />
modes in UHV: time series (left), power spectra(center), and Poincare' map (right).<br />
[1] T.R. Rodriguez and R. Garcia, APL, 83, 449 (2004).<br />
[2] O. Sahin et al. Nature Nanotechnology 2, 507 (2007).<br />
[3] S. Hornstein and O. Gottlieb, Nonlinear Dynamics 54, 93 (2008).<br />
121
P.I-31<br />
Frequency Noise in Frequency Modulation <strong>Atomic</strong> <strong>Force</strong> <strong>Microscopy</strong><br />
Kei Kobayashi 1 , Hir<strong>of</strong>umi Yamada 2 , and Kazumi Matsushige 2<br />
1 Innovative Collaboration Center, Kyoto University, Kyoto, Japan.<br />
2 Department <strong>of</strong> Electronic Science and <strong>Engineering</strong>, Kyoto University, Kyoto, Japan.<br />
<strong>Atomic</strong> force microscopy (AFM) using the frequency modulation (FM) detection method<br />
has been widely used for atomic/molecular-scale investigations <strong>of</strong> various materials.<br />
Recently, it has been shown that high-resolution imaging in liquids by the FM-AFM is<br />
also possible by reducing the noise-equivalent displacement in the cantilever<br />
displacement sensor and by oscillating the cantilever at a small amplitude, even with the<br />
extremely reduced Q-factor due to the hydrodynamic interaction between the cantilever<br />
and the liquid. However, it has not been clarified how the noise reduction <strong>of</strong> the<br />
displacement sensor contributes to the reduction <strong>of</strong> the frequency noise in the FM-AFM<br />
in low-Q environments. In this presentation, the contribution <strong>of</strong> the displacement sensor<br />
noise to the frequency noise in the FM-AFM is analyzed in detail to show how it is<br />
important to reduce the noise-equivalent displacement in the displacement sensor<br />
especially in low-Q environments.<br />
As a general equation for the frequency noise density <strong>of</strong> the oscillator, we have to<br />
consider the contribution <strong>of</strong> the displacement sensor noise to the oscillator noise in<br />
addition to the frequency noise <strong>of</strong> the high-Q cantilevers,<br />
where N ds is the noise-equivalent displacement sensor noise density.<br />
Figure 1: Schematics <strong>of</strong> the evolution <strong>of</strong> the displacement noise into the frequency noise without<br />
and with the displacement sensor noise. The displacement noise spectrum <strong>of</strong> the cantilever around<br />
the resonance frequency without the displacement sensor noise (a) and the corresponding<br />
oscillator frequency noise (b). The total frequency noise considering the measurement noise<br />
(dotted area in (b)) becomes constant as shown in (c). If there is non-zero displacement sensor<br />
noise, it brings additional oscillator frequency noise and measurement noise as shown in (d).<br />
Dark gray and black areas represent two levels (small and large) <strong>of</strong> additional displacement<br />
sensor noise.<br />
[1] K. Kobayashi, H. Yamada, and K. Matsushige, Rev. Sci. Instrum. accepted for publication (2009).<br />
122<br />
,
Relation between lateral forces and dissipation in FM-AFM<br />
Michael Klocke, Dietrich E. Wolf<br />
Department <strong>of</strong> Physics, University <strong>of</strong> Duisburg-Essen, Germany.<br />
P.I-32<br />
We study the coupling <strong>of</strong> torsional and normal cantilever oscillations and their effect on<br />
the imaging process <strong>of</strong> a frequency-modulated atomic force microscope by means <strong>of</strong><br />
molecular dynamics simulations. We show that the bending and torsional modes <strong>of</strong> the<br />
cantilever are coupled if the tip is near the surface and connect this coupling to the<br />
damping <strong>of</strong> the cantilever oscillation. The strength <strong>of</strong> the coupling is determined roughly<br />
by the strength <strong>of</strong> the lateral forces on the closest approach <strong>of</strong> the tip. Energy is<br />
transferred from the normal to the torsional excitation which can be detected as damping<br />
<strong>of</strong> the cantilever oscillation. Energy is actually dissipated by the usually uncontrolled<br />
mechanical damping <strong>of</strong> the torsional excitation. For high Q factors, the transferred energy<br />
is not completely dissipated during one cycle. The question, what happens to the<br />
remaining energy <strong>of</strong> the lateral degree <strong>of</strong> freedom in the long run, is addressed by<br />
studying a simplified two-dimensional point-mass model. We show that in succeeding<br />
cycles, energy is transferred back into the normal degree <strong>of</strong> freedom. The observation <strong>of</strong><br />
the energy swapping process (amplitude and frequency) can therefore give additional<br />
information <strong>of</strong> the surface structure, especially on lateral forces.<br />
123
P.I-33<br />
Experimental Study <strong>of</strong> Dissipation Mechanisms in AFM Cantilevers<br />
Fredy Zypman<br />
Department <strong>of</strong> Physics, Yeshiva University, New York, USA.<br />
The presence <strong>of</strong> energy dissipation in an oscillating AFM cantilever is a fact that must be<br />
included in any force reconstruction algorithm. Although commonly low quality factor<br />
(Q) cantilevers get on the way <strong>of</strong> high accuracy non-contact measurements, some times<br />
they can be used purposely. A case in point is the study <strong>of</strong> the measurement <strong>of</strong> fluids<br />
viscosity by monitoring changes in Q [1]. In this work we study theoretically the<br />
mechanisms <strong>of</strong> energy dissipation in AFM, and validate the corresponding models<br />
experimentally. This understanding <strong>of</strong> the origins <strong>of</strong> energy dissipation is not only<br />
interesting for its own sake, but it is also relevant with an eye on practical applications.<br />
We have done extensive work on cantilevers <strong>of</strong> various shapes but, to fix ideas we<br />
consider a rectangular cantilever in this abstract. In that case, the beam model is<br />
commonly used to obtain the corresponding frequency spectrum via the steady state<br />
4<br />
2<br />
EI ∂ u(<br />
x,<br />
t)<br />
∂ u(<br />
x,<br />
t)<br />
solution <strong>of</strong> + = 0 , where u( x,<br />
t)<br />
is the deflection <strong>of</strong> the cantilever<br />
4<br />
2<br />
Aρ<br />
∂x<br />
∂t<br />
at location x and time t , E is the Young's modulus, I the cross sectional moment <strong>of</strong><br />
inertia, A the cross sectional area, and ρ the mass density. In the beam model, a<br />
∂u dissipation term proportional to is usually introduced. The proportionality factor is a<br />
∂t<br />
difficult problem in itself that involves the interaction <strong>of</strong> the cantilever with the<br />
surrounding fluid [2]. The complete equation describes quite well the central frequency<br />
and width <strong>of</strong> multiple peaks. However, a detailed analysis shows that the peak shape is<br />
not in full agreement with experiment if fine details are included. We will show that this<br />
is improved by introducing explicit dissipation terms based on basic physical principles<br />
that represent cantilever-fluid interaction and internal viscoelasticity. The model is<br />
solved and compared with experimental data obtained on a Veeco AFM. We will also<br />
argue that this improvement is necessary to produce reconstruction algorithms consistent<br />
with the resolutions necessary today to measure objects at the subnanometer scale, like<br />
charges in biological molecules.<br />
[1] A. Schilowitz, D. Yablon, E. Lansey, and F. Zypman, Measurement 41, 1169 (2008).<br />
[2] J.E. Sader, J. Appl. Phys. 84, 64 (1998)<br />
124
M. Teresa Cuberes<br />
Ultrasonic Nanolithography on Hard Substrates<br />
Laboratory <strong>of</strong> Nanotechnology, University <strong>of</strong> Castilla-La Mancha, Almadén, Spain.<br />
P.I-34<br />
Ultrasonic- AFM techniques provide a means to monitor ultrasonic vibration at the<br />
nanoscale and open up novel opportunities to improve nan<strong>of</strong>abrication technologies [1].<br />
Ultrasonic <strong>Force</strong> <strong>Microscopy</strong> (UFM) relies on the mechanical-diode cantilever response<br />
when ultrasonic vibration is excited at the tip-sample contact [2]. Strictly, UFM is a<br />
dynamic AFM (<strong>Atomic</strong> <strong>Force</strong> <strong>Microscopy</strong>) implementation in which the tip-sample<br />
contact is periodically broken at ultrasonic frequencies. In the presence <strong>of</strong> ultrasonic<br />
vibration, the tip <strong>of</strong> a s<strong>of</strong>t cantilever can dynamically indent hard samples due to its<br />
inertia. Fig. 1 (a) demonstrates scratching <strong>of</strong> a silicon sample in the presence <strong>of</strong> ultrasonic<br />
vibration, using a cantilever with nominal stiffness <strong>of</strong> 0.11 Nm -1 and a SiN tip. In the<br />
absence <strong>of</strong> ultrasound, it was not possible to scratch the Si surface using such a s<strong>of</strong>t<br />
cantilever. Interestingly, no debris is found in the proximity <strong>of</strong> lithographed areas.<br />
Fig. 1 (b) displays ultrasonic curves -UFM response for increasing ultrasonic<br />
excitation amplitude- recorded during UFM imaging (curve (a)) and during scratching <strong>of</strong><br />
silicon (curves c-d). UFM imaging is carried out without substrate modification by using<br />
a lower tip-sample load. When increasing the load, the silicon substrate is scratched<br />
provided a sufficiently high ultrasonic amplitude is excited. By monitoring the ultrasonicinduced<br />
cantilever responses during manipulation, information about the substrate<br />
modification can be obtained. As the substrate is being scratched, the UFM responses<br />
change. Apparently, for a fixed load, a critical ultrasonic amplitude is needed to induce<br />
modification (see Fig 1 (b)). In the poster, the advantages <strong>of</strong> ultrasonic nanolithography,<br />
and the shape <strong>of</strong> UFM curves recorded during manipulation will be discussed in detail.<br />
a) b)<br />
Figure 1. AFM scratching <strong>of</strong> Si(111) in the presence <strong>of</strong> normal surface ultrasonic vibration <strong>of</strong> ~<br />
5 MHz using a pyramidal SiN cantilever tip with nominal stiffness 0.11 Nm -1 (a) Nanotrenches<br />
formed in 50, 70 and 100 cycles respectively, at a load <strong>of</strong> ~ 40 nN and maximum ultrasonic<br />
amplitude Am = 500 mV (b) UFM response for a triangular modulation <strong>of</strong> the ultrasonic<br />
excitation (see lowest curve). Load: (i) ~ 26 nN. (ii-iv) ~ 40 nN. Am=500 mV.<br />
[1] M. T. Cuberes, J. <strong>of</strong> Phys.: Conf. Ser. 61 (2007) 219.<br />
[2] M. T. Cuberes in “Applied Scanning Probe Methods”, B. Bhushan and H. Fuchs (ed.), Springer 2009.<br />
125
P.I-35<br />
Silicon nanowire transistors with a channel width <strong>of</strong> 4 nm fabricated by<br />
atomic force microscope nanolithography<br />
Javier Martinez, Ramses V. Martinez, and Ricardo Garcia<br />
Instituto de Microelectronica deMadrid - CSIC, Isaac Newton 8, 28760 Tres Cantos, Madrid, Spain<br />
The emergence <strong>of</strong> an ultrasensitive sensor technology based on silicon nanowires<br />
requires both the fabrication <strong>of</strong> nanoscale diameter wires and the integration with<br />
microelectronic processes [1]. Here we demonstrate an atomic force microscopy<br />
lithography that enables the reproducible fabrication <strong>of</strong> complex single-crystalline silicon<br />
nanowire field-effect transistors with a high electrical performance. The nanowires have<br />
been carved from a silicon-on-insulator wafer by a combination <strong>of</strong> local oxidation<br />
processes [2] with a force microscope and etching steps. We have fabricated and<br />
measured the electrical properties <strong>of</strong> a silicon nanowire transistor with a channel width <strong>of</strong><br />
4 nm. The flexibility <strong>of</strong> the nan<strong>of</strong>abrication process is illustrated by showing the<br />
electrical performance <strong>of</strong> two nanowire circuits with different geometries [3]. The<br />
fabrication method is compatible with standard Si CMOS processing technologies and,<br />
therefore, can be used to develop a wide range <strong>of</strong> architectures and new microelectronic<br />
devices.<br />
(a) (b)<br />
1 µm<br />
Figure 1: (a) AFM image <strong>of</strong> a silicon nanowire transistor that combines linear and circular<br />
regions and (b) output characteristics <strong>of</strong> the silicon nanowire transistor.<br />
[1] Y. Ciu, C. M. Lieber. Science 291, 851 (2001).<br />
[2] R. Garcia, R. V. Martinez, J. Martinez. Chemical Society Reviews 35, 29. (2006).<br />
[3] J. Martinez, R. V. Martinez, R. Garcia. Nano Letters 8, 3636, (2008).<br />
Contact author: Ricardo García, rgarcia@imm.cnm.csic.es<br />
126
Contacting self-ordered molecular wires by<br />
nanostencil lithography<br />
L. Gross, R.R. Schlittler, and G. Meyer<br />
IBM Research, Zurich Research Laboratory, 8803 Rüschlikon, Switzerland<br />
Th. Glatzel, S. Kawai, S. Koch, and E. Meyer<br />
Department <strong>of</strong> Physics, University <strong>of</strong> Basel, 4056 Basel, Switzerland.<br />
P.I-36<br />
We grew self-ordered cyanoporphyrin molecular wires [1] on thin epitaxial NaCl(100)<br />
layers on top <strong>of</strong> GaAs substrates under UHV conditions. This molecular assemblies form<br />
one- and two-dimensional wires with a length <strong>of</strong> several 10nm depending on the substrate<br />
conditions. Using a shadow masking technique [2], a nanostencil combined with a room<br />
temperature nc-AFM in UHV, we additionally evaporate Au and Cr electrodes with a<br />
thickness <strong>of</strong> around 3nm in situ. The resulting combined molecular and metal structures<br />
are investigated by means <strong>of</strong> nc-AFM and KPFM (Kelvin probe force microscopy).<br />
While nc-AFM enabled us to control the tip sample distance on the very complex and<br />
partly insulating surface, KPFM has been used to determine and compensate changes <strong>of</strong><br />
the local contact potential difference (LCPD).<br />
Figure 1: (a) nc-AFM image (size 1.7um x 1.7um, LCPD compensated) <strong>of</strong> NaCl/GaAs covered<br />
with cyanoporphyrin molecular wires and clusters. A Cr electrode was evaporated through a<br />
stencil mask in order to contact molecular wires. b) Simultaneously measured LCPD <strong>of</strong> the<br />
structure.<br />
[1] Th. Glatzel, L. Zimmerli, S. Koch, S. Kawai, and E. Meyer, Appl. Phys. Lett. 94, 063303 (2009).<br />
[2] P. Zahl, M. Bammerlin, G. Meyer, and R. R. Schlittler, Rev. Sci. Instrum. 76, 023707 (2005).<br />
127
Poster<br />
Session II<br />
Wednesday, 12 August<br />
128
Molecular Structures <strong>of</strong> Organic Single Crystals Investigated by<br />
Frequency Modulation <strong>Atomic</strong> <strong>Force</strong> Microscopes<br />
Taketoshi Minato 1 , Hiroto Aoki 2 , Thorsten Wagner 3 2, 4<br />
, and Kingo Itaya<br />
129<br />
P.II-01<br />
1<br />
Institute for International Advanced Interdisciplinary Research (IIAIR), Tohoku Univ., 6-6-07 Aoba,<br />
Aramaki, Aoba-ku, Sendai, Miyagi 980-8579, Japan<br />
2<br />
Department <strong>of</strong> Applied Chemistry, Tohoku Univ., 6-6-07 Aoba, Aramaki, Aoba-ku, Sendai, Miyagi 980-<br />
8579, Japan<br />
3<br />
University at Duisburg-Essen, Fachbereich Physics, Lotharstr. 1-21, 47057 Duisburg, Germany<br />
4<br />
World Premier International Research Center (WPI), Tohoku Univ., 6-6-07 Aoba, Aramaki, Aoba-ku,<br />
Sen-dai, Miyagi 980-8579, Japan<br />
Recently, single crystals <strong>of</strong> organic semiconductors such as rubrene [1],<br />
pentacene [2] and PTCDA [3] are attracting great interest as materials to be used for<br />
organic field effect transistors (OFETs). It is important to characterize geometric and<br />
electronic structures <strong>of</strong> organic layers in molecular levels in order to achieve higher<br />
carrier mobility. Here, we describe applications <strong>of</strong> Frequency Modulation <strong>Atomic</strong> <strong>Force</strong><br />
<strong>Microscopy</strong> (FM-AFM) for single crystal to investigate the molecular structure [4, 5].<br />
First, we measured FM-AFM images on<br />
prepared pentance single crystals in UHV. The<br />
obtained molecular resolved FM-AFM images<br />
showed very wide terrace (2 – 3 um) and high<br />
crystallity <strong>of</strong> prepared single crystal without<br />
molecular defects [2]. Also, we have recently<br />
achieved molecular resolution on a rubrene single<br />
crystal in UHV [5]. Fig. 1 shows a FM-AFM<br />
image in 5.0 nm × 5.0 nm. This also showed high<br />
crystallity <strong>of</strong> prepared single crystal without<br />
molecular defects as same as pentacene single<br />
crystals. Such results strongly suggest that the<br />
prepared organic single crytals are applicable to<br />
OFETs.<br />
Figure 1 A FM-AFM image<br />
(5.0 nm × 5.0 nm) <strong>of</strong> rubrene<br />
single crystal. Tsample = 298 K.<br />
References<br />
[1] R. W. I. de Boer, M. E. Gershenson, A. F.<br />
Morpurgo, V. Podzorov, Phys. Status Solidi A, 201, 1302 (2004).<br />
[2] V. Y. Butko, X. Chi, D. V. Lang, A. P. Ramirez, Appl. Phys. Lett. 83, 4773 (2003).<br />
[3] T. Wagner, A. Bannani, C. Bobisch, H. Karacuban, M. Stohr, M. Gabriel, R. Moller,<br />
Org. Elect., 5, 35 (2004).<br />
[4] K. Sato, T. Sawaguchi, M. Sakata, and K. Itaya, Langmuir, 23, 12788 (2007).<br />
[5] T. Minato, H. Aoki, T. Wagner, H. Fukidome and K. Itaya, J. Am. Chem. Soc.,<br />
submitted (2009).
Imaging <strong>of</strong> aromatic molecules by tuning-fork based LT-NC-AFM<br />
P.II-02<br />
Bartosz Such 1 , Thilo Glatzel 1 , Shigeki Kawai 1 , Sacha Koch 1 , Alexis Barat<strong>of</strong>f 1 , Ernst<br />
Meyer 1 , Catelijne H. M. Amijs 2 , Paula de Mendoza 2 , and Antonio M. Echavarren 2<br />
1 Department <strong>of</strong> Physics, University <strong>of</strong> Basel, Kilngelbergstrasse 82, 4056 Basel, Switzerland<br />
2 Institute <strong>of</strong> Chemical Research <strong>of</strong> Catalonia (ICIQ), Av. Països Catalans 16, 43007 Tarragona, Spain.<br />
Utilizing tuning forks [1,2] as sensors for NC-AFM allowed for extending<br />
capability <strong>of</strong> the technique to cryogenic temperatures.<br />
In the presentation, high resolution imaging <strong>of</strong> large aromatic molecules at 5K will<br />
be presented. Functionalized truxeses (10,15-dihydro-5H-diindeno[1,2-a;1',2'c]fluorine)<br />
with three 4-cyanobenzyl groups added in positions 5, 10, and 15 in a syn relative<br />
configuration have been evaporated onto a clean Cu(111) surface. The molecules adopt<br />
planar configuration and form a triangular network (see fig. 1). However, the<br />
cyanobenzyl groups are flexible and can adopt various configurations for neighbouring<br />
molecules. Supposedly the cyanobenzyl groups standing in the upright position appear in<br />
frequency shift images as dark spots (areas <strong>of</strong> larger interaction) due to enhanced<br />
electrostatic interaction with the tip, proving NC-AFM capability <strong>of</strong> imaging internal<br />
structures <strong>of</strong> aromatic molecules.<br />
Figure 1: 7.8x7.8 nm constant height image <strong>of</strong> truxene layer on Cu(111) surface. a) current (tip<br />
bias = -1.8 V, colour scale form 173 pA to 503 pA); b) frequency shift, Ap-p = 260 pm f0 = 26417,<br />
Q = 47000, colour scale from -56.5 Hz to -34.8 Hz.<br />
[1] F.J. Giessibl, Appl. Phys. Lett. 76, 1470 (2000).<br />
[2] M. Ternes et al. Science 319, 5866 (2008).<br />
130
One and Two Dimensional Structure <strong>of</strong> Water on Cu(110) and<br />
O/Cu(110)-(2x1) Surface<br />
Byoung Y. Choi 1 , Yu Shi 1,2 , Thomas Duden 3 , and Miquel Salmeron 1,2<br />
1 Material Science Division, Lawrence Berkeley National Laboratory, Berkeley, USA<br />
2 Department <strong>of</strong> Materials Science and <strong>Engineering</strong>, University <strong>of</strong> California, Berkeley, USA<br />
3 National Center for Electron <strong>Microscopy</strong>, Lawrence Berkeley National Laboratory, Berkeley, USA.<br />
P.II-03<br />
The interaction <strong>of</strong> water on metal surfaces like Ru, Pt, or Pd has been studied for a long<br />
time to understand its role in catalysis, electrochemistry and environmental science.<br />
Especially, the structure <strong>of</strong> water on atomically clean surfaces has been an important<br />
subject because <strong>of</strong> its complexity. Water molecules can easily diffuse and aggregate on<br />
the surface at over ~40K to form a two dimensional (2D) hexagonal structure on closepacked<br />
metallic surfaces [1] .<br />
For water on Cu, it has been reported that it forms 1D-like chains at low coverage on<br />
the (110) surface while it forms 2D hexagonal networks at higher coverage. It has been<br />
proposed that this 1D wire is built from hydrogen bonded hexagons as building blocks<br />
[2]. The 1D chain structure was recently suggested to be a combination <strong>of</strong> pentagons<br />
based on experiment and theory [3]. An important question is how the pentagon based<br />
chains evolve into hexagon based 2D networks. To determine this, more careful<br />
investigation at the atomic scale is required.<br />
<strong>Atomic</strong> force microscopy (AFM) in non-contact (NC) mode can be used to study the<br />
molecules on metals and insulators with atomic resolution. We built a tuning fork base<br />
NC-AFM which works in both 4K and 77K with a FET type current amplifier on the low<br />
temperature side to reduce a noise coupling through the signal lines. Our instrument can<br />
work in either the NC-AFM or STM mode, which provides complementary information<br />
and is useful for reference and calibration.<br />
With this instrument we investigated the evolution <strong>of</strong> water from 1D chain to 2D<br />
network on clean and oxygen precovered Cu(110) surfaces at low temperature, which<br />
reveals the growth mechanism <strong>of</strong> water at various coverages and growth temperatures.<br />
By dosing water on partially covered O/Cu(110)-(2x1) surface, we were able to show that<br />
the oxygen atoms at the edges <strong>of</strong> CuO rows play an important role in forming well<br />
ordered 2D hexagonal networks even at low coverage. Finally we suggest that water<br />
hexamer can be a base structure <strong>of</strong> both 1D and 2D islands when it grows adjacent to<br />
CuO row.<br />
[1] Angelos Michaelides and Karina Morgenstern, Nature Mater. 6, 597 (2007).<br />
[2] T. Yamada, S. Tamamori, H. Okuyama, and T. Aruga, Phys. Rev. Lett. 96, 036105 (2006)<br />
[3] Javier Carrasco, Angelos Michaelides, Matthew Forster, Sam Haq, Rasmita Raval and Andrew<br />
Hodgson, Nature Mater. doi:10.1038/nmat2403 (2009).<br />
131
P.II-04<br />
Dynamical simulations <strong>of</strong> truxene molecules adsorbed on the KBr (001)<br />
surface<br />
Thomas Trevethan 1,2 and Alexander Shluger 2<br />
1 Department <strong>of</strong> Physics and Astronomy, University College London, London, UK<br />
2 WPI Advanced Institute for Materials Research, Tohoku University, Sendai, Japan.<br />
We present the results <strong>of</strong> calculations performed to model the dynamical behavior <strong>of</strong><br />
truxene derivative molecules adsorbed on the KBr (001) surface, which have been<br />
imaged at room temperature with the NC-AFM with both molecular and atomic<br />
resolution. An atomistic potential model <strong>of</strong> the system was built from extensive quantum<br />
chemical calculations and used to investigate the room temperature mobility <strong>of</strong> the<br />
molecules on different surface sites at room temperature using molecular dynamics<br />
simulations. We find a hierarchy <strong>of</strong> rates <strong>of</strong> diffusion on different surface structures: the<br />
molecule is highly mobile on the perfect terrace and is bound to, but mobile along, the<br />
perfect monolayer step edge. The molecule is more strongly bound to double layer kinks,<br />
as observed by their immobilization at these sites in the experimental images; however<br />
the binding energies <strong>of</strong> the molecule on the two different polarity kinks are very similar.<br />
We show using dynamical simulations how one polarity kink results in a much higher<br />
residence time than the other, suggesting the identity <strong>of</strong> the kinks in the experimental<br />
images and hence <strong>of</strong> the identity <strong>of</strong> the sublattice.<br />
132
Temperature-dependent growth <strong>of</strong> C60 on CaF2(111)<br />
Felix Loske, Philipp Maaß, Jens Schütte, and Angelika Kühnle<br />
Department <strong>of</strong> Physics, Universität Osnarück, Barbarastraße 7, 49076 Osnabrück ,Germany<br />
E-Mail: floske@uos.de<br />
P.II-05<br />
Non-contact atomic force microscopy was employed to study the system <strong>of</strong> C60<br />
molecules on the CaF2(111) surface in-situ at various temperatures. The molecules were<br />
observed to be very mobile on the surface at room temperature (RT), as they nucleate at<br />
step edges and form large islands on the terraces. Both, regular triangular islands as well<br />
as branched structures were observed to coexist (Fig. 1b and 1c). The branched structures<br />
were seen to change shape during measuring. S. Burke et al. have previously reported<br />
about such branched structures on alkali halides [1].<br />
The compact islands <strong>of</strong> C60 on CaF2 are at least two layer high, and at higher coverages<br />
C60 molecules grow in a dendritic manner onto the these compact C60 islands (Fig. 1d). In<br />
contrast, at low temperatures (LT) hexagonal islands are predominant, which are initially<br />
only one layer high. Here, already the second layer is growing in a dendritic manner (Fig.<br />
1a).<br />
These temperature-dependent measurements allow to gain insight into the molecular<br />
dynamics <strong>of</strong> this system and to specify the diffusion barrier. Microscopic growth models<br />
are shortly addressed to explain the measured island morphologies.<br />
Figure 1: Topographic NC-AFM images. (a) C60 island with dendritic second layer at LT. (b)<br />
and (c) represent the coexistence <strong>of</strong> compact triangular and branched islands at RT, with dendritic<br />
growth starting at the second layer (d).<br />
[1] S.A. Burke, J.M. Mativetsky, S. Fostner, P. Grütter, Phys. Rev. B 76, 035419 (2007)<br />
133
134<br />
P.II-06<br />
Creating 1D nanostructures: Heptahelicene-carboxylic acid on Calcite<br />
Philipp Rahe 1 , Markus Nimmrich 1 , Jens Schütte 1 , Irena G. Stara 2 and Angelika Kühnle 1<br />
1 Fachbereich Physik, Universität Osnabrück, Barbarastraße 7, 49076 Osnabrück, Germany<br />
2 Institute <strong>of</strong> Organic Chemistry and Biochemistry, Flemingovo nám. 2, 166 10 Prague 6, Czech Republic<br />
Creating nanostructures on a molecular level has received an exceptional level by<br />
depositing molecules on metal surfaces. Structures with two-, one- or quasi zerodimensionality<br />
have successfully been created [1,2]. When deposited onto insulating<br />
substrates, one-dimensional nanostructures may act as wires in future molecular<br />
electronic devices. Recently, first results <strong>of</strong> such structures on insulating surfaces have<br />
been presented, binding molecules to step edges [3] or forming wires consisting <strong>of</strong><br />
several molecules in width [4].<br />
Here, we present a study <strong>of</strong> heptahelicene-carboxylic acid adsorbed on the calcite<br />
(10-14) surface. The molecules are sublimated in-situ from a glass crucible. Both,<br />
molecule deposition and NC-AFM imaging are performed in ultra-high vacuum. As<br />
presented in Fig 1, we observe single and double rows, which align along the [010]<br />
substrate direction. These structures are not bound to step edges. Rows are formed at<br />
room temperature and stabilize presumably by hydrogen bonds between the carboxylic<br />
end groups forming pairs as well as by π-π stacking along the molecular row.<br />
[1] J. Barth et al. Annu Rev Phys Chem 58, 375 (2007).<br />
[2] A. Kühnle. Curr Op Coll Interf Sci 14, 157 (2009).<br />
[3] S. Maier et al. Small 4, 1115 (2007).<br />
[4] M. Fendrich et al. Appl Phys Lett 91, 023101 (2007).<br />
Figure 1: Frequency shift image taken at<br />
room temperature. Rows along the [010]<br />
substrate direction are presented: Single<br />
rows (solid circle) and double rows (dashed<br />
circle). Adjacent to the double rows, further<br />
single rows may attach as marked by a white<br />
triangle.
P.II-07<br />
<strong>Atomic</strong> <strong>Force</strong> <strong>Microscopy</strong> Study <strong>of</strong> Cross-Linked C32H66 Monolayer by<br />
Low-Energy (10eV) Hyperthermal Bombardment<br />
Y. Liu 1 , H.Y. Nie 2 , D.Q. Yang 2 , M.W. Lau 2 and J. Yang 1<br />
1 Department <strong>of</strong> Mechanical and Materials <strong>Engineering</strong>, University <strong>of</strong> Western Ontario, Ontario, Canada<br />
2 Surface Science Western, University <strong>of</strong> Western Ontario, Ontario, Canada<br />
Email: yliu452@uwo.ca<br />
Low-energy (10eV) hydrogen projectiles generated in a special production prototype<br />
reactor are being developed in our study to only break the C-H bonds with other bonds<br />
intact on C32H66 monolayer, as spin cast on a silicon wafer. The generation <strong>of</strong> free carbon<br />
radicals leads to neighboring cross-link and form covalent C-C bonds [1]. The newly<br />
formed surface is characterized by a combination <strong>of</strong> XPS, optical contact angle<br />
measurement and dynamic atomic force microscopy (AFM). Especially, AFM study is<br />
focused on to correlate with the results from other two techniques. Roughness AFM<br />
results demonstrate a temporal behavior <strong>of</strong> C32H66 monolayer surface modification,<br />
corresponding to bombardment time which is proportional to the influence during<br />
bombardment process. The transiting roughness measurements can also interpret the<br />
directional properties <strong>of</strong> the formed covalent C-C bonds.<br />
The controllability <strong>of</strong> the surface modification is additionally demonstrated by the<br />
evolution <strong>of</strong> hydrophibilicity <strong>of</strong> the monolayer as measured by the aid <strong>of</strong> AFM and<br />
contact angle measurements. Phase image by tapping mode AFM provides necessary<br />
contrast on other mechanical properties and/or adhesion energy to evaluate the untreated<br />
and treated areas on an incompletely bombarded monolayer surface [2]. The results are<br />
further associated with the measurements from force modulation and torsion resonance<br />
modes to provide a critical bombardment time essential to carry on a complete<br />
bombardment and guarantee the surface homogeneity. All <strong>of</strong> the results confirm crosslinking<br />
C-C bonds as formed after bombardment and explain the enhanced surface and<br />
mechanical properties through the developed hyperthermal bombardment.<br />
[1] Z. Zheng, X.D. Xu, X.L. Fan, W.M. Lau, and R.W.M. Kwok, J. Am. Chem. Soc. 126, 12336 (2004)<br />
[2] J. 1. Tamayo, J. and R. Garcia, Appl. Phys. Lett., 71, 2394 (1997).<br />
135
P.II-08<br />
Towards a molecule-based Ferroelectric-OFET: surface modification <strong>of</strong><br />
PZT mediated through functionalized thiophene derivates<br />
Peter Milde 1 , Kinga Haubner 2 , Evelyn Jaehne 2 , Denny Köhler 1 , Ulrich Zerweck 1 , and<br />
Lukas M. Eng 1<br />
1 Department <strong>of</strong> Applied Photophysics, TU Dresden, Dresden, Germany<br />
2 Institute <strong>of</strong> Macromolecular Chemistry and Textile Chemistry, TU Dresden, Dresden, Germany<br />
Organic field effect transistors (OFETs) and their application have become a field <strong>of</strong><br />
intense research due to significant advances in molecular design and integration [1]. For<br />
an OFET-design whith a gate “electrode” that is made out <strong>of</strong> a ferroelectric (FE), we may<br />
expect even more functionality due to the strong and remanent electric field arising from<br />
bound surface charges at the FE/molecule interface [2]. In order to achieve excellent<br />
electric transport properties, a high degree <strong>of</strong> intermolecular ordering is inevitable [3].<br />
In our approach, lead zirconate titanate (PZT) is used as material <strong>of</strong> choice for designing<br />
an ultrathin ferroelectric gate electrode in a Ferroelectric-OFET. The focus <strong>of</strong> the present<br />
work is on the film formation process <strong>of</strong> the molecularly thin organic conduction layer<br />
based on α,ω-dicyano-β,β*-dibutylquaterthiophene (DCNDBQT). Film formation is<br />
effectively promoted through specifically designed, bifunctional self-assembling<br />
molecules (CNBTPA: 5-cyano-2-(butyl-4-phosphonic acid)-3butylthiophene) which act<br />
as template layer (see Fig. 1). We report on nc-AFM and KPFM [4] investigation <strong>of</strong> the<br />
template layer's structural and electronical properties.<br />
D<br />
Org.<br />
DCNDBQT<br />
Ferroelectric Gate<br />
Conductive Gate<br />
Figure 1: Schematic <strong>of</strong> the proposed molecular OFET design. The CNBTPA template layer<br />
promotes both bonding <strong>of</strong> the organic semiconductor onto the PZT substrate and the self<br />
assembling <strong>of</strong> the DCNDBQT layer.<br />
[1] see for instance: phys. stat. solidi A 205(3) (2008)<br />
[2] S. Gemming, R, Luschtinetz, W. Alsheimer, G. Seifert, Ch. Loppacher, and L.M. Eng, Journal <strong>of</strong><br />
Computer-Aided Materials Design 14(S1), 211 (2007)<br />
[3] K. Haubner, E. Jähne, H.-J.P. Adler, D. Köhler, Ch. Loppacher, L.M. Eng, J. Grenzer, A.<br />
Herasimovich, and S. Scheinert, phys. stat. solidi A 205(3), 430 (2008)<br />
[4] U. Zerweck, Ch. Loppacher, T. Otto, S. Grafström, and L.M. Eng, Phys. Rev. B 71, 125424 (2005)<br />
S<br />
136
Imaging and Detection <strong>of</strong> Single Molecule Recognition Events on<br />
Organic Semiconductor Surfaces<br />
P.II-09<br />
N. S. Losilla 1 ,J. Preiner 2 , , A. Ebner 2 , P. Annibale 3 , F. Biscarini 3 , R. Garcia 1 and P.<br />
Hinterdorfer 2<br />
1 Instituto de Microelectrónica de Madrid, CSIC, Tres Cantos, Spain<br />
2 Johannes Kepler University <strong>of</strong> Linz, Austria<br />
3 CNR-Istituto per lo Studio dei Materiali Nanostrutturati (ISMN),Italy<br />
The combination <strong>of</strong> organic thin film transistors and biological molecules could open<br />
new approaches for the detection and measurement <strong>of</strong> properties <strong>of</strong> biological entities. To<br />
generate specific addressable binding sites on such substrates, it is necessary to determine<br />
how single biological molecules, capable <strong>of</strong> serving as such binding sites behave upon<br />
attachment to semiconductor surfaces. Here, we use a combination <strong>of</strong> high-resolution<br />
atomic force microscopy topographical imaging and single molecule force spectroscopy<br />
(TREC), to study the functionality <strong>of</strong> antibiotin antibodies upon adsorption on pentacene<br />
islands, using biotin-functionalized, magnetically coated AFM tips. The antibodies could<br />
be stably adsorbed on the pentacene, preserving their functionality <strong>of</strong> recognizing biotin<br />
over the whole observation time <strong>of</strong> more than one hour. We have resolved individual<br />
antigen binding sites on single antibodies for the first time. This highlights the resolution<br />
capacity <strong>of</strong> the technique.<br />
Figure 1: (a) Scheme <strong>of</strong> the simultaneous topography and recognition AFM imaging <strong>of</strong> antibiotin<br />
antibodies adsorbed on pentacene islands. A magnetically driven cantilever oscillates across the<br />
surface. The oscillation signal is split into two parts <strong>of</strong> which the lower part is used to generate<br />
the topography (topography signal, red) and the upper part is used for the recognition image<br />
(recognition signal, green).(b) Antibody molecule on pentacene with its expected size and shape.<br />
[1] J. Preiner et al. Nano Lett., , 9, 571( 2009).<br />
a) b)<br />
137<br />
10 nm<br />
100 nm
P.II-10<br />
Transverse conductance image <strong>of</strong> DNA probed by current-feedback<br />
noncontact AFM<br />
T. Matsumoto 1, Y. Maeda 2, and T Kawai 1<br />
1 Institute <strong>of</strong> Scientific and Industrial Research (ISIR), Osaka Universit,Osaka, Japan<br />
2 National Institute <strong>of</strong> Advanced Industrial Science and Technology (AIST), Osaka Japan<br />
Scanning probe microscopy (SPM), which provides means to access to individual<br />
molecule, has a special significance for investigations <strong>of</strong> molecular-scale electronics. In<br />
particular, scanning tunneling microscopy (STM) has been used to evaluate molecular<br />
conductivity. However, STM measurement is effective only for height-foreknown system<br />
such as the molecules embedded in self-assembled monolayer. For the molecules having<br />
conformational variations, STM measurement is unable to separate the information <strong>of</strong><br />
transverse conduction through the molecules from the unknown height variation.<br />
We demonstrated that simultaneous measurement <strong>of</strong> tunnel current and frequency<br />
shift realized to separate electrical properties from topographic variations. Figure 1(a)<br />
shows simultaneously obtained STM topography (constant-current mode) and frequency<br />
shift image <strong>of</strong> DNA on Cu (111) surface. These images are totally similar to each other<br />
but the contrast distribution <strong>of</strong> these images shows differences. For the quantitative study<br />
<strong>of</strong> these variances, the correlation between STM height and frequency shift is analyzed by<br />
plotting each pixel as shown in Figure 2(a). The negative frequency shift overall increase<br />
as increasing STM height. This indicates that the tip close to the molecule at the high<br />
region <strong>of</strong> STM topography. Assuming the transverse electron tunneling through DNA<br />
molecules, frequency shift and STM height show linear relationship as a function <strong>of</strong><br />
transconductance G0 at molecule/surface interface and attenuation decay constant β. The<br />
line represented in Figure 2(a) means the data sets <strong>of</strong> STM height and frequency shift<br />
satisfying a parameter set <strong>of</strong> G0=0.27 and β= 0.26 . The pixel data picked from the plots<br />
around this line is used for reconstructing an image which shows a slice indicating the<br />
conduction with G0=0.27 and β= 0.26. As shown in Figure 2(b), the conductance image<br />
differ from either STM topography and frequency shift image in that it reflects the<br />
conductance variations affected by molecular conformation and/or molecules/substrate<br />
interface.<br />
STM topography Frequency shift image<br />
Fig. 1. Simultaneously obtained STM<br />
topography and frequency shift image<br />
<strong>of</strong> DNA on Cu (111).<br />
(a) Correlation analysis (b) Conductance image<br />
Frequency shift (Hz)<br />
4<br />
2<br />
0<br />
-2<br />
-4<br />
-6<br />
(G 0 ,β ) = (0.26, 0.27)<br />
-8<br />
-6 -4 -2 0 2 4 6 8<br />
STM height (nm)<br />
Fig. 2. (a) Correlation analysis between STM height<br />
and frequency. (b) Conductance image reconstructed<br />
from the data around the line <strong>of</strong> G0=0.27, β= 0.26.<br />
138
P.II-11<br />
Imaging Schwann Cell NGF Receptors using <strong>Atomic</strong> <strong>Force</strong> <strong>Microscopy</strong><br />
Ryan Williamson and Cheryl Miller<br />
Department <strong>of</strong> Biomedical <strong>Engineering</strong>, Saint Louis University, St Louis, MO, USA.<br />
Nerve growth factor (NGF) is a necessary neurotrophic agent that promotes neural<br />
survival and proliferation. Production <strong>of</strong> NGF by Schwann cells is essential for<br />
successful nerve regeneration. During neural axotomy and the resulting Wallerian<br />
degeneration, Schwann cells increase proliferation while axons and their myelin sheaths<br />
are degraded. The resulting formation, the band <strong>of</strong> Bungner, is crucial for guidance <strong>of</strong><br />
axon sprouts which form during regeneration. Schwann cells in the distal axon will<br />
express the high affinity NGF receptor tyrosine kinase A (TrkA) selectively in the bands<br />
<strong>of</strong> Bungner as well as the low affinity receptor p75. Using force measurements taken<br />
with a modified atomic force microscopy (AFM) tip to detect binding events, NGF<br />
receptor locations were identified. Using AFM with Schwann cells, we investigated the<br />
expression and conformation <strong>of</strong> NGF receptors. Receptor location and change during<br />
axon-Schwann cell contact could explain Schwann cell role during regeneration and<br />
possible clinical solutions.<br />
139
Comparative Studies on Water Structures on Hydrophilic and<br />
Hydrophobic Surfaces by FM-AFM<br />
Kazuhiro Suzuki 1 , Noriaki Oyabu 1,2 , Kei Kobayashi 3 , Kazumi Matsushige 1 ,<br />
and Hir<strong>of</strong>umi Yamada 1 .<br />
1 Department <strong>of</strong> Electronic Science and <strong>Engineering</strong>, Kyoto University, Kyoto, Japan<br />
2 Japan Science and Technology Agency /Adv. Meas. and Analysis, Japan<br />
3 Innovative Collaboration Center, Kyoto University, Kyoto, Japan<br />
P.II-12<br />
Water structures play essential roles in various biochemical functions such as selfassembly<br />
<strong>of</strong> proteins and molecular recognition between ligands and receptors. Recently<br />
we succeeded in three-dimensional molecular-scale visualization <strong>of</strong> water structures on<br />
hydrophilic surfaces including a mica surface and a purple membranes using frequency<br />
modulation atomic force microscopy (FM-AFM) [1].<br />
In this study water structures on a hydrophobic highly oriented pyrolytic graphite<br />
(HOPG) surface were investigated using FM-AFM. The results were compared with<br />
those obtained on the hydrophilic mica surfaces. Figure 1 shows frequency shift-distance<br />
curves measured on the HOPG surface (a) and on the mica surface (b). The oscillatory<br />
behavior, originating from the water structure on each surface, can be observed in each<br />
curve. However, there is a clear difference in the number <strong>of</strong> the water layers between the<br />
two curves, which reflects the difference in the hydrophilicities <strong>of</strong> the two surfaces. In<br />
addition, a possible effect <strong>of</strong> the hydration structure on the AFM tip surface was<br />
investigated by using a chemically modified tip with a self-assembled monolayer film.<br />
Figure 1: Frequency shift-distance curves measured on a hydrophobic HOPG surface (a) and on<br />
a hydrophilic mica surface (b). Arrows indicate the peaks produced by the water layers.<br />
[1] K. Kimura et al, The 11 th International Conference on Non-Contact <strong>Atomic</strong> <strong>Force</strong> <strong>Microscopy</strong>,<br />
Madrid 2008, Oral Presentation Th-1200.<br />
140
Molecular Resolution Investigation <strong>of</strong> Lysozyme Crystal<br />
in Liquid by Frequency-Modulation AFM<br />
P.II-13<br />
K. Nagashima 1,2 , M. Abe 1,2 , S. Morita 1,2 , N. Oyabu 2,3 , K. Kobayashi 2,3,4 , H. Yamada 2,3 ,<br />
R. Murai 1 , H. Adachi 1,5 , K. Takano 1,5 , H. Matsumura 1,5 , S. Murakami 5,6 , T. Inoue 1,5 , Y.<br />
Mori 1,5 , M. Ohta 2,7 , R. Kokawa 2,7<br />
1Grad. <strong>School</strong> <strong>of</strong> Eng., Osaka Univ.; 2 SENTAN, JST; 3 Electronic Sci. & Eng., Kyoto Univ.; 4 Innovative<br />
Collaboration Center, Kyoto Univ.; 5 SOSHO Inc.; 6 Grad. <strong>School</strong> <strong>of</strong> Biosci. and Biotech., Tokyo Insti. <strong>of</strong><br />
Tech.; 7 Shimadzu Corporation<br />
Recently, Frequency-Modulation AFM (FM-AFM) in liquids has opened a new<br />
way to direct visualization with atomic or molecular resolution [1,2]. We have developed<br />
a high-resolution FM-AFM working in liquids based on a commercially available AFM<br />
(Shimadzu: SPM-9600), which obtained atomic or molecular resolution in liquid [3].<br />
We have tried to observe protein crystals in liquid. To make high quality protein<br />
crystals is very important for determining its molecular structure by X-ray diffraction<br />
analysis. We observed (110) face <strong>of</strong> tetragonal lysozyme crystal in saturated solution. A<br />
surface unit cell (11.2 x 3.8 nm) consists <strong>of</strong> 4 molecules with different orientations from<br />
one another (Fig. 1a). We observed it for the first time at molecular resolution (Fig. 1b),<br />
which was not achieved in contact mode AFM [4]. In addition, we also succeeded to<br />
observe changes <strong>of</strong> the terrace with admolecule and the point defect when the terrace was<br />
covered with a single unit layer (height = 5.6 nm) in supersaturated solution. Such<br />
observations are considered to be fruitful technique for investigating growth mechanism<br />
at molecular level.<br />
a) b)<br />
c c<br />
5 nm<br />
Figure 1: (a) The molecular-packing arrangement <strong>of</strong> the tetragonal lysozyme (110) face. The<br />
surface unit cell shows black rectangle. (b) FM-AFM image <strong>of</strong> tetragonal lysozyme (110) face.<br />
[1] T. Fukuma, K. Kobayashi, K. Matsushige, H. Yamada, Appl. Phys. Lett. 86 (2005) 193108.<br />
[2] T. Fukuma, K. Kobayashi, K. Matsushige, H. Yamada, Appl. Phys. Lett. 87 (2005) 34101.<br />
[3] S. Rode, N. Oyabu, K. Kobayashi, H. Yamada, A. Kuhnle, Langmuir 25 (2009) 2850.<br />
[4] H. Li, M. A. Perozzo, J. H. Konnert, A. Nadarajaha, M. L. Pusey, Acta Cryst. D55 (1999) 1023.<br />
141
<strong>Noncontact</strong> <strong>Atomic</strong> <strong>Force</strong> Microscope Observation<br />
<strong>of</strong> TiO2(110) Surface in Pure Water<br />
Akira Sasahara 1 , Yonkil Jeong 1 , and Masahiko Tomitori 1<br />
1 <strong>School</strong> <strong>of</strong> Materials Science, Japan Advanced Institute <strong>of</strong> Science and Technology, Ishikawa, Japan<br />
P.II-14<br />
Titanum dioxide (TiO2) has a wide range <strong>of</strong> industrial applications such as pigments,<br />
optical devices, catalyst supports, photocatalysts, and photoelectrodes. A rutile<br />
TiO2(110) surface, which exhibits a simple truncation <strong>of</strong> the bulk structure (Fig. 1(a)) by<br />
simple cleaning procedures, has been most frequently employed in ultra high vacuum<br />
(UHV) studies to understand the origin <strong>of</strong> its properties. In many <strong>of</strong> the applications,<br />
TiO2 demonstrates the excellent properties in the presence <strong>of</strong> aqueous media. Nanoscale<br />
investigation <strong>of</strong> a well-defined rutile TiO2(110) surface in a liquid possibly provides<br />
further insight into the surface chemical properties <strong>of</strong> TiO2. We attempted noncontact<br />
atomic force microscope (NC-AFM) observation <strong>of</strong> TiO2(110) surface in pure water.<br />
The experiments were performed by using an intermittent contact mode atomic force<br />
microscope (5500 AFM/SPM, Agilent Technologies). The microscope was operated as<br />
an NC-AFM by using a phase locked loop detector (easy PLL plus, Nanosurf AG). The<br />
microscope was placed in a glass chamber, and imaging was performed under a flow <strong>of</strong><br />
Ar. The TiO2(110) surface was cleaned by cycles <strong>of</strong> Ar + sputtering and annealing in<br />
UHV, removed from the vacuum chamber, and immersed in Ar-purged Milli-Q water.<br />
Figure 1(b) shows an NC-AFM image <strong>of</strong> the surface in water. Strings elongated to the<br />
[001] direction were observed. Along cross section 1 in Fig. 1(c), subnanometer<br />
corrugation was observed perpendicular to the rows. The distance between the lowest<br />
rows, indicated by arrowheads, was approximately 0.65 nm. On some <strong>of</strong> the rows,<br />
periodic corrugation was observed as shown in the cross sections 2 and 3. We attributed<br />
the lowest rows to the oxygen atom rows, and the corrugation along the rows to H2O<br />
clusters.<br />
Figure 1: (a) Ball model <strong>of</strong> a rutile TiO2(110)-(1×1) surface. Size <strong>of</strong> the unit cell is 0.65<br />
nm×0.30 nm. (b) NC-AFM image <strong>of</strong> the TiO2(110) surface in pure water (15×15 nm 2 ).<br />
Frequency shift = +150 Hz, sample bias voltage = 0 V, peak-to-peak amplitude <strong>of</strong> the cantilever<br />
oscillation = 2 nm. (c) Cross sections obtained along the lines in the image.<br />
142
Development <strong>of</strong> Multifrequency High-speed NC-AFM in Liquid<br />
Y. J. Li 1,2 , K. Takahashi 1 , N. Kobayashi 1 , Y. Naitoh 1,2 , M. Kageshima 1,2<br />
and Y. Sugawara 1,2<br />
1 Department <strong>of</strong> Applied Physics, Osaka University and 2 CREST, Japan<br />
P.II-15<br />
AFM is a power tool to observe the solid-liquid interface, and it has succeeded in true<br />
atomic-resolution imaging on the nano-scale. Especially, the high-speed imaging is useful<br />
for understanding the dynamic behavior <strong>of</strong> biomolecules and the clarification <strong>of</strong> the<br />
physical phenomena that happen in the solid-liquid interface. In order to clarify unknown<br />
physical phenomena on the surface, not only the topography image and energy<br />
dissipation image but also elasticity including the information <strong>of</strong> surface physical<br />
properties is also necessary.<br />
Previously, we have succeeded in simultaneous imaging topography and energy<br />
dissipation image by our developed high-speed phase-modulation AFM (PM-AFM) in<br />
constant-amplitude (CA) mode [1-2]. Recently, Garcia et al have developed a theory <strong>of</strong><br />
the multifrequency method in AM-AFM [3]. So far, the multifrequency method for<br />
measuring elasticity by high-speed PM-AFM in CA mode has not been developed yet.<br />
In this research, we develop the multifrequency high-speed PM-AFM in CA mode with<br />
the capability <strong>of</strong> simultaneous imaging elasticity in liquid. From the theory and the<br />
experiment, we discuss the multifrequency method in high-speed PM-AFM in CA mode.<br />
The high-speed elasticity image can be measured by phase shift Ф2from high-speed<br />
phase detector with the bandwidth <strong>of</strong> 3MHz (the second resonance mode). We<br />
demonstrate the multifunctional high-speed images <strong>of</strong> polymer film with the scan<br />
speed <strong>of</strong> 10 frames /s in water.<br />
(a) (b) (c)<br />
Figure 2 (a) topographic, (b) energy dissipation and (c) elasticity images <strong>of</strong> polymer film<br />
with 10frames/s. 300x300nm 2 . f1 =600 kHz, f2 =3MHz.<br />
[1] N. Kobayashi et, al., Jpn. J. Appl. Phys., 45 (2006) L793.<br />
[2] Y. Sugawara, et, al., Appl. Phys. Lett., 90 (2007) 194104.<br />
[3] J. R. Lozano and R. Garcia, Phys. Rev. Lett., 100 (2008) 076102.<br />
143
P.II-16<br />
Frequency-Domain and Time-Domain Analyses <strong>of</strong> S<strong>of</strong>t-Matter<br />
Dynamics Using Wide-Band Magnetic Excitation AFM<br />
Masami Kageshima, Tatsuya Ogawa, Shinkichi Kurachi, Yoshitaka Naitoh, Yan Jun Li,<br />
and Yasuhiro Sugawara<br />
Department <strong>of</strong> Applied Physics, Osaka University, Suita, Osaka, Japan.<br />
Dynamics analysis <strong>of</strong> nanometer-scale s<strong>of</strong>t matter systems is essentical in<br />
understanding mechanical properties <strong>of</strong> polymer systems, function <strong>of</strong> biological<br />
molecules, interaction <strong>of</strong> biological systems with water molecules, etc. There are two<br />
major experimentally accessible quantities to represent viscoelastic properties <strong>of</strong> a system,<br />
a frequency response function and a step response function, each <strong>of</strong> which can be<br />
understood as a frequency-domain and a time-domain measurement, respectively.<br />
Bothapproaches can be implemented with AFM by applying a sinusoidal force with a<br />
varied frequency or a step force onto the AFM cantilever, given that the excitation device<br />
posesses a sufficient bandwidth. Here the magnetic excitation technique was extended so<br />
that a supurious-free and well-characterized cantilever excitation force can be applied<br />
onto the cantilever beyond 1 MHz [1]. As an example <strong>of</strong> a frequency-domain<br />
measurement, frequency-dependent viscoelasticity <strong>of</strong> a single dextran chain was already<br />
presented [1]. Alternatively, a step force can be applied to the cantilever using the same<br />
excitation system. By driving a coreless electromagnet with a wide-band constant-current<br />
circuit (Fig. 1), a current step <strong>of</strong> 1 A can be settled in ca. 500 ns (Fig 2(a)). Since the<br />
cantilever deflection makes a ringing motion mainly due to its fundamental resonance<br />
even in liquid, an active feedback (Q-control) circuit is employed to suppress the<br />
resonance (Fig. 2(b)). Results <strong>of</strong> analysis <strong>of</strong> a single polymer chain and water molecules<br />
interacting with a hydrophilic surface will be presented.<br />
Input<br />
Sinusoidal<br />
Step<br />
+<br />
OP amp.<br />
-<br />
HV amp.<br />
-<br />
Electromagnet<br />
Differential amp.<br />
Fig. 1: Constant-current circuit and electromagnet.<br />
[1] M. Kageshima, T. Chikamoto, T. Ogawa, Y.<br />
Hirata, T. Inoue, Y. Naitoh, Y. J. Li, and Y.<br />
Sugawara, Rev. Sci. Instrum. 80 (2009) 023705.<br />
+<br />
Cantilever<br />
Magnet<br />
144<br />
Iuput (V)<br />
(a)<br />
0.08<br />
0.03<br />
-0.02<br />
-1 0 1<br />
(b) Time (microsec.)<br />
input<br />
deflection 3 nm<br />
0.4<br />
-0.1<br />
-0.6<br />
Current (A)<br />
0 1 2 3 4 5<br />
Time (msec.)<br />
Fig.2: (a) Current pr<strong>of</strong>ile and (b) Qsuppressed<br />
cantilever deflection in water.
<strong>Noncontact</strong> observation in liquid with van der Pol-type FM-AFM<br />
M. Kuroda 1 , H. Yabuno 2 , T. Someya 3 , R. Kokawa 4 , and M. Ohta 4<br />
1 National Institute <strong>of</strong> Advanced Industrial Science and Technology (AIST), Tsukuba, Japan<br />
2 Department <strong>of</strong> Mechanical <strong>Engineering</strong>, Keio University, Yokohama, Japan<br />
3 Mitsubishi Heavy Industries Ltd., Hiroshima, Japan<br />
4 Analytical & Measuring Instruments Division, Shimadzu Corp., Kyoto, Japan<br />
<strong>Atomic</strong> force microscopy (AFM) is crucial for nanobiotechnology<br />
studies. Observing bio-related samples<br />
in liquids using AFM is important, but deformable,<br />
uneven, and easily damaged surfaces <strong>of</strong> such<br />
specimens require non-contact AFM observation.<br />
For probe-cantilever excitation, the eigenfrequency<br />
must be estimated based on frequency response<br />
characteristics for the external excitation method. It<br />
cannot estimate the probe cantilever’s eigenfrequency<br />
precisely because <strong>of</strong> many spurious peaks (Fig. 1). But,<br />
the self-excitation method needs fine adjustment <strong>of</strong> the<br />
linear feedback gain near the oscillation limit by an<br />
automatic gain controller (AGC) to prevent the probe<br />
cantilever from touching the sample surface:<br />
oscillation can easily halt, disabling the observation.<br />
In solving those problems, van der Pol-type (vdP)<br />
self-excited oscillation represents a positive use <strong>of</strong><br />
nonlinearity [1–2]. Along with conventional positive<br />
linear velocity feedback for self-excited oscillation,<br />
vdP self-excited oscillation is realized by adding<br />
nonlinear feedback proportional to the squared<br />
deflection times the velocity. With the eigenfrequency<br />
component alone (Fig. 2), vdP self-excited oscillation<br />
guarantees existence <strong>of</strong> a stable stationary amplitude.<br />
Increased nonlinear feedback gain reduces the response<br />
amplitude but retains the high gain linear feedback.<br />
A 19-nm-high SiN4 surface pattern with 3 μm pitch<br />
was observed in pure water using vdP-AFM (Fig. 3).<br />
The smaller probe-cantilever vibration amplitude than<br />
the probe-cantilever – sample gap verifies noncontact<br />
observation. The vdP-AFM takes sample surface<br />
images with equal accuracy to that <strong>of</strong> contact-mode<br />
AFM. Even in liquid, oscillation continues.<br />
[1] H. Yabuno et al. Nonlinear Dynamics 54, 137 (2008).<br />
[2] M. Kuroda et al. Journal <strong>of</strong> System Design and Dynamics 2-3, 886 (2008).<br />
145<br />
P.II-17<br />
Figure 1: Frequency response<br />
curve in pure water (External<br />
excitation method)<br />
f=54.4 kHz<br />
Figure 2: Power spectrum in pure<br />
water (vdP self-excited oscillation<br />
method)<br />
Figure 3: Sample observed in pure<br />
water by vdP FM-AFM
P.II-18<br />
Development <strong>of</strong> a NC – AFM for Ambient and Liquid Environments<br />
Haider I. Rasool 1 , Shivani Sharma 1 , James K. Gimzewski 1,2,3<br />
1 Department <strong>of</strong> Chemistry and Biochemistry, University <strong>of</strong> California – Los Angeles, USA<br />
2 California NanoSystems Institute, 570 Westwood Plaza, Los Angeles, USA.<br />
3 International Center for Materials Nanoarchitectonics (MANA), Tsukuba, Japan<br />
High resolution Non – Contact <strong>Atomic</strong> <strong>Force</strong> <strong>Microscopy</strong> imaging has been<br />
achieved by various groups in both ambient and liquid environments [1] – [3]. The recent<br />
success <strong>of</strong> NC – AFM in these “low – Q” environments has been attributable to the<br />
development <strong>of</strong> low noise detection schemes for measuring small amplitude deflections.<br />
We describe current research on the development <strong>of</strong> a robust home – built scanning probe<br />
microscope with an incorporated low noise all fiber interferometer deflection sensor for<br />
imaging in both ambient and liquid environments. The current design <strong>of</strong> the scanning<br />
probe microscope in its AFM configuration is depicted in Figure 1 (a).<br />
The developing instrument has been used to image various biological species in<br />
both ambient and liquid environments in different imaging modes. In particular, our<br />
group has been successful in imaging isolated human saliva exosomes fixed to a mica<br />
substrate in both air and buffer solution. Both amplitude and phase modulation imaging<br />
have been accomplished on these samples under ambient conditions. Using constant<br />
excitation phase modulated imaging, a simultaneous mapping <strong>of</strong> topography and energy<br />
dissipation has been possible at a constant average tip sample force. Figure 1(b) shows a<br />
typical image <strong>of</strong> the topography <strong>of</strong> an isolated exosome.<br />
a) b)<br />
Figure 1: The above images show (a) the design <strong>of</strong> the home built microscope and (b) a PM –<br />
AFM image <strong>of</strong> a human saliva exosome.<br />
[1] T. Fukuma, M. Kimura, K. Kobayashi, K. Matsushige, and H. Yamada. Rev. Sci. Instrum. 76, 053704<br />
(2005).<br />
[2] B.W. Hoogenboom, H.J. Hug, Y. Pellmont, S. Martin, P.L.T.M. Frederix, D. Fotiadis,and A. Engel.<br />
Appl. Phys. Lett. 88, 193109 (2006).<br />
[3] T. Fukuma, and S. Jarvis. Rev. Sci. Instrum. 77, 043701 (2006).<br />
146
P.II-19<br />
Cantilever Holder Design for Spurious-Free Cantilever Excitation in<br />
Hitoshi Asakawa 1 and Takeshi Fukuma 1,2<br />
Liquid by Piezoactuator<br />
1 Frontier Science Organization, Kanazawa University, Japan<br />
2 PRESTO, JST, Japan<br />
Recent advancement in frequency modulation atomic force microscopy (FM-AFM)<br />
has enabled us to obtain atomic and molecular resolution images in liquid, which has<br />
encouraged us to explore the possibilities <strong>of</strong> FM-AFM application in biological research.<br />
In liquid-environment FM-AFM, a method for cantilever excitation is particularly<br />
important for ensuring the stability and accuracy in imaging and quantitative force<br />
measurements. This is because FM-AFM utilizes a cantilever deflection signal not only<br />
for obtaining a distance feedback signal (i.e., frequency shift signal) but also for<br />
producing a cantilever excitation signal. Although the cantilever excitation with a<br />
piezoactuator is most commonly used, the method typically results in an excitation <strong>of</strong><br />
spurious resonances around the natural resonance frequency <strong>of</strong> a cantilever due to the<br />
uncontrolled propagation <strong>of</strong> acoustic waves from a piezoactuator to the cantilever (Fig.<br />
1(a)).<br />
In order to suppress the influence <strong>of</strong> the spurious resonances, we propose a cantilever<br />
holder design, where the propagation <strong>of</strong> an acoustic wave is restricted the surrounding<br />
boundaries between two materials having significantly different specific acoustic<br />
resistances (ρ·c [kg/m 2 ·s]). In our design, an acoustic wave is greatly reduced by the<br />
reflection at the boundary between a piezoactuator (PZT, ρ·c=35×10 6 ) and its supporting<br />
material (PEEK, ρ·c=3.3×10 6 ). Then the remaining acoustic wave is further reduced by<br />
the reflection at the boundaries between the PEEK part and other components such as a<br />
cantilever support (stainless steel 316, ρ·c=36×10 6 ) and an optical window (glass,<br />
ρ·c=11×10 6 ). Figure 1 demonstrates the remarkable effect <strong>of</strong> the acoustic boundaries for<br />
suppressing spurious vibrations induced by the acoustic waves.<br />
a) b)<br />
Figure 1: Frequency responses <strong>of</strong> cantilever oscillation amplitude induced by a piezoactuator.<br />
(Excitation amplitude, : 0.5 V, : 1 V, : 1.5 V). Supporting materials for a piezoactuator: (a)<br />
stainless steel 316 and (b) PEEK.<br />
147
The different faces <strong>of</strong> the calcite (10-14) surface<br />
Jens Schütte 1 , Lutz Tröger 1 , Philipp Rahe 1 , Ralf Bechstein 1,2 and Angelika Kühnle 1<br />
1 Fachbereich Physik, Universität Osnabrück, Barbarastraße 7, 49076 Osnabrück, Germany<br />
2 present address: iNano, Aarhus University, DK-8000 Aarhus C, Denmark<br />
P.II-20<br />
Although atomic resolution has been achieved on calcite (10-14) using static atomic force<br />
microscopy (AFM) in liquid environment since 1992 [1], it is still unclear whether the<br />
surface reconstructs or not. Most experiments carried out so far using static AFM in<br />
liquids show a reconstruction <strong>of</strong> the surface in the [-4-21] direction, called “row pairing”<br />
[2,3]. Besides the row pairing, several results exist, showing a (2 x 1) reconstruction [4].<br />
This reconstruction has been discussed rather controversial and was explained by the<br />
adsorption <strong>of</strong> water.<br />
Here, we present an NC-AFM study carried out in ultra-high vacuum <strong>of</strong> the in-situ<br />
cleaved calcite (10-14) surface showing real atomic resolution (see Fig. 1 (a)) and a<br />
detailed research <strong>of</strong> the many “faces” <strong>of</strong> the surface. It is shown, that the (2 x 1)<br />
reconstruction (see Fig. 1 (b)) <strong>of</strong> the surface is not induced by water adsorption, but<br />
imaging the surface with a (2 x 1) reconstruction is strongly influenced by the tip-sample<br />
distance.<br />
a) b)<br />
Figure 1: NC-AFM frequency shift images <strong>of</strong> calcite (10-14). In (a) the surface shows “row<br />
pairing” in [-4-21] direction, however, no (2 x 1) reconstruction is seen. The average detuning is -<br />
9.3 Hz. In (b) a (2 x 1) reconstruction is clearly visible. The average detuning is -12.1Hz.<br />
[1] P. E. Hillner et al., Ultramicroscopy 42-44, 1387 (1992).<br />
[2] S. L. S. Stipp et al., Geochim. Cosmochim. Ac. 58, 3023 (1994).<br />
[3] F. Ohnesorge and G. Binnig, Science 260, 1451 (1993).<br />
148
P.II-21<br />
Manipulation Mechanism <strong>of</strong> Single Cu Atoms on Cu(110)-O Surface<br />
with Low Temperature Non-Contact AFM<br />
Y. Kinoshita, T. Satoh, Y. J. Li, Y. Naitoh, M. Kageshima and Y. Sugawara<br />
Department <strong>of</strong> Applied Physics, Graduate <strong>School</strong> <strong>of</strong> <strong>Engineering</strong>, Osaka University Osaka, Japan<br />
Atom manipulation is a fascinating technique for artificially fabricating nanometer<br />
scale structures. Recently using non-contact atomic force microscopy (NC-AFM), the<br />
well-controlled manipulations <strong>of</strong> individual atoms [1] or molecules on surfaces were<br />
demonstrated. Furthermore, using the force spectroscopy techniques, atomic force-vector<br />
field [2] or driving forces involved in a single atom manipulation [3] were determined.<br />
More recently our group have successfully manipulated single topmost Cu atoms<br />
laterally on Cu(110)-O surfaces and identified manipulation modes (pulling or pushing)<br />
from the AFM feedback signals. At the same time, we found that the atom species (Cu or<br />
O) <strong>of</strong> the tip apex changes not only the AFM topographic images drastically but also the<br />
mode for lateral manipulation <strong>of</strong> a Cu atom on the surface. However the difference in tipsample<br />
potential energy from the species <strong>of</strong> the tip apex has still been unclear. In this<br />
study, we investigate the potential distributions depending on the species <strong>of</strong> the topmost<br />
atom on the tip and clarify the different mechanisms for lateral manipulation <strong>of</strong> Cu atoms<br />
All measurements were performed in ultrahigh vacuum at 78 K. By using the image<br />
tracking scheme, the precise positioning <strong>of</strong> the tip with small drift velocity
P.II-22<br />
Simultaneous NC-AFM/STM Imaging <strong>of</strong> the Surface Oxide Layer on<br />
Cu(100) and Identification <strong>of</strong> Lattice Sites<br />
Mehmet Z. Baykara 1 , Todd C. Schwendemann 1,2 , Eric I. Altman 2 , Udo D. Schwarz 1<br />
1<br />
Department <strong>of</strong> Mechanical <strong>Engineering</strong> and Center for Research on Interface Structures and Phenomena<br />
(CRISP), <strong>Yale</strong> University, New Haven, USA<br />
2<br />
Department <strong>of</strong> Chemical <strong>Engineering</strong> and Center for Research on Interface Structures and Phenomena<br />
(CRISP), <strong>Yale</strong> University, New Haven, USA<br />
Exposure <strong>of</strong> Cu(100) to molecular oxygen at elevated temperatures leads to the (2√2 ×<br />
√2) R45 o missing row reconstruction pictured in Fig. 1a, where oxygen atoms are found<br />
to sit nearly co-planar with the Cu atoms in the outermost layer [1]. Since O and Cu<br />
atoms occupy sublattices with different symmetries, this surface represents an ideal<br />
model where atoms responsible for contrast formation in NC-AFM and STM imaging<br />
modes can be identified by symmetry alone. Using our homebuilt low temperature,<br />
ultrahigh vacuum atomic force microscope [2], we have obtained simultaneously<br />
recorded NC-AFM and tunneling current images on the oxidized Cu(100) surface.<br />
Comparing the visual distinctions between the two images, bright features in the images<br />
are assigned to specific locations on the surface. In particular, metal tips are found to<br />
interact strongly with bridge sites between two under-coordinated oxygen atoms, leading<br />
to a rectangular unit cell contrast in high-resolution NC-AFM images (Fig. 1b), whereas<br />
simultaneously collected tunneling current data exhibit an elongated hexagonal unit cell,<br />
which is assigned to surface Cu atoms (Fig. 1c). These measurements demonstrate the<br />
ability <strong>of</strong> multi-dimensional, atomic-resolution scanning probe microscopy to identify<br />
adsorption sites on oxide surfaces.<br />
Figure 1: a) Model <strong>of</strong> the (2√2 ×√2) R45 o O-induced reconstruction <strong>of</strong> Cu(100). The grey balls<br />
represent O, the light orange surface Cu, and the darker orange second layer Cu. b) NC-AFM<br />
image acquired with a frequency shift <strong>of</strong> -0.95 Hz at T = 6 K and c) simultaneously acquired<br />
tunneling current image collected at a sample bias <strong>of</strong> -0.4 V.<br />
[1] M. C. Asensio et al, Surf. Sci. 236, 1 (1990).<br />
[2] B. J. Albers et al, Rev. Sci Instrum. 79, 033704 (2008).<br />
150
nc-AFM Investigations <strong>of</strong> Metal Nanoclusters on α-alumina<br />
P.II-23<br />
K Venkataramani 1 , M C R Jensen 1 , M Reichling 2 , F Besenbacher 1 , and J V Lauritsen 1<br />
1 Interdisciplinary Nanoscience Center (iNANO), Department <strong>of</strong> Physics, Aarhus University, Denmark<br />
2 Department <strong>of</strong> Physics, University <strong>of</strong> Osnabrück, Germany<br />
AFM operated in the non-contact mode has proved very successful in imaging insulating<br />
surfaces with atomic resolution and recently has also proved the capability to image<br />
supported nanoclusters. Insight from studies <strong>of</strong> such systems may be important for a<br />
better and much needed understanding <strong>of</strong> heterogeneous catalysis, since most catalysts<br />
consists <strong>of</strong> nanoclusters dispersed on insulating metal oxide substrate. It is well known<br />
that while imaging nanoclusters with nc-AFM, the tip apex is one <strong>of</strong> the main limiting<br />
factors in the topography imaging mode i.e. constant detuning mode (Z) but a<br />
complementary scanning mode, the constant height mode (df), has surprisingly been<br />
shown to give a more precise estimation <strong>of</strong> lateral cluster shape [1]. In this study, using<br />
nc-AFM, we present high resolution topography images <strong>of</strong> Cu nanoclusters supported on<br />
clean (Fig. 1(a)) and pre-hydroxylated α-Al2O3(0001) surfaces and can thereby report in<br />
great detail on cluster growth, thermal stability and morphology. Further, by scanning in<br />
constant height mode, we obtained high quality images <strong>of</strong> the top (111) facet <strong>of</strong> Cu<br />
nanoclusters revealing a clear hexagonal shape (Fig. 1(b)). This equilibrium shape<br />
determined solely from AFM can be related to the adhesion energy (Eadh) by the equation<br />
derived from the Wulff-Kaichew reconstruction (Fig. 1(c)) [2], which gives an<br />
understanding <strong>of</strong> the strong cluster-substrate binding. Further, this study was extended to<br />
investigate the growth <strong>of</strong> Ni nanoclusters and our initial results revealed nanoscale<br />
ordering <strong>of</strong> Ni clusters at room temperature.<br />
Figure 1: (a) Topography image <strong>of</strong> supported Cu nanoclusters on α-Al2O3(0001) surface. (b) Cu<br />
clusters imaged in constant height mode. (c) Schematic representation <strong>of</strong> Wulff-Kaichew<br />
reconstruction and the equation relating free energy <strong>of</strong> cluster facet (γmetal(i)) with Eadh.<br />
[1] C. Barth, O. H. Pakarinen, et al. Nanotechnology 17, S128-S132 (2006).<br />
[2] C. R. Henry. Surface Science Reports 31, 231-325 (1998).<br />
151
Atom-resolved AFM studies <strong>of</strong> the polar MgAl2O4 (001) surface<br />
Morten K. Rasmussen, Jeppe V. Lauritsen, and Flemming Besenbacher<br />
Interdisciplinary Nanoscience Center (iNANO), University <strong>of</strong> Aarhus, Denmark<br />
P.II-24<br />
Magnesium-aluminate spinel (MgAl2O4) has many interesting properties and<br />
applications, among other things the use as a support for catalysts. In particular, MgAl2O4<br />
in a porous form is a support material for the important Ni-based catalyst used for steam<br />
reforming <strong>of</strong> methane, which today is the most common method <strong>of</strong> producing bulk<br />
hydrogen. A study <strong>of</strong> the clean spinel is thus <strong>of</strong> very great importance to understand the<br />
role <strong>of</strong> the support, and still almost no surface science studies on the MgAl2O4 surface<br />
have been presented due to the insulating nature <strong>of</strong> the material. When constructing a<br />
surface model one must consider the fact that the spinel (001) surface is polar and the<br />
surface consequently has to be modified somehow to cancel out or compensate for this.<br />
Additionally, it is well known that the AFM tip can pick up material from the surface,<br />
and this material then can change the polarity <strong>of</strong> the nano-apex which leads to variations<br />
in the AFM contrast seen in atom-resolved images and reveals the individual sub lattices<br />
[1, 2]. In this study we observe from atom-resolved AFM images that the MgAl2O4 (001)<br />
surface may be imaged in two distinctly different contrast modes revealing the anion or<br />
cation sub-lattice. Tentative structural characterizations from the AFM studies suggest a<br />
stoichiometric bulk like termination. Stabilization mechanism may then include<br />
relaxations in the crystal structure below the topmost layer which cannot be probed by<br />
AFM, hence surface x-ray diffraction is used to complement the AFM data.<br />
a) b)<br />
Figure 1: (a) Atom resolved non-contact AFM image (4nm×4nm) <strong>of</strong> the clean MgAl2O4 (001)<br />
surface imaged under UHV conditions together with (b) a ball model <strong>of</strong> the surface. The surface<br />
appears to be Mg-terminated and near stoichiometric with a low atomic defect density less than<br />
0.1ML.<br />
[1] Lauritsen, J.V., et al., Chemical identification <strong>of</strong> point defects and adsorbates on a metal oxide<br />
surface by atomic force microscopy. Nanotechnology, 2006. 17(14): p. 3436.<br />
[2] Enevoldsen, G.H., et al., <strong>Noncontact</strong> atomic force microscopy studies <strong>of</strong> vacancies and hydroxyls<br />
<strong>of</strong> TiO[sub 2](110): Experiments and atomistic simulations. Physical Review B (Condensed<br />
Matter and Materials Physics), 2007. 76(20): p. 205415-14.<br />
152
P.II-25<br />
Contrast formation on cross-linked (1x2) reconstructed titania (110)<br />
Hans H. Pieper 1 , Stefan Torbrügge 1,2 , Stephan Bahr 1,2 , Krithika Venkataramani 1,3 ,<br />
Angelika Kühnle 1 and Michael Reichling 1<br />
1 Fachbereich Physik, Universität Osnabrück, Barbarastraße 7, 49076 Osnabrück, Germany<br />
2 present address: SPECS GmbH, Voltastrasse 5, 13355 Berlin, Germnay<br />
3 present address: iNano, Aarhus University, DK-8000 Aarhus C, Denmark<br />
In NC-AFM imaging, the tip structure plays a prominent role in atomic contrast<br />
formation. It is, for instance, possible to image the cationic or the anionic sub-lattice <strong>of</strong><br />
CaF2(111) by changing the tip termination [1]. For the unreconstructed rutile TiO2 (110)<br />
at least a third mode is known [2].<br />
Here, we investigate the cross-linked (1x2) surface reconstruction <strong>of</strong> rutile<br />
TiO2(110), which has been studied both with STM and NC-AFM, however, the atomic<br />
structure is still discussed controversially. We present NC-AFM results, which will be<br />
interpreted with respect to tip termination and tip-surface distance. A comparison with<br />
existing models provides strong evidence for one <strong>of</strong> these models.<br />
Figure 1: Three consecutive images <strong>of</strong> the cross-linked (1x2) titania surface taken with different<br />
tip terminations. The left image is taken with a positive tip termination. A contact with the sample<br />
leads to a negative tip termination (middle image). The tip in the right picture is unidentified.<br />
Figure 2: High resolution measurements are in good agreement with the surface model suggested<br />
by Bennett [3] as shown to the right.<br />
[1] C. Barth et al. J. Phys.: Condens. Matter 13, 2061 (2001)<br />
[2] G.H. Enevoldsen et al. Phys. Rev. B 76, 205415 (2007)<br />
[3] R.A. Bennett et al. Phys. Rev. Lett. 82, 3831 (1999)<br />
153
P.II-26<br />
Nano volcanoes – the surface structure <strong>of</strong> antimony-doped TiO2(110)<br />
Ralf Bechstein 1,2 , Mitsunori Kitta 3 , Jens Schütte 1 , Hiroshi Onishi 3 , and Angelika Kühnle 1<br />
1 Fachbereich Physik, Universität Osnabrück, Barbarastraße 7, 49076 Osnabrück, Germany<br />
2 present address: iNano, Aarhus University, DK-8000 Aarhus C, Denmark<br />
3 Department <strong>of</strong> Chemistry, Kobe University, Rokko-dai, Nada-ku, Kobe 657-8501, Japan.<br />
Titanium dioxide constitutes a very prominent and widely used example <strong>of</strong> a wide band<br />
gap photocatalyst [1]. Upon codoping with chromium and antimony, rutile titania has<br />
shown photocatalytic activity under irradiation with visible-light. The reactivity has been<br />
found to be optimized in slight excess <strong>of</strong> antimony. Even larger antimony excess has<br />
been observed to again result in reduced photocatalytic activity [2].<br />
Here, we address the role <strong>of</strong> excess antimony in chromium and antimony codoped titania<br />
by studying the influence <strong>of</strong> antimony on the surface structure <strong>of</strong> rutile TiO2(110) using<br />
high-resolution NC-AFM. All findings draw a picture <strong>of</strong> weakly integrated antimony in<br />
antimony-doped titania indicating why an excess <strong>of</strong> antimony beyond the optimum ratio<br />
is unfavourable for photocatalytic applications. Moreover, the presented study revealed<br />
another interesting phenomenon: It seems to be possible to create nano-sized holes with<br />
depths ranging from a few up to more than hundred monatomic steps in a controlled way<br />
by tuning the annealing parameters <strong>of</strong> antimony-doped TiO2(110) [3]. This might be an<br />
appropriate strategy for creating nano-patterned surfaces with macroscopic techniques.<br />
(a) (b)<br />
Figure 1: NC-AFM topography images <strong>of</strong> antimony-doped TiO2(110) obtained after annealing at<br />
1100 K. Holes with a diameter <strong>of</strong> about 50 nm and a depth <strong>of</strong> more than 30 nm are created (a).<br />
Typically, the holes are surrounded by small islands (b). This results in an appearance that<br />
resembles a volcano-like shape.<br />
[1] A. Fujishima, X. Zhang, and D. A. Tryk, Surf. Sci. Rep. 63, 515 (2008).<br />
[2] H. Kato and A. Kudo, Catal. Today 78, 561 (2003).<br />
[3] R. Bechstein et al., submitted to Nanotechnology (2009).<br />
154
P.II-27<br />
Non-contact scanning nonlinear dielectric microscopy imaging <strong>of</strong> TiO2<br />
Nobuhiro Kin and Yasuo Cho<br />
(110) surfaces<br />
Research Institute <strong>of</strong> Electrical Communication, Tohoku University, Sendai, Japan<br />
Scanning nonlinear dielectric microscopy (SNDM) is a pure electrical method that is<br />
used for detecting the local anisotropy <strong>of</strong> dielectric materials and measuring ferroelectric<br />
polarization with sub-nanometer resolution [1]. Recently, we have developed non-contact<br />
SNDM (NC-SNDM) with a height control technique that makes use <strong>of</strong> the detection <strong>of</strong> a<br />
higher-order nonlinear dielectric constant (ε (4) signal). We have already succeeded in<br />
observing the typical Si (111) 7 × 7 atomic structure [2]. An interesting potential future<br />
application <strong>of</strong> NC-SNDM is in the imaging <strong>of</strong> insulating materials such as TiO2, SrTiO3<br />
(STO), Al2O3, SiO2, and MgO. It is well known that TiO2 becomes an n-type<br />
semiconductor after high-temperature annealing under ultra-high vacuum conditions. Due<br />
to its simplicity, the atomic structure <strong>of</strong> TiO2 can be examined easily as compared to that<br />
<strong>of</strong> other materials such as STO, which comprises three types <strong>of</strong> atoms. Moreover, TiO2<br />
has been studied extensively because it is well known and widely used as a superior<br />
substrate for catalysts. Therefore, in this study, we selected TiO2 (110) as our initial<br />
specimen for investigating insulating materials. We have demonstrated that atomresolved<br />
images <strong>of</strong> a TiO2 (110) surface can be obtained by NC-SNDM. Considering<br />
both the topography and the electrical dipole moment (ε (3) image) [2], the parallel bright<br />
stripes in the [001] direction should correspond to Ti 4+ . The protrusion on the bright<br />
stripes corresponds to Ti 3+ , and the other protrusion on the dark rows corresponds to H +<br />
due to water. It should be noted that there exist other possibilities; these will be analyzed<br />
in detail in the future.<br />
a) b)<br />
Figure 1: (a) NC-SNDM image <strong>of</strong> TiO2 (110) recorded using the ε (4) signal as feedback. The<br />
scan resolution is 30 nm × 30 nm. (b) STM image <strong>of</strong> TiO2 (110) having the same scan resolution.<br />
A positive voltage <strong>of</strong> 1.2 V is applied to the bottom <strong>of</strong> the sample.<br />
[1] Y. Cho, A. Kitahara, and T. Saeki. Rev. Sci. Instrum. 67, 2297 (1996).<br />
[2] Y. Cho and R. Hirose. Phys. Rev. Lett. 99, 186101 (2007).<br />
155
156<br />
P.II-28<br />
Characterizations <strong>of</strong> Carbon Material by Non-contact Scanning<br />
Non-linear Dielectric <strong>Microscopy</strong><br />
Shin-ichiro Kobayashi and Yasuo Cho<br />
Research Institute <strong>of</strong> Electrical Communication, Tohoku University, Sendai , Japa<br />
Recently a new and uniquely promising technique, the "non-contact scanning<br />
non-linear dielectric microscopy" (NC-SNDM) was introduced [1,2]. Since this technique has<br />
high sensitivity to variations in the capacitance, we were able to use it to visualize the domain<br />
structure in ferroelectric or carrier in flash memory. The graphite or fullerene (C60) are paied to<br />
attention because <strong>of</strong> the unique properties and the candidate <strong>of</strong> high performance device. In this<br />
study, we present SNDM images <strong>of</strong> the graphite (HOPG) and C60 on Si(111)-7x7 (7x7) surface<br />
by the NC-SNDM to understand the properties <strong>of</strong> carbon materials with new viewpoint. C60<br />
thin-film on 7x7 surfaces were fabricated by the deposition method under the ultra high vacuum<br />
Feedback signal to observe topography or SNDM images was utilized by 2ω amplitude signal.<br />
Figure 1 shows ω amplitude image <strong>of</strong> HOPG. The contrast is inverted to make easily<br />
to understand the image. The clear honeycomb structure is observed. In addition, the three<br />
saddle points in the single hexisagonal ring are also recognized. This means that the NC-SNDM<br />
can detect the A or B site originated from the difference <strong>of</strong> the band structure. These results are<br />
similar to those <strong>of</strong> the STM. This indicates that the origin <strong>of</strong> the SNDM signal for the HOPG is<br />
similar to that <strong>of</strong> the STM. Figure 2 shows the topography <strong>of</strong> C60 for 1ML on 7x7 surface. The<br />
insert is the expanded image <strong>of</strong> Fig. 2. As<br />
is seen from the insert, the internal<br />
structures in some C60 molecules by the<br />
NC-SNDM are observed. This structure is<br />
similar to the charge distribution for the<br />
LUMO orbital. Furthermore, investigating Figure 1 The ω amplitude image for HOPG the<br />
phase reversal in ω phase image for<br />
various coverage <strong>of</strong> C60 on 7x7 surface, we<br />
could guess the characterization <strong>of</strong> the<br />
bonding between C60 and 7x7 surface. The<br />
details <strong>of</strong> the observed SNDM images are<br />
described in the presentation.<br />
[1]R. Hirose, K.Ohara and Y. Cho, Figure 2 Topography <strong>of</strong> C60 on 7x7 surface for 1ML<br />
Nanotechnology. 18 (2007), p084014. [2] Y. Cho and R. Hirose, PRL 99 (2007), p186101.
P.II-29<br />
Local Dielectric Spectroscopy <strong>of</strong> Nanocomposite Materials Interfaces<br />
M. Labardi 1 , D. Prevosto 1 , S. Capaccioli 1,2 , M. Lucchesi 1,2 and P.A. Rolla 1,2<br />
1 INFM-CNR, LR polyLab, Largo Pontecorvo 3, 56127 Pisa, Italy<br />
2 Dipartimento di Fisica, Università di Pisa, Largo Pontecorvo 3, 56127 Pisa, Italy.<br />
Dielectric spectroscopy (DS) has revealed especially successful to disclose structural<br />
properties <strong>of</strong> polymeric materials, like e.g. their glass transition and structural relaxation<br />
phenomena. Local probe DS [1] combines the high spatial resolution <strong>of</strong> frequency<br />
modulation electrostatic force microscopy (FM-EFM) with the physical insight typical <strong>of</strong><br />
DS, being firstly demonstrated on homogeneous poly-vinyl-acetate (PVAc) films under<br />
vacuum [1]. In essence, a sinusoidal potential at frequency fmod is applied to a conductive<br />
probe and the induced modulation <strong>of</strong> the resonant frequency shift Δfres is measured by<br />
dual-phase lock-in technique, referenced at 2fmod. Phase delay indicates dielectric loss due<br />
to polarization relaxation occurring with characteristic time τR ~ 1/ fmod [1].<br />
We apply local DS to address the influence <strong>of</strong> inorganic inclusions on structural<br />
relaxation <strong>of</strong> polymers. A PVAc thin film (30 nm) with a dispersion <strong>of</strong> a layered silicate<br />
(montmorillonite, MMT) was spin-coated onto Au, and partially scratched away to<br />
expose the metal, to obtain a reference surface (Fig. 1a). Presence <strong>of</strong> inorganic layers on<br />
the surface is evident from the TappingMode TM phase image (Fig. 1b). Conventional FM-<br />
EFM (Veeco Lift mode TM in controlled atmosphere [2] and temperature) shows materials<br />
contrast (Fig. 1c), independent <strong>of</strong> T. In Fig. 1d-f, dielectric loss maps at T = 50, 60, 70°C<br />
show highest contrast at T = 60°C for the used fmod = 130 Hz, corresponding to τR ~ 7-8<br />
ms. Dielectric contrast at inclusions can also be studied (Fig. 1e, arrow).<br />
Financial support from INFM-CNR “Seed 2007” project is acknowledged.<br />
Figure 1: a) Topography <strong>of</strong> a PVAc/MMT thin film (left) on Au (right). b) Phase image showing<br />
the location <strong>of</strong> inorganic layers (arrow). c) Δfres map. d)-f) Dielectric loss maps at T = 50,60,70°C.<br />
[1] P.S. Crider, M.R. Majewski, J. Zhang, H. Oukris, N.E. Israel<strong>of</strong>f, Appl. Phys. Lett. 91, 013102 (2007).<br />
[2] M. Lucchesi, G. Privitera, M. Labardi, D. Prevosto, S. Capaccioli, P. Pingue, J. Appl. Phys. 105,<br />
054301 (2009).<br />
157
P.II-30<br />
Probing Local Bias-Induced Phase Transitions on the Single Defect<br />
Level: from Imaging to Deterministic Mechanisms<br />
N. Balke 1 , S. Jesse 1 , P. Maksymovych 1 , Y.H. Chu 2 , R. Ramesh 2 , S. Choudhury 3 , L.Q.<br />
Chen 3 , and S.V. Kalinin 1<br />
1 Oak Ridge National Laboratory, Oak Ridge, TN 37831<br />
2 Dept. <strong>of</strong> Physics and Dept. <strong>of</strong> Mat. Sci. and Eng., University <strong>of</strong> California, Berkeley, CA<br />
3 Dept. <strong>of</strong> Mat. Sci. and Eng., Pennsylvania State University, University Park, PA 16802<br />
<strong>Force</strong>-induced processes such a molecular unfolding spectroscopy and NC-AFM<br />
atomic manipulation now underpin many areas <strong>of</strong> physics and biology. Here, I discuss<br />
recent progress on probing local bias-induced phase transitions in ferroelectrics and<br />
electrochemical systems. Bias-induced phase transitions are controlled by structural<br />
defects that act both as the local nucleation centers and the pinning centers for moving<br />
domain walls. Future progress necessitates understanding <strong>of</strong> polarization switching<br />
mechanisms on the single structural or morphological defect level. In this talk, I will<br />
present results on local studies <strong>of</strong> polarization reversal mechanisms in ferroelectrics [1-2].<br />
The direct imaging <strong>of</strong> a single nucleation center on the sub-100 nanometer level is<br />
demonstrated [3]. By using switching spectroscopy Piezoresponse <strong>Force</strong> <strong>Microscopy</strong> on<br />
systems with engineered defect structures and phase-field modeling, we demonstrate that<br />
deterministic that mesoscopic polarization switching mechanisms on single 1D and 2D<br />
defects can be determined. We develop a framework to link the modeling results to<br />
experimental observations using neural-network based recognition. The future potential<br />
for atomistic studies is discussed. Research was supported by the U.S. Department <strong>of</strong><br />
Energy Office <strong>of</strong> Basic Energy Sciences Division <strong>of</strong> Scientific User Instruments and was<br />
performed at Oak Ridge National Laboratory which is operated by UT-Battelle, LLC.<br />
Figure 1: (a) Surface topography and (b) SS-PFM nucleation bias map <strong>of</strong> BiFeO3 24deg (100)<br />
bicrystal grain boundary (GB). Each point in (b) is a hysteresis loop. (c) Ferroelectric switching<br />
properties across the interface.<br />
[1] S.V. Kalinin, B.J. Rodriguez, S. Jesse, Y.H. Chu, T. Zhao, R. Ramesh, E.A. Eliseev, and A.N.<br />
Morozovska, PNAS 104, 20204 (2007).<br />
[2] S. Jesse, B.J. Rodriguez, A.P. Baddorf, I. Vrejoiu, D. Hesse, M. Alexe, E.A. Eliseev, A.N. Morozovska,<br />
and S.V. Kalinin, Nature Materials 7, 209 (2008).<br />
[3] S.V. Kalinin, S. Jesse, B.J. Rodriguez, Y.H. Chu, R. Ramesh, E.A. Eliseev and A.N. Morozovska, Phys.<br />
Rev. Lett. 100, 155703 (2008)<br />
158
P.II-31<br />
Polarization-dependent electron tunneling into ferroelectric surfaces<br />
Peter Maksymovych 1 , Stephen Jesse 1 , Pu Yu 2 , Ramamoorthy Ramesh 2 , Arthur P.<br />
Baddorf 1 , Sergei V. Kalinin 1<br />
1 Center for Nanophase Materials Sciences, Oak Ridge National Laboratory<br />
2 Department <strong>of</strong> Physics and Dept. <strong>of</strong> Materials Science, University <strong>of</strong> California, Berkeley<br />
Electron tunneling underlies the operation <strong>of</strong> numerous devices relevant to<br />
information technology and has been proposed in futuristic applications for energy<br />
harvesting and quantum computing. Replacing a conventional insulator in the tunnel<br />
junction with electronically correlated materials can yield new types <strong>of</strong> electronic<br />
functionality. In one such concept, dubbed ferroelectric tunneling, the tunneling barrier<br />
height is controlled by the polarization <strong>of</strong> a ferroelectric oxide, enabling non-volatile<br />
conduction states that can be switched with electric field. Although ferroelectric<br />
tunneling has been a recent focus <strong>of</strong> a number <strong>of</strong> theoretical studies, aiming to unveil the<br />
interfacial behaviors <strong>of</strong> the ferroelectric order parameter, a convincing experimental<br />
demonstration <strong>of</strong> this phenomenon has been lacking. The key challenges are to find a<br />
material system that simultaneously satisfies the dimensional constraints for tunneling<br />
and ferroelectricity, as well as to assure that the conductance is not dominated by<br />
extrinsic effects due to charge injection and filamentary conduction, which is ubiquitous<br />
in complex oxides.<br />
In this talk we will demonstrate a highly reproducible polarization control <strong>of</strong> local<br />
electron transport through thin Pb(Zr0.2Ti0.8)O3 film. Despite being 30 nm thick,<br />
conductive atomic force microscopy revealed that the film possessed spatially and<br />
temporally reproducible local conductivity. Fowler-Nordheim electron tunneling was<br />
identified as the conductance mechanism, likely enabled by strong electric field in the<br />
sub-surface region (excess <strong>of</strong> 10 6 V/cm) created by the relatively sharp metal tip. Local<br />
conductance exhibited strong hysteresis depending on the probed bias range. Using a<br />
newly-developed combination <strong>of</strong> piezoresponse force and conductive atomic force<br />
microscopy, we have, for the first time, directly correlated local events <strong>of</strong> ferroelectric<br />
and resistive switching [1]. The large polarization <strong>of</strong> the studied film resulted in as high<br />
as 500-fold enhancement <strong>of</strong> the FN-tunneling conductance upon ferroelectric switching,<br />
sufficient to demonstrate a local non-volatile memory function.<br />
The physical mechanism <strong>of</strong> the observed effect was traced to the polarizationdependence<br />
<strong>of</strong> the height and possibly width <strong>of</strong> the metal-ferroelectric Schottky barrier.<br />
Our measurements have thus extended a well-known polarization dependence <strong>of</strong> surfacepotential<br />
on ferroelectric materials from Kevlin probe force microscopy to demonstrate<br />
local control <strong>of</strong> electron transport through such materials. Variable-temperature<br />
measurements and local effects due to dielectric non-linearities will also be discussed.<br />
[1] P. Maksymovych, S. Jesse, P. Yu, R. Ramesh, A. P. Baddorf, S. V. Kalinin, Science (2009) in review.<br />
159
Local ferroelectric and magnetic investigations on<br />
multiferroic thin films<br />
P.II-32<br />
Ulrich Zerweck 1 , D. Köhler 1 , P. Milde 1 , Ch. Loppacher 2 , S. Geprägs 3 , S.T.B. Goennenwein<br />
3 , R. Gross 3 , L.M. Eng 1<br />
1 Institute <strong>of</strong> Applied Photophysics / Technische Universität Dresden, 01062 Dresden, Germany<br />
2 L2MP, Université Paul Cézanne, 13397 Marseille , France<br />
3 Walther-Meißner-Institut / Bayerische Akademie der Wissenschaften, 85748 Garching, Germany.<br />
Multiferroic materials, which combine ferroelectric and ferromagnetic properties, are<br />
promising candidates for novel nanoscale switching and memory devices, especially if<br />
there is a coupling between those properties.<br />
Here, we present low-temperature noncontact atomic force microscopy (nc-AFM) - in<br />
particular magnetic force microscopy (MFM) and Kelvin probe force microscopy<br />
(KPFM) - investigations <strong>of</strong> multiferroic BiCrO3 and BiFeO3 thin films prepared by<br />
pulsed laser deposition (PLD) as described in [1]. In addition to the nc-AFM<br />
investigations, piezoresponse force microscopy (PFM) was used to study the ferroelectric<br />
switching behaviour <strong>of</strong> the thin films.<br />
Although the separation <strong>of</strong> magnetic and ferroelectric properties is nontrivial due to the<br />
long range nature <strong>of</strong> both <strong>of</strong> the related forces, we were able to clearly separate the two<br />
different domain types by simultaneously running KPFM and MFM.<br />
[1] S. Geprägs et al., Phil. Mag. Lett. 87: 141 (2007).<br />
160
Magnetic Resonance <strong>Force</strong> <strong>Microscopy</strong> in Anisotropic Systems<br />
Thomas Fan and Vladimir I. Tsifrinovich 1<br />
1 Department <strong>of</strong> Physics, Polytechnic Institute <strong>of</strong> NYU, Brooklyn, USA<br />
161<br />
P.II-33<br />
We have developed theory for the detection <strong>of</strong> a single spin S≥1 using magnetic<br />
resonance force microscopy (MRFM), a subset <strong>of</strong> atomic force microscopy. The<br />
anisotropy caused by the crystalline field is taken into account. The MRFM signal (i.e.<br />
the frequency shift <strong>of</strong> the cantilever vibrations) in the oscillating cantilever-driven<br />
adiabatic reversals technique is computed using a semi-classical approach: the spin is<br />
treated quantum mechanically, and the cantilever vibrations classically. We have shown<br />
that the MRFM signal for spin S≥1 is the same as for the spin S=1/2. We have obtained<br />
the analytical estimate for the half-width <strong>of</strong> the MRFM signal.
P.II-34<br />
Sub-10 nm resolution in Magnetic <strong>Force</strong> <strong>Microscopy</strong> (MFM) at ambient conditions<br />
Ö. Karcı 1,2 , H. Atalan 1 , M. Dede 1 , Ü. Çelik 3 , A.Oral 4<br />
1 NanoMagnetics Instruments Ltd., 266 Banbury Road, Oxford OX2 7DL, UK.<br />
2 Hacettepe University, Department <strong>of</strong> Nanoscience & Nanomedicine, Beytepe, Ankara,<br />
Turkey<br />
3 Istanbul Technical University, Department <strong>of</strong> Material Science, Istanbul, Turkey<br />
4 Sabanci University, Faculty <strong>of</strong> <strong>Engineering</strong> & Natural Sciences, 34956 Istanbul, Turkey<br />
aoral@sabanciuniv.edu<br />
We describe designs <strong>of</strong> high resolution Magnetic <strong>Force</strong> Microscopes, which can achieve<br />
better than 10 nm resolution in magnetic imaging even in ambient conditions. We<br />
developed two different MFMs, which can both achieve better than 10 nm lateral<br />
resolution, using commercially available, <strong>of</strong>f the shelf, magnetically coated cantilevers.<br />
Both MFMs have been optimized to have low noise, using RF modulation <strong>of</strong> the laser<br />
diode. One <strong>of</strong> the instruments is designed for low temperature use, 300 mK-300 K using<br />
low noise fiber optic interferometer & alignment free cantilevers. The other MFM is<br />
designed to operate in ambient conditions and employ a beam deflection pickup with<br />
optimized noise performance. Both MFMs can also be operated in bimodal operation,<br />
using first and second resonance <strong>of</strong> the magnetically coated cantilever for topography and<br />
magnetic contrast. One <strong>of</strong> the typical images obtained at ambient conditions with the<br />
MFMs on Seagate’s 394 Gbpsi harddisk is given below.<br />
162
P.II-35<br />
Enhancement <strong>of</strong> the Exchange-bias Effect based on Quantitative<br />
Magnetic <strong>Force</strong> <strong>Microscopy</strong> Results.<br />
N. Pilet 1 , M.A. Marioni 1 , S. Romer 1 , N. Joshi 2 , S. Özer 2 and H.J. Hug, 1,2<br />
1 Empa, Swiss Federal Institute for Materials Testing and Research, CH-8600 Duebendorf, Switzerland,<br />
2 Department <strong>of</strong> Physics, University <strong>of</strong> Basel, Klingelbergstrasse 82, CH-4056 Basel, Switzerland<br />
Exchange biasing (EB) causes a lateral shift <strong>of</strong> the magnetization vs. field curve in<br />
antiferromagnetic-ferromagnetic (AF-F) thin-film structures. It is largely believed that<br />
EB arises from linking the magnetization <strong>of</strong> the F to that <strong>of</strong> (pinned) uncompensated<br />
spins (UCS) in the AF. In the present work we are able to measure the local density <strong>of</strong><br />
UCS on the scale <strong>of</strong> 20 nm, using quantitative magnetic force microscopy (qMFM). With<br />
quantitative results at this lateral resolution, it becomes possible to resolve and measure<br />
the UCS underneath each F domain at scales comparable to the grain size. The average<br />
density <strong>of</strong> UCS around 20% <strong>of</strong> that expected for a full monolayer <strong>of</strong> spins is considerably<br />
higher than expected from the measured exchange field and local values may reach<br />
100%. We found that UCSs coupling antiparallel to the F magnetization stabilize its<br />
orientation, i.e. they are biasing [1,2]. Locally, UCS oriented parallel to the F<br />
magnetization were found. These have an antibiasing effect and are hence expected to<br />
weaken the exchange field. We hypothesized that such anti-biasing arises from<br />
conflicting exchange interaction between the F-layer and AF-grains, and between AFgrains<br />
themselves. Exchange-bias systems grown with suppressed inter-granular coupling<br />
in the AF-layer proved our hypothesis to be correct. These systems showed an exchangebias<br />
effect enhanced by 20%. High resolution MFM revealed a more homogenous pattern<br />
<strong>of</strong> UCS with a correspondingly higher density. The evolution <strong>of</strong> the F-domains in an<br />
applied field was strikingly different.<br />
Figure 1: . (A) UCS density calculated from measured MFM data and the instrument calibration<br />
function. Positive UCS (i.e. parallel to the cooling field) are colored yellow, negative UCS red.<br />
(B) UCS with overlayed contours <strong>of</strong> the F domains at H = 0; (C) Idem for H = 200mT. With few<br />
exceptions (such as pointed out by the arrows) the UCS align antiparallel to the domain<br />
magnetization at H=0.<br />
[1] I. Schmid, P. Kappenberger, O. Hellwig, M. Carey, E. Fullerton and H. J. Hug, EPL 81 (2008) 17001<br />
[2] I. Schmid, M. Marioni et al. submitted.<br />
163
Author<br />
Index<br />
164
Abe M. 51,58,92,141 Clerk A. A. 78<br />
Adachi H. 141 Cockins L. 78<br />
Ahn C. 109 Cuberes M. T. 125<br />
Albers B. J. 62 Dalvit D. 33<br />
Albonetti C. 69 Dalvit D. A. R. 43<br />
Altman E. I. 62,150 Danza, R. 76<br />
Amijs C. H. 130 de Boer M. P. 35<br />
Andrews K. M. 111 de Hosson J. Th. M. 42<br />
Annibale P. 137 de Man S. 39<br />
Aoki H. 129 Debierre J. M. 68<br />
Arai T. 94,114,118 Dede M. 162<br />
Asakawa H. 46,147 DelRio F. W. 35<br />
Ashino M. 64 Deresmes D. 105,106<br />
Atalan H. 162 Diesinger H. 105,106<br />
Baddorf A. P. 116,159 Dietz C. 89<br />
Bahr S. 153 Ding X. D. 103<br />
Balke N. 116,158 Duden T. 131<br />
Bao Y. 41 Ebeling D. 49<br />
Barat<strong>of</strong>f A. 54,74,75,95,96,130 Ebner A. 137<br />
Baykara M. Z. 62,150 Echavarren A. M. 130<br />
Bechstein R. 60,66,148,154 Elias G. 104<br />
Bennett S. D. 78 Eng L. M. 55,86,102,136,160<br />
Berber S. 64 Esquivel-Sirvent R. 32<br />
Besenbacher F. 151,152 Falter J. 109.112<br />
Bettac A. 80 Fan T. 161<br />
Binns C. 40 Feltz A. 80<br />
Biscarini F. 69,137 Ferrini G. 97<br />
Boag A. 104 Foster A. 100<br />
Bocquet F. 68,100 Fremy S. 67<br />
Borowik L. 106 French R. H. 29<br />
Braun D. A. 73,112 Freund H. J. 57<br />
Brugger T. 101 Fuchs H. 49,73,112<br />
Campbellova A. 71 Fukui K. 90<br />
Canetta C. 99 Fukuma T. 45,46,115,147<br />
Capaccioli S. 157 Gangopadhyay, S. 76<br />
Cavero-Pelaez, I. 31 Garcia R. 69,89,126,137<br />
Celik U. 162 Gepraegs S. 160<br />
Chan H. B. 41 Giessibl F. J. 72,77<br />
Chawla G. 119 Gimzewski J. K. 146<br />
Chen L. Q. 158 Glatzel Th. 54,74,75,95,96,101,104,127,130<br />
Chen, G. 38 Goennenwein S. T. B. 160<br />
Chevrier J. 37 Gomez C. J. 69<br />
Ching W. Y. 29 Gonzalez C. 59<br />
Cho Y. 155,156 Gottlieb O. 121<br />
Choi B. Y. 131 Grafstroem S. 86<br />
Choudhury S. 158 Graham N. 30<br />
Chu Y. H. 158 Greffet J-J. 37<br />
Cirelli R. A. 41 Gross L. 77,127<br />
165
Gross R. 160 Kitta M. 60,154<br />
Grutter P. 78 Kiyohara K. 94<br />
Gu N. 38,99 Klapetek P. 71<br />
Hane F. 102 Klemens F. 41<br />
Harada M. 48 Klocke M. 123<br />
Haubner K. 136 Kobayashi D. 87<br />
Heeck K. 39 Kobayashi K. 47,84,85,88,118,122,140,141<br />
Heinrich A. J. 72 Kobayashi N. 143<br />
Helm M. 86 Kobayashi S. 156<br />
Herruzo E. T. 89 Koch S. 54,74,75,95,96,101,127,130<br />
Heyde M. 57 Kokawa R. 118,141,145<br />
Hinterdorfer P. 137 Köhler D. 136,160<br />
Hirade M. 118 König T. 57<br />
Hirata Y. 88 Kusiaku K. 106<br />
Hosokawa Y. 84 Kurachi S. 144<br />
H<strong>of</strong>fman J. E. 110 Kuroda M. 145<br />
H<strong>of</strong>fman P. M. 98 Kushida S. 94<br />
H<strong>of</strong>fman R. 55 Kühnle A. 60,66,133,134,148,153,154<br />
H<strong>of</strong>mann T. 72 Labardi M. 157<br />
Hori K. 114 Laemmle K. 67<br />
Hornstein S. 121 Lamoreaux S. K. 43<br />
Hölscher H. 49,55,112 Lange M. 113<br />
Hug H. J. 163 Langer M. 101<br />
Huston S. M. 111 Langewisch G. 73<br />
Iannuzzi D. 39 Lau M. W. 135<br />
Ido S. 47,88 Lauritsen J. V. 151,152<br />
Imai T. 47 Leonenko Z. 102<br />
Inoue T. 141 Li Y. 82,120<br />
Itaya K. 129 Li Y. J. 52,143,144,149<br />
Jacob R. 86 Liebmann M. 109<br />
Jaehne E. 136 Liljeroth P. 77<br />
Jelinek P. 59,63,71 Liu Y. 135<br />
Jensen M. C. R. 151 Lobo-Checa J. 101<br />
Jeong Y. 118,142 Loppacher Ch. 68,100,160<br />
Jesse S. 116,117,158,159 Losilla N. S. 137<br />
Joshi N. 163 Loske F. 133<br />
Kageshima M. 52,82,120,143,144,149 Lozano J. R. 89<br />
Kalinin S. V. 116,117,158,159 Lucchesi M. 157<br />
Karci O. 162 Lutz C. P. 72<br />
Kawai S. 54,74,75,95,96,101,127,130 Lux-Steiner M. Ch. 61<br />
Kawai T. 138 Ma Z. 82,120<br />
Kawakatsu H. 87 Maass P. 133<br />
Khlobystov A. N. 64 Maeda Y. 138<br />
Kim J. 110 Maksymovych P. 116,158,159<br />
Kim W. J. 43 Malegori G. 97<br />
Kimura K. 47 Mansfield W. M. 41<br />
Kin N. 155 Marioni M. A. 163<br />
Kinoshita Y. 52,149 Martinez J. 126<br />
166
Martinez N. F. 69 Parashar P. 31<br />
Martinez R. V. 126 Parsegian A. 29,53<br />
Masago A. 93 Pawlak R. 68<br />
Matsamura H. 141 Pearl T. P. 111<br />
Matsumoto T. 138 Perez R. 59,65,69,71<br />
Matsushige K. 84,85,88,122,140 Pieper H. H. 153<br />
Melin T. 105,106 Pilet N. 62,109,163<br />
Mendoza P. 130 Podgornik R. 29<br />
Meyer E. 54,74,75,95,96,101,104,127,130 Poole P. 78<br />
Meyer G. 77,127 Port R. T. 111<br />
Milde P. 55,136,160 Porte L. 68<br />
Miller C. 139 Pou P. 65,71<br />
Milton K. A. 31 Pratama A. 58<br />
Minato T. 129 Preiner J. 137<br />
Mitani Y. 115 Prevosto D. 157<br />
Miyahara Y. 78 Prosenc M. 67<br />
Morita S. 51,58,92,141 Rahe P. 134,148<br />
Mohn F. 77 Rajter R. 29,34<br />
Moores B. 102 Ramesh R. 158,159<br />
Mori Y. 141 Rasmussen M. K. 152<br />
Moriarty P. 76 Rasool H. I. 146<br />
Morita K. 51,92 Reichling M. 66,151,153<br />
Möller R. 113 Repp J. 77<br />
Murai R. 141 Ribbeck H.-G. 86<br />
Murakami S. 141 Roca i Cabarrocas P. 106<br />
Nagashima K. 141 Rohlfing M. 66<br />
Naitoh Y. 52,82,120,143,144,149 Rolla P. A. 157<br />
Narayanaswami A. 99,38 Romer S. 163<br />
Nguyen-Tran T. 106 Rosenwalks Y. 104<br />
Nie H. Y. 135 Rousseau E. 37<br />
Nikiforov M. 117 Rozsival V. 63<br />
Nimmrich M. 134 Rychen J. 83<br />
Nishida S. 87 Sachrajda A. 78<br />
Nony L. 68,100 Sadewasser S. 61<br />
Nys J-P. 105 Salmeron M. 131<br />
Oesterhelt F. 49 Sasahara A. 118,142<br />
Ogawa T. 144 Sassi M. 68<br />
Ohta M. 141,145 Sato T. 94<br />
Oison V. 68 Satoh T. 149<br />
Okabe N. 87 Sawada D. 51,92<br />
Ondracek M. 63 Schaff O. 83<br />
Onishi H. 60,154 Schaffert J. 113<br />
Oral A. 162 Schirmeisen A. 50,73,112<br />
Ovchinnikov O. 116,117 Schlittler R. R. 127<br />
Oyabu N. 47,88,118,140,141 Schneider S. C. 86<br />
Ozer S. 163 Schütte J. 60,66,133,134,148,154<br />
Pai C. S. 41 Schwarz A. 67<br />
Palasantzas G. 42 Schwarz U. D. 62,109,112,150<br />
167
Schwendemann T. C. 62,150 Wagner T. 129<br />
Shajesh K. V. 31 Weiner D. 50,73<br />
Sharma S. 146 Welker J. 72<br />
Shavit A. 121 Wenzel M. T. 86<br />
Shen S. 38 Wiesendanger R. 64,67<br />
Shi Y. 131 Wijngaarden R. J. 39<br />
Shluger A. 79,132 Williamson R. 139<br />
Siber A. 29 Winnerl S. 86<br />
Simon G. H. 57 Wintjes N. 113<br />
Siria A. 37 Wojciech K. 69<br />
Solares S. D. 119 Wolf D. E. 123<br />
Someya T. 145 Wright C. A. 119<br />
Staffier P. 109 Wu W. 121<br />
Stara I. G. 134 Xu J. B. 103<br />
Studenikin S. A. 78 Yabuno H. 145<br />
Such B. 73,74,75,95,96,101,130 Yamada H. 47,84,85,88,118,122,140,141<br />
Sugawara Y. 82,120,143,144,149 Yamatani H. 118<br />
Sugimoto Y. 51,58,92 Yang D. Q. 135<br />
Sushkov A. 43 Yang J. 135<br />
Sutter P. 108 Yokota Y. 90<br />
Suzuki K. 47,140 Yu P. 159<br />
Svetovoy V. B. 42 Yurtsever A. 58<br />
Sweetman A. 76 Zahl P. 107,108<br />
Tagami K. 48 Zech M. 110<br />
Takahashi K. 143 Zerweck U. 55,86,136,160<br />
Takano K. 141 Zhang J. X. 103<br />
Tang H. X. 36 Zou J. 41<br />
Ternes M. 72 Zypman F. 124<br />
Theron D. 106<br />
Thornton S. 40<br />
Tomanek D. 64<br />
Tomitori M. 94,114,118,142<br />
Torbruegge S. 83,153<br />
Torricelli G. 40<br />
Trevethan T. 79,132<br />
Troeger L. 148<br />
Tsifrinovich V. I. 161<br />
Tsukada M. 48,88,93<br />
Tsunemi E. 85<br />
Ueda Y. 45,46<br />
Umeda K. 90<br />
van Zwol P. J. 42<br />
Venkataramani K. 151,153<br />
Wagner J. 31<br />
168
List <strong>of</strong><br />
Participants<br />
169
LastName FirstName Institution Email<br />
Altman Eric <strong>Yale</strong> University eric.altman@yale.edu<br />
Arai Toyoko Kanazawa University arai@staff.kanazawa-u.ac.jp<br />
Asakawa Hitoshi Kanazawa University hi_asa@staff.kanazawa-u.ac.jp<br />
Barat<strong>of</strong>f Alexis University <strong>of</strong> Basel alexis.barat<strong>of</strong>f@unibas.ch<br />
Baykara Mehmet <strong>Yale</strong> University mehmet.baykara@yale.edu<br />
Bechstein Ralf Aarhus University ralf@inano.dk<br />
Bernard Laetitia EMPA laetitia.bernard@empa.ch<br />
Bettac Andreas Omicon NanoTechnology a.bettac@omicron.de<br />
Borowik Lukasz Institut d'Electronique<br />
Microelectronique Nanotechnologie<br />
lbor@tlen.pl<br />
Braendlin Dominik Nanosurf AG braendlin@nanosurf.com<br />
Cannara Rachel National Institute <strong>of</strong> Standard and<br />
Technology<br />
rachel.cannara@nist.gov<br />
Celik Umit Istanbul Technical University umitcelik@itu.edu.tr<br />
Chan Ho Bun University <strong>of</strong> Florida hochan@phys.ufl.edu<br />
Chawla Gaurav University <strong>of</strong> Maryland College Park gchawla@umd.edu<br />
Cho Yasuo Tohoku University yasuocho@riec.tohoku.ac.jp<br />
Dalvit Diego LANL dalvit@lanl.gov<br />
de Boer Maarten Sandia National Labs mpdebo@sandia.gov<br />
de Man Sven VU University Amsterdam sdeman@nat.vu.nl<br />
Diesinger Heinrich Institut Elelectronique<br />
Microelectronique Nanotechnologie<br />
170<br />
heinrich.diesinger@isen.iemn.univlille1.fr<br />
Ding Xidong Sun Yat-sen University dingxd@mailsysu.edu.cn<br />
Ebeling Daniel University <strong>of</strong> Muenster Daniel.Ebeling@uni-muenster.de<br />
Esquivel-Sirvent Raul Universidad Nacional Autonoma de<br />
Mexico<br />
raul@fisica.unam.mx<br />
Faddis David Nanosurf Inc. faddis@nanosurf.com<br />
Falter Jens Westfallische Wilhelms-Universitaet<br />
Muenster<br />
JensFalter@Uni-Muenster.de<br />
Ferrini Gabriele University Cattolica gabriele@dmf.unicatt.it<br />
Fukui Ken-ichi Osaka University kfukui@chem.es.osaka-u.ac.jp<br />
Fukuma Takeshi Kanazawa University fukuma@staff.kanazawa-u.ac.jp<br />
Giessibl Franz University <strong>of</strong> Regensburg franz.giessibl@physik.uni-r.de<br />
Glatzel Thilo University <strong>of</strong> Basel Thilo.Glatzel@unibas.ch<br />
Gomez Carlos IMM - CSIC carlos@imm.cnm.csic.es<br />
Graham Noah Middlebury College ngraham@middlebury.edu<br />
Gross Leo IBM Research lgr@zurich.ibm.com<br />
Grutter Peter McGil University grutter@physics.mcgill.ca<br />
Hafizovic Sadik Zurich Instruments sadik.hafizovic@zhinst.com<br />
Heer Flavio Zurich Instruments flavio.heer@zhinst.com<br />
Heyde Markus Fritz-Haber-Institute <strong>of</strong> the Max-<br />
Planck-Society<br />
heyde@fhi-berlin.mpg.de<br />
H<strong>of</strong>fmann Peter Wayne State University h<strong>of</strong>fmann@wayne.edu<br />
Hori Kenichirou Kanazawa University horiken@stu.kanazawa-u.ac.jp<br />
Hosokawa Yoshihiro Kyoto University hosokawa@piezo.kuee.kyoto-u.ac.jp<br />
Hölscher Hendrik Forschungszentrum Karlsruhe hendrik.hoelscher@imt.fzk.de<br />
Huston Shawn North Carolina State University smhuston@ncsu.edu
Ido Shinichiro Kyoto University ido@piezo.kuee.kyoto-u.ac.jp<br />
Jelinek Pavel Institute <strong>of</strong> Physics <strong>of</strong> the ACSR,<br />
v.v.i.<br />
jelinekp@fzu.cz<br />
Jesse Stephen Oak Ridge National Laboratory sjesse@ornl.gov<br />
Jhe Wonho Seoul National University whjhe@snu.ac.kr<br />
Kawai Shigeki University <strong>of</strong> Basel shigeki.kawai@unibas.ch<br />
Kim Woo-Joong <strong>Yale</strong> University Woo-Joong.Kim@yale.edu<br />
Kim Jeehoon Harvard University jeehoonkim@gmail.com<br />
Kin Nobuhiro Tohoku University kin@riec.tohoku.ac.jp<br />
Kinoshita Yukinori Graduate <strong>School</strong> <strong>of</strong> <strong>Engineering</strong>,<br />
Osaka Univ<br />
kinoshita@ap.eng.osaka-u.ac.jp<br />
Kiyohara Kosei Kanazawa University kosei@stu.kanazawa-u.ac.jp<br />
Klocke Michael University <strong>of</strong> Duisburg-Essen m.klocke@uni-duisburg.de<br />
Kobayashi Kei Kyoto University keicoba@iic.kyoto-u.ac.jp<br />
Kobayashi Shin-ichiro Research Institute <strong>of</strong> Electrical<br />
Communication<br />
kshin@atom.che.tohoku.ac.jp<br />
Koch Sascha University <strong>of</strong> Basel sascha.koch@unibas.ch<br />
Kose Rickmer SPECS USA Corp. rkose@specsus.com<br />
Kuroda Masaharu National Institute <strong>of</strong> Advanced<br />
Industrial Science and Technology<br />
(AIST)<br />
m-kuroda@aist.go.jp<br />
Kühnle Angelika University <strong>of</strong> Osnabrueck kuehnle@uos.de<br />
Labardi Massimiliano CNR-INFM labardi@df.unipi.it<br />
Lamoreaux Steve <strong>Yale</strong> University steve.lamoreaux@yale.edu<br />
Lange Manfred University <strong>of</strong> Duisburg-Essen manfred.lange@stud.uni-due.de<br />
Langewisch Gernot University <strong>of</strong> Muenster g.langewisch@uni-muenster.de<br />
Lengel George SPECS USA Corp. lengel@nanonis.com<br />
Li Yanjun Osaka Univarsity liyanjun@ap.eng.osaka-u.ac.jp<br />
Loppacher Christian Aix Marseille University Christian.Loppacher@im2np.fr<br />
Loske Felix University <strong>of</strong> Osnabrueck floske@uos.de<br />
Maksymovych Petro Oak Ridge National Laboratory maksymovychp@ornl.gov<br />
Masago Akira Tohoku University masago@wpi-aimr.tohoku.ac.jp<br />
Mavrokefalos Anastassios Massachusetts Institute <strong>of</strong><br />
Technology<br />
anastass@mit.edu<br />
Milde Peter TU Dresden peter.milde@iapp.de<br />
Milton Kimball University <strong>of</strong> Oklahoma milton@nhn.ou.edu<br />
Minato Taketoshi International Advanced Research<br />
and Education Organization<br />
minato@atom.che.tohoku.ac.jp<br />
Miyahara Yoichi McGill University miyahara@physics.mcgill.ca<br />
Moenig Harry <strong>Yale</strong> University harry.moenig@yale.edu<br />
Moon Christopher Agilent Laboratories chris_moon@agilent.com<br />
Moores Brad University <strong>of</strong> Waterloo brad.moores@gmail.com<br />
Moriarty Philip University <strong>of</strong> Nottingham philip.moriarty@nottingham.ac.uk<br />
Morita Seizo Osaka University smorita@eei.eng.osaka-u.ac.jp<br />
Möller Rolf University <strong>of</strong> Duisburg-Essen rolf.b.moeller@uni-due.de<br />
Nagashima Ken Osaka University nagasima@eei.eng.osaka-u.ac.jp<br />
Naitoh Yoshitaka Osaka University naitoh@ap.eng.osaka-u.ac.jp<br />
Narayanaswamy Arvind Columbia University arvind.narayanaswamy@columbia.edu<br />
171
Nishida Shuhei Institute <strong>of</strong> Industrial Science,<br />
University <strong>of</strong> Tokyo<br />
snishida@iis.u-tokyo.ac.jp<br />
Onishi Hiroshi Kobe University oni@kobe-u.ac.jp<br />
Oral Ahmet Sabanci University aoral@sabanciuniv.edu<br />
Oyabu Noriaki Kyoto University oyabu@piezo.kuee.kyoto-u.ac.jp<br />
Palasantzas Georgios University <strong>of</strong> Groningen g.palasantzas@rug.nl<br />
Parsegian Adrian NIH parsegia@mail.nih.gov<br />
Perez Ruben Universidad Autonoma de Madrid ruben.perez@uam.es<br />
Pieper Hans Hermann University <strong>of</strong> Osnabrueck hapieper@uos.de<br />
Pilet Nicolas EMPA nicolas.pilet@empa.ch<br />
Podgornik Rudolf NIH podgornr@mail.nih.gov<br />
Porthun Steffen RHK Technology, Inc porthun@rhk-tech.com<br />
Rahe Philipp University <strong>of</strong> Osnabrueck prahe@uos.de<br />
Rasmussen Morten Aarhus University mkr@inano.dk<br />
Rasool Haider UCLA haider@chem.ucla.edu<br />
Reichling Michael University <strong>of</strong> Osnabrueck reichling@uos.de<br />
Sadewasser Sascha Helmholtz Zentrum Berlin sadewasser@helmholtz-berlin.de<br />
Sasahara Akira Japan Advanced Institute <strong>of</strong> Science<br />
and Technology<br />
sasahara@jaist.ac.jp<br />
Sawada Daisuke Graduate <strong>School</strong> <strong>of</strong> <strong>Engineering</strong>,<br />
Osaka University<br />
d-sawada@afm.eei.eng.osaka-u.ac.jp<br />
Schirmeisen Andre University <strong>of</strong> Muenster schirmeisen@uni-muenster.de<br />
Schütte Jens University <strong>of</strong> Osnabrueck jens.schuette@uos.de<br />
Schwarz Udo <strong>Yale</strong> University udo.schwarz@yale.edu<br />
Schwarz Alexander University <strong>of</strong> Hamburg aschwarz@physnet.uni-hamburg.de<br />
Schwendemann Todd <strong>Yale</strong> University todd.schwendemann@yale.edu<br />
Shen Sheng MIT sshen1@mit.edu<br />
Siria Alessandro CNRS alessandro.siria@grenoble.cnrs.fr<br />
Staffier Peter <strong>Yale</strong> University peter.staffier@yale.edu<br />
Sugawara Yasuhiro Osaka University sugawara@ap.eng.osaka-u.ac.jp<br />
Sugimoto Yoshiaki Graduate <strong>School</strong> <strong>of</strong> <strong>Engineering</strong> ysugimoto@afm.eei.eng.osaka-u.ac.jp<br />
Sushkov Alexander <strong>Yale</strong> University alex.sushkov@yale.edu<br />
Suzuki Kazuhiro Kyoto University suzuki@piezo.kuee.kyoto-u.ac.jp<br />
Sweetman Adam University <strong>of</strong> Nottingham ppxams@nottingham.ac.uk<br />
Tang Hong <strong>Yale</strong> University hong.tang@yale.edu<br />
Tomas Herruzo Elena IMM-CSIC elena.tomas@imm.cnm.csic.es<br />
Tomitori Masahiko Japan Advanced Institute <strong>of</strong> Science<br />
and Technology<br />
tomitori@jaist.ac.jp<br />
Torricelli Gauthier University <strong>of</strong> Leicester gt47@le.ac.uk<br />
Trevethan Thomas University College London t.trevethan@ucl.ac.uk<br />
Tsukada Masaru Tohoku University tsukada@wpi-aimr.tohoku.ac.jp<br />
Tsunemi Eika Kyoto University eika@piezo.kuee.kyoto-u.ac.jp<br />
van Zwol Peter Groningen petervanzwol@gmail.com<br />
Venkataramani Krithika Aarhus University krithika@inano.dk<br />
Werle Christoph University <strong>of</strong> Basel christop.werle@unibas.ch<br />
Williamson Ryan Saint Louis University williamson.ryan@gmail.com<br />
Wintjes Nikolai University <strong>of</strong> Duisburg-Essen nikolai.wintjes@uni-due.de<br />
Workman Richard Agilent Laboratories richard_workman@agilent.com<br />
172
Wright Alan University <strong>of</strong> Maryland College Park cawright@umd.edu<br />
Yurtsever Ayhan Osaka University ayhan@afm.eei.eng.osaka-u.ac.jp<br />
Zahl Percy Brookhaven National Laboratory pzahl@bnl.gov<br />
Zerweck Ulrich University <strong>of</strong> Technology Dresden ulrich.zerweck@iapp.de<br />
173
Advertisement<br />
174
Ultra-high precision spatial positioning <strong>of</strong> objects is <strong>of</strong> prime importance in the emerging field <strong>of</strong><br />
nanotechnology. attocube systems, a German company located in Munich, manufactures and provides<br />
ultra-high precision spatial positioning systems and complete probing tools which are particularly suitable<br />
for extreme environmental conditions such as cryogenic temperatures (10 mK – 300 K), high magnetic<br />
fields (+31 T) and ultra high vacuum environments (5 x 10-11 mbar).<br />
Two principal product lines which meet today’s market demands are currently <strong>of</strong>fered:<br />
First, ultra-compact nano-precise positioning devices provide linear and rotational movement <strong>of</strong> samples<br />
or probes. They are <strong>of</strong>fered in different sizes and out <strong>of</strong> a variety <strong>of</strong> materials, and feature an<br />
unprecedented variety <strong>of</strong> applications particularly suitable for extreme environmental conditions. This<br />
represents a revolutionary advancement for the positioning market, leading to new research in many<br />
areas. Applications <strong>of</strong> these outstanding nanopositioning modules, well-known in many labs around the<br />
world, include scanning probe techniques such as scanning electron microscopy, confocal microscopy,<br />
scanning force microscopy, scanning tunneling microscopy and near-field optical microscopy, to name just<br />
a few. Furthermore, they are, for instance, suitable for general beam manipulation applications involving<br />
optical fibers and solid state waveguides.<br />
The second product line contains easy-to-use, highly flexible low temperature Scanning Probe<br />
Microscopes like LT-AFM, LT-CFM, LT-SNOM, or LT-STM. These systems are based on these reliable<br />
positioning devices. Thus, the microscopist can perform in-situ coarse and fine positioning, smooth<br />
scanning or automatically focusing any samples in respect to any probes at temperatures down to the<br />
Millikelvin range, at high magnetic fields or under high vacuum conditions.<br />
The product range is completed by innovative and highly flexible control systems for multiple SPM modes.<br />
Various SPM hardware and s<strong>of</strong>tware modules make image acquiring a simple task. 2D and 3D s<strong>of</strong>tware<br />
allow image processing for visually appealing, pr<strong>of</strong>essional and publishable results.<br />
attocube systems AG is focused on three markets. First, they provide nano-positioning systems for the<br />
R&D sector in the field <strong>of</strong> low temperature science. Second, the company produces microscopes capable<br />
for low-temperature applications in R&D. Finally attocube systems AG captures the markets <strong>of</strong> hightech<br />
industries that look for the qualities <strong>of</strong> these positioning systems, especially for the UHV-compatibility <strong>of</strong><br />
attocube systems’ products.<br />
For further technical information concerning attocube systems’ products, please visit the website<br />
www.attocube.com.
Nanosurf ® Saphyr<br />
Your Ultimate “Laboratory-in-a-Box” Signal Analyzer/Controller<br />
The Nanosurf Saphyr is a completely modular digital signal-processing unit that can be used<br />
as an SPM sensor controller for a wide range <strong>of</strong> applications. Its signal modules can be set to<br />
work independently or to use their analysis power on the same microscopy signals. High-end<br />
analog preconditioning stages and digital inter-module communication provide an as <strong>of</strong> yet<br />
unseen usable signal range. Controlled by an easy-to-use s<strong>of</strong>tware interface, the Saphyr is your<br />
all-in-one signal-processing solution.<br />
Go beyond the limits <strong>of</strong> your current measurement capabilities:<br />
• Generate sub-Angstrom amplitudes with the Saphyr PLL Modules and SignalCompensator<br />
• Detect even the smallest forces with the KPFM Controller Module and SignalSuppressor<br />
• Track harmonic frequencies with up to four PLL or Lock-In Modules and SignalSync<br />
• Unify control over multiple cantilevers or scan heads in a single powerful system<br />
Get the most out <strong>of</strong> your investment:<br />
• Combine the Saphyr with any home-built or commercial scan controller and scan head<br />
• Immediately update system characteristics and features through a simple file download<br />
• Extend your system’s capabilities with cost-effective modules to match your growing needs<br />
www.nanosurf.com/saphyr
AD VT-QPlus_ONUS / 09-May<br />
Nanotechnology is our Pr<strong>of</strong>ession!<br />
Z<br />
dF<br />
D<br />
The Si(111) 7x7 surface with<br />
QPlus<br />
Beam<br />
AFM in an Omicron VT at RT<br />
Deflection AFM<br />
(raw data).<br />
with QPlus!<br />
- Expanding the capabilities <strong>of</strong> your Omicron VT<br />
- Ideal sensor for the detection <strong>of</strong> short range forces<br />
- QPlus replaces needle sensor technology<br />
- Provides 2 orders <strong>of</strong> magnitude better force sensitivity<br />
Height [pm]<br />
30<br />
20<br />
10<br />
0<br />
-10<br />
0.5<br />
1 1.5 2 2.5 3<br />
Position [nm]<br />
Imaging <strong>of</strong> rest atoms (raw data) <strong>of</strong> the Si(111) 7x7 surface with QPlus AFM in an Omicron<br />
VT at 50 K (Left image). Line pr<strong>of</strong>ile showing the height difference <strong>of</strong> the rest atoms (above).<br />
Measurement: A. Bettac, Omicron NanoTechnology<br />
Z<br />
dF<br />
Germany: Omicron NanoTechnology GmbH<br />
Tel: +49(0) 6128 / 987 - 0<br />
e-mail: info@omicron.de<br />
Web: www.omicron.de<br />
USA: Omicron NanoTechnology USA<br />
Tel: 952 345 5240<br />
e-mail: info@omicronUS.com<br />
D<br />
The Si(111) 7x7 surface with<br />
QPlus AFM in an Omicron VT at RT<br />
(raw data).
Imaging the Future <strong>of</strong> Nanoscience<br />
World leading technology in UHV Scanning Probe Microscopes, SPM Control Systems, and<br />
Complete Surface Analysis Systems. RHK Technology sets the standard for powerful, flexible<br />
solutions for researchers pushing the limits <strong>of</strong> fundamental science at the atomic scale<br />
PLLPro 2 AFM Control System<br />
RHK’s next generation <strong>of</strong> AFM control.<br />
Ultra high performance and KFM capability in a one box solution.<br />
IDEAL INTERFACE IHDL TM<br />
RHK’s unique Iconic Hardware Description Language unites<br />
flexibility, function, and simplicity for ideal experimental<br />
configuration. Fast, intuitive “drag-and-drop” setup uses icons<br />
to represent hardware blocks. Simply connect icons to design<br />
the experiment. Devices automatically configure and connect<br />
when the template is implemented.<br />
PURPOSE BUILT HARDWARE<br />
ONE BOX INTEGRATION<br />
integrated surface science solutions<br />
Air-Cleaved Mica NC-AFM<br />
Large regularly shaped islands on air-cleaved mica surfaces after<br />
degassing in UHV at 473 K for 14 h. NC-AFM images recorded in<br />
constant detuning mode. F. Ostendorf, C. Schmitz, S. Hirth, A. Kuhnle,<br />
Kolodziej, M. Reichling<br />
Tuning Fork AFM on Silicon<br />
RHK UHV 325 with RHK SPM 1000 and PLLPro Controllers.<br />
True constant height image with current and ∆F(Hz) acquisition<br />
amplitude <strong>of</strong> oscillation, 3Å peak to peak. S. Pryadkin, RHK.<br />
RHK Technology, Inc. | 1050 East Maple, Troy, MI 48083 | 248.577.5426 | www.rhk-tech.com | Visit our booth at NC-AFM 2009
Surface Analysis<br />
Technology<br />
Aarhus STM<br />
State-<strong>of</strong>-the-Art STM Technology<br />
for Advanced SPM Research<br />
Key Features:<br />
� Quartz oscillator based design: sensor (tungsten tip)<br />
separated from oscillator: force and tunneling<br />
signals simultaneously and indepentently<br />
� Imaging <strong>of</strong> conductive and non-conductive samples<br />
in non-contact mode<br />
Vacuum<br />
Components<br />
� <strong>Atomic</strong>ally resolved imaging on a daily basis<br />
JT-STM<br />
Ultra-low temperature Joule Thomson-STM<br />
for ultimate STM spectroscopy and manipulation<br />
Key Features:<br />
� Designed at Aarhus University, group <strong>of</strong><br />
Pr<strong>of</strong>. F. Besenbacher<br />
� Extreme stability<br />
� Highest productivity<br />
� Variable temperature: 115 K to 400 K<br />
(for STM optional: 1300 K)<br />
� One-tip-suits-all: in situ tip sputtering<br />
Key Features:<br />
� Cryostat designed by Pr<strong>of</strong>. W. Wulfhekel<br />
� Base temperature: < 1 K (optional < 500 mK)<br />
� LHe hold time: > 4 days<br />
� NANONIS control package<br />
� Magnetic field up to 3 Tesla<br />
Applications:<br />
Surface Analysis<br />
System S<strong>of</strong>tware<br />
AFM Option<br />
Combining KolibriSensor TM and<br />
NANONIS Control Package<br />
� Inelastic electron tunneling spectroscopy<br />
� Investigation <strong>of</strong> superconductors<br />
� Quantum structures<br />
� Spin polarized tunneling<br />
� <strong>Atomic</strong> manipulation<br />
� Molecular electronics<br />
Computer<br />
Technology
First Announcement:<br />
13th International Conference on<br />
<strong>Noncontact</strong> <strong>Atomic</strong> <strong>Force</strong> <strong>Microscopy</strong><br />
Kanazawa, Japan<br />
13th International Conference on<br />
<strong>Noncontact</strong> <strong>Atomic</strong> <strong>Force</strong> <strong>Microscopy</strong> (ncAFM2010)<br />
and<br />
Satellite Workshops on<br />
bio-imaging,<br />
solid-liquid interface,<br />
SPM standardization<br />
Venue:<br />
Ishikawa Ongakudo, Kanazawa, JAPAN<br />
Date:<br />
July 31 - August 1, 2010 (Satellite Workshops)<br />
August 2 - 5, 2010 (ncAFM2010)<br />
Conference Chair:<br />
Toyoko Arai (Kanazawa Univ.)<br />
Program committee:<br />
Masayuki Abe (Osaka Univ.)<br />
Proceedings committee:<br />
Satoshi Watanabe (Univ. <strong>of</strong> Tokyo)<br />
Web page:<br />
http://www.afm.eei.eng.osaka-u.ac.jp/ncafm2010/<br />
Kanazawa information:<br />
http://www.kanazawa-tourism.com/<br />
Co-organizers (tentative):<br />
167th Committee on Nano-Probe Technology <strong>of</strong> JSPS<br />
The Surface Science Society <strong>of</strong> Japan<br />
Osaka University Global Center <strong>of</strong> Excellence Program<br />
Center for Electronic Device Innovation
Notes
Program Summary <strong>of</strong> the NC-AFM 2009 Satellite Workshop on<br />
Casimir <strong>Force</strong>s and Their Measurement<br />
Monday sessions only; Tuesday sessions are joint with the NC-AFM Conference (see the main<br />
conference program for listing). Note in particular that the Casimir workshop’s second invited talk,<br />
given by Adrian Parsegian (NIH, USA), will take place Tuesday 14:30-15:10.<br />
Monday, August 10<br />
7:45 Registration<br />
8:50 Opening Remarks<br />
9:00 Rudi Porgornik (University <strong>of</strong> Ljubljana, Slovenia), invited<br />
9:30 Noah Graham (Middlebury College, USA)<br />
9:55 Kimball Milton (University Oklahoma, USA)<br />
10:20<br />
C<strong>of</strong>fee Break<br />
10:50 Raul Esquivel-Sirvent (Universidad Nacional Autónoma, Mexico)<br />
11:15 Diego Dalvit (Los Alamos National Laboratory, USA)<br />
11:40 Rick Rajter (MIT, USA)<br />
12:05 Maarten de Boer (Sandia National Laboratory, USA)<br />
12:30<br />
Lunch (12:30-14:30)<br />
14:30 Hong Tang (<strong>Yale</strong> University, USA)<br />
14:55 Alessandro Siria (CNRS, France)<br />
15:20 Arvind Narayanaswamy (Columbia University, USA)<br />
15:45<br />
C<strong>of</strong>fee Break<br />
16:15 Sven de Man (VU University Amsterdam, Netherlands)<br />
16:40 Gauthier Torricelli (University <strong>of</strong> Leicester, UK)<br />
17:05 Ho Bun Chan (University <strong>of</strong> Florida, USA)<br />
17:30 Peter van Zwol (University <strong>of</strong> Groningen, Netherlands)<br />
17:55 Woo-Joong Kim (<strong>Yale</strong> University, USA)<br />
18:30-20:30<br />
Welcome Reception with Dinner
NC-AFM 2009<br />
Sessions<br />
Monday<br />
August 10<br />
�� Liquids I<br />
Tuesday 9:20-10:40<br />
�� <strong>Force</strong> Spectroscopy I<br />
Tuesday 11:20-12:40<br />
�� Electronic, photonic, & Casimir forces<br />
Tuesday 14:30-15:50<br />
�� Oxides<br />
Wednesday 9:00-10:40<br />
�� Carbon-based materials<br />
Wednesday 11:20-12:40<br />
Tuesday<br />
August 11<br />
Wednesday<br />
August 12<br />
�� Molecules on insulators<br />
Wednesday 14:30-15:50<br />
�� <strong>Force</strong> spectroscopy II<br />
Thursday 9:00-10:40<br />
�� <strong>Force</strong>s & charges<br />
Thursday 11:20-13:00<br />
�� Method development<br />
Friday 9:00-10:40<br />
�� Liquids II<br />
Friday 11:20-12:40<br />
Thursday<br />
August 13<br />
Friday<br />
August 14<br />
8:30 Registration Registration Registration Registration<br />
9:00 Opening Remarks M. Heyde A. Campbellova Y. Naitoh<br />
9:20 T. Fukuma A. Yurtsever F. J. Giessibl S. Torbrügge<br />
9:40 H. Asakawa R. Pérez G. Langewisch Y. Hosokawa<br />
10:00 N. Oyabu R. Bechstein A. Barat<strong>of</strong>f E. Tsunemi<br />
10:20 M. Tsukada S. Sadewasser S. Kawai U. Zerweck<br />
10:40 C<strong>of</strong>fee Break C<strong>of</strong>fee Break C<strong>of</strong>fee Break C<strong>of</strong>fee Break<br />
11:20 D. Ebeling U. D. Schwarz A. Sweetman S. Nishida<br />
11:40 A. Schirmeisen P. Jelínek L. Gross S. Ido<br />
12:00 Y. Sugimoto M. Ashino Y. Miyahara E. T. Herruzo<br />
12:20 Y. Sugawara P. Pou T. Trevethan K. Fukui<br />
12:40 A. Bettac Closing Remarks<br />
13:00<br />
Lunch<br />
110 min.<br />
(12:40-14:30)<br />
Lunch<br />
110 min.<br />
(12:40-14:30)<br />
14:30<br />
A. Parsegian<br />
A. Kühnle<br />
14:50<br />
(invited)<br />
A. Schwarz<br />
15:10 Th. Glatzel Ch. Loppacher<br />
15:30 H. Hölscher C. J. Gómez<br />
15:50<br />
|<br />
18:00<br />
C<br />
A<br />
S<br />
I<br />
M<br />
I<br />
R<br />
W<br />
O<br />
R<br />
K<br />
S<br />
H<br />
O<br />
P<br />
18:30-20:30<br />
Welcome<br />
Reception/Dinner<br />
Poster Session I Poster Session II<br />
Lunch<br />
90 min.<br />
(13:00-14:30)<br />
18:30-22:00<br />
Conference<br />
Banquet