Working Group on Seabird Ecology (WGSE). ICES CM 2004/C:05 ...
Working Group on Seabird Ecology (WGSE). ICES CM 2004/C:05 ...
Working Group on Seabird Ecology (WGSE). ICES CM 2004/C:05 ...
- TAGS
- seabird
- ecology
- ices
- www.ices.dk

You also want an ePaper? Increase the reach of your titles
YUMPU automatically turns print PDFs into web optimized ePapers that Google loves.
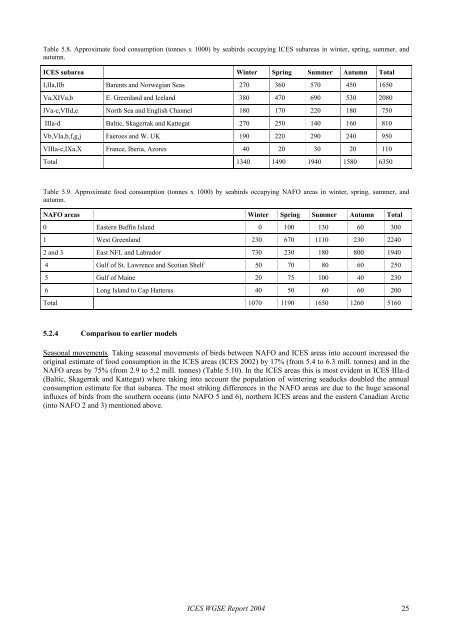
Table 5.8. Approximate food c<strong>on</strong>sumpti<strong>on</strong> (t<strong>on</strong>nes x 1000) by seabirds occupying <strong>ICES</strong> subareas in winter, spring, summer, and<br />
autumn.<br />
<strong>ICES</strong> subarea Winter Spring Summer Autumn Total<br />
I,IIa,IIb Barents and Norwegian Seas 270 360 570 450 1650<br />
Va,XIVa,b E. Greenland and Iceland 380 470 690 530 2080<br />
IVa-c,VIId,e North Sea and English Channel 180 170 220 180 750<br />
IIIa-d Baltic, Skagerrak and Kattegat 270 250 140 160 810<br />
Vb,VIa,b,f,g,j Faeroes and W. UK 190 220 290 240 950<br />
VIIIa-c,IXa,X France, Iberia, Azores 40 20 30 20 110<br />
Total 1340 1490 1940 1580 6350<br />
Table 5.9. Approximate food c<strong>on</strong>sumpti<strong>on</strong> (t<strong>on</strong>nes x 1000) by seabirds occupying NAFO areas in winter, spring, summer, and<br />
autumn.<br />
NAFO areas Winter Spring Summer Autumn Total<br />
0 Eastern Baffin Island 0 100 130 60 300<br />
1 West Greenland 230 670 1110 230 2240<br />
2 and 3 East NFL and Labrador 730 230 180 800 1940<br />
4 Gulf of St. Lawrence and Scotian Shelf 50 70 80 60 250<br />
5 Gulf of Maine 20 75 100 40 230<br />
6 L<strong>on</strong>g Island to Cap Hatteras 40 50 60 60 200<br />
Total 1070 1190 1650 1260 5160<br />
5.2.4 Comparis<strong>on</strong> to earlier models<br />
Seas<strong>on</strong>al movements. Taking seas<strong>on</strong>al movements of birds between NAFO and <strong>ICES</strong> areas into account increased the<br />
original estimate of food c<strong>on</strong>sumpti<strong>on</strong> in the <strong>ICES</strong> areas (<strong>ICES</strong> 2002) by 17% (from 5.4 to 6.3 mill. t<strong>on</strong>nes) and in the<br />
NAFO areas by 75% (from 2.9 to 5.2 mill. t<strong>on</strong>nes) (Table 5.10). In the <strong>ICES</strong> areas this is most evident in <strong>ICES</strong> IIIa-d<br />
(Baltic, Skagerrak and Kattegat) where taking into account the populati<strong>on</strong> of wintering seaducks doubled the annual<br />
c<strong>on</strong>sumpti<strong>on</strong> estimate for that subarea. The most striking differences in the NAFO areas are due to the huge seas<strong>on</strong>al<br />
influxes of birds from the southern oceans (into NAFO 5 and 6), northern <strong>ICES</strong> areas and the eastern Canadian Arctic<br />
(into NAFO 2 and 3) menti<strong>on</strong>ed above.<br />
<strong>ICES</strong> <strong>WGSE</strong> Report <strong>2004</strong> 25