Working Group on Seabird Ecology (WGSE). ICES CM 2004/C:05 ...
Working Group on Seabird Ecology (WGSE). ICES CM 2004/C:05 ...
Working Group on Seabird Ecology (WGSE). ICES CM 2004/C:05 ...
- TAGS
- seabird
- ecology
- ices
- www.ices.dk

Create successful ePaper yourself
Turn your PDF publications into a flip-book with our unique Google optimized e-Paper software.
c<strong>on</strong>tribute data to the seabird productivity m<strong>on</strong>itoring programme in Britain and Ireland. These data show clear patterns<br />
of variati<strong>on</strong>; black-legged kittiwake breeding success tends to be similar between col<strong>on</strong>ies counted independently<br />
within geographical regi<strong>on</strong>s, indicating that causes of variati<strong>on</strong> tend to affect all col<strong>on</strong>ies within a regi<strong>on</strong> (Frederiksen et<br />
al., <strong>2004</strong>). Averaging data <strong>on</strong> productivity over several col<strong>on</strong>ies within a geographical regi<strong>on</strong> reduces variance in the<br />
data c<strong>on</strong>tributed by col<strong>on</strong>y-specific factors such as local predati<strong>on</strong> impacts, weather, or disturbance effects.<br />
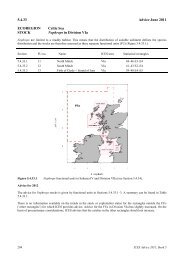
7.6.3 Does black-legged kittiwake breeding success correlate with sandeel abundance?<br />
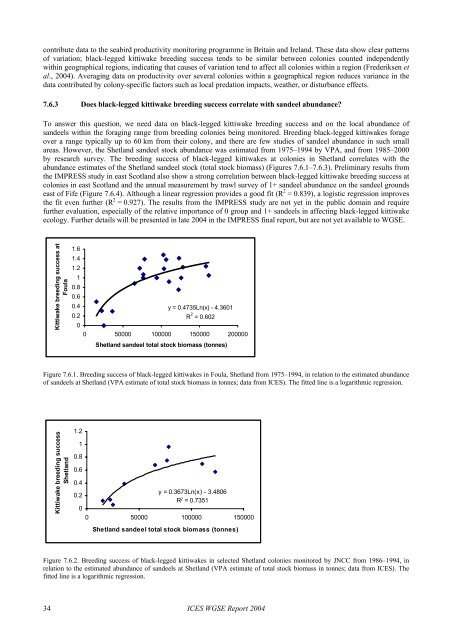
To answer this questi<strong>on</strong>, we need data <strong>on</strong> black-legged kittiwake breeding success and <strong>on</strong> the local abundance of<br />
sandeels within the foraging range from breeding col<strong>on</strong>ies being m<strong>on</strong>itored. Breeding black-legged kittiwakes forage<br />
over a range typically up to 60 km from their col<strong>on</strong>y, and there are few studies of sandeel abundance in such small<br />
areas. However, the Shetland sandeel stock abundance was estimated from 1975–1994 by VPA, and from 1985–2000<br />
by research survey. The breeding success of black-legged kittiwakes at col<strong>on</strong>ies in Shetland correlates with the<br />
abundance estimates of the Shetland sandeel stock (total stock biomass) (Figures 7.6.1–7.6.3). Preliminary results from<br />
the IMPRESS study in east Scotland also show a str<strong>on</strong>g correlati<strong>on</strong> between black-legged kittiwake breeding success at<br />
col<strong>on</strong>ies in east Scotland and the annual measurement by trawl survey of 1+ sandeel abundance <strong>on</strong> the sandeel grounds<br />
east of Fife (Figure 7.6.4). Although a linear regressi<strong>on</strong> provides a good fit (R 2 = 0.839), a logistic regressi<strong>on</strong> improves<br />
the fit even further (R 2 = 0.927). The results from the IMPRESS study are not yet in the public domain and require<br />
further evaluati<strong>on</strong>, especially of the relative importance of 0 group and 1+ sandeels in affecting black-legged kittiwake<br />
ecology. Further details will be presented in late <strong>2004</strong> in the IMPRESS final report, but are not yet available to <strong>WGSE</strong>.<br />
Kittiwake breeding success at<br />
Foula<br />
1.6<br />
1.4<br />
1.2<br />
1<br />
0.8<br />
0.6<br />
y = 0.4735Ln(x) - 4.3601<br />
R 2 0.4<br />
0.2<br />
0<br />
= 0.602<br />
0 50000 100000 150000 200000<br />
Shetland sandeel total stock biomass (t<strong>on</strong>nes)<br />
Figure 7.6.1. Breeding success of black-legged kittiwakes in Foula, Shetland from 1975–1994, in relati<strong>on</strong> to the estimated abundance<br />
of sandeels at Shetland (VPA estimate of total stock biomass in t<strong>on</strong>nes; data from <strong>ICES</strong>). The fitted line is a logarithmic regressi<strong>on</strong>.<br />
Kittiwake breeding success<br />
Shetland<br />
1.2<br />
1<br />
0.8<br />
0.6<br />
y = 0.3673Ln(x) - 3.4806<br />
R2 0.4<br />
0.2<br />
0<br />
= 0.7351<br />
0 50000 100000 150000<br />
Shetland sandeel total stock biomass (t<strong>on</strong>nes)<br />
Figure 7.6.2. Breeding success of black-legged kittiwakes in selected Shetland col<strong>on</strong>ies m<strong>on</strong>itored by JNCC from 1986–1994, in<br />
relati<strong>on</strong> to the estimated abundance of sandeels at Shetland (VPA estimate of total stock biomass in t<strong>on</strong>nes; data from <strong>ICES</strong>). The<br />
fitted line is a logarithmic regressi<strong>on</strong>.<br />
34<br />
<strong>ICES</strong> <strong>WGSE</strong> Report <strong>2004</strong>