English - Industrial Research Institute
English - Industrial Research Institute
English - Industrial Research Institute

Create successful ePaper yourself
Turn your PDF publications into a flip-book with our unique Google optimized e-Paper software.
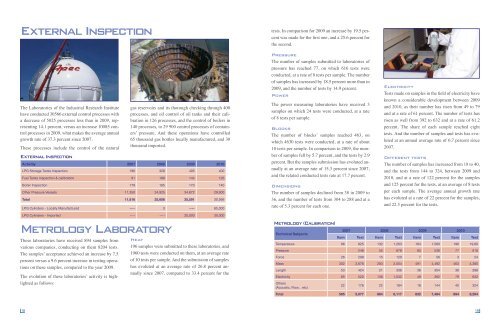
External Inspection<br />
The Laboratories of the <strong>Industrial</strong> <strong>Research</strong> <strong>Institute</strong><br />
have conducted 30566 external control processes with<br />
a decrease of 5025 processes less than in 2009, representing<br />
14.1 percent, versus an increase 10085 control<br />
processes in 2009, what makes the average annual<br />
growth rate of 37.3 percent since 2007.<br />
These processes include the control of the natural<br />
External Inspection<br />
Activitiy 2007 2008 2009 2010<br />
LPG Storage Tanks Inspection 196 328 405 400<br />
Fuel Tanks Inspection & calibration 91 188 144 126<br />
Boiler Inspection 179 165 170 140<br />
Other Pressure Vessels 11,350 24,925 34,872 29,900<br />
Total 11,816 25,606 35,591 30,566<br />
LPG Cylinders - Locally Manufactured ---- 3 ---- 65,000<br />
LPG Cylinders - Imported ---- ---- 20,000 30,000<br />
Metrology Laboratory<br />
These laboratories have received 894 samples from<br />
various companies, conducting on them 8204 tests.<br />
The samples’ acceptance achieved an increase by 7.5<br />
percent versus a 9.6 percent increase in testing operations<br />
on these samples, compared to the year 2009.<br />
The evolution of these laboratories’ activity is highlighted<br />
as follows:<br />
gas reservoirs and its thorough checking through 400<br />
processes, and oil control of oil tanks and their calibration<br />
in 126 processes, and the control of boilers in<br />
140 processes, to 29 900 control processes of containers’<br />
pressure. And these operations have controlled<br />
65 thousand gas bottles locally manufactured, and 30<br />
thousand imported.<br />
Heat<br />
196 samples were submitted to these laboratories, and<br />
1960 tests were conducted on them, at an average rate<br />
of 10 tests per sample. And the submission of samples<br />
has evoluted at an average rate of 26.8 percent annually<br />
since 2007, compared to 33.4 percent for the<br />
tests. In comparison for 2009 an increase by 19.5 per-<br />
cent was made for the first one, and a 25.6 percent for<br />
the second.<br />
Pressure<br />
The number of samples submitted to laboratories of<br />
pressure has reached 77, on which 616 tests were<br />
conducted, at a rate of 8 tests per sample. The number<br />
of samples has increased by 18.5 percent more than in<br />
2009, and the number of tests by 14.9 percent.<br />
Power<br />
The power measuring laboratories have received 3<br />
samples on which 24 tests were conducted, at a rate<br />
of 8 tests per sample.<br />
Blocks<br />
The number of blocks’ samples reached 463, on<br />
which 4630 tests were conducted, at a rate of about<br />
10 tests per sample. In comparison to 2009, the number<br />
of samples fell by 5.7 percent, and the tests by 2.9<br />
percent. But the samples submission has evoluted annually<br />
at an average rate of 15.3 percent since 2007,<br />
and the related conducted tests rate at 17.7 percent.<br />
Dimensions<br />
The number of samples declined from 38 in 2009 to<br />
36, and the number of tests from 304 to 288 and at a<br />
rate of 5.3 percent for each one.<br />
Metrology (Calibration)<br />
Technical Subjects<br />
2007 2008 2009 2010<br />
Item Test Item Test Item Test Item Test<br />
Temperature 96 825 132 1,263 164 1,560 196 19,60<br />
Pressure 248 55 678 65 536 77 616<br />
Force 26 208 15 120 7 56 3 24<br />
Mass 302 2,676 283 2,504 491 4,492 463 4,360<br />
Length 53 424 21 336 38 304 36 288<br />
Electricity 65 520 136 1,032 49 392 79 632<br />
Others<br />
(Acoustic, Flow... etc)<br />
Electricity<br />
Tests made on samples in the field of electricity have<br />
known a considerable development between 2009<br />
and 2010, as their number has risen from 49 to 79<br />
and at a rate of 61 percent. The number of tests has<br />
risen as well from 392 to 632 and at a rate of 61.2<br />
percent. The share of each sample reached eight<br />
tests. And the number of samples and tests has evoluted<br />
at an annual average rate of 6.7 percent since<br />
2007.<br />
Different tests<br />
The number of samples has increased from 18 to 40,<br />
and the tests from 144 to 324, between 2009 and<br />
2010, and at a rate of 122 percent for the samples<br />
and 125 percent for the tests, at an average of 8 tests<br />
per each sample. The average annual growth rate<br />
has evoluted at a rate of 22 percent for the samples,<br />
and 22.5 percent for the tests.<br />
22 176 22 184 18 144 40 324<br />
Total 595 5,077 664 6,117 832 7,484 894 8,204<br />
18 19