SeeNews TOP 100 SEE 2012 - SEE Top 100 - SeeNews
SeeNews TOP 100 SEE 2012 - SEE Top 100 - SeeNews
SeeNews TOP 100 SEE 2012 - SEE Top 100 - SeeNews

You also want an ePaper? Increase the reach of your titles
YUMPU automatically turns print PDFs into web optimized ePapers that Google loves.
<strong>SEE</strong> <strong>TOP</strong><br />
industries<br />
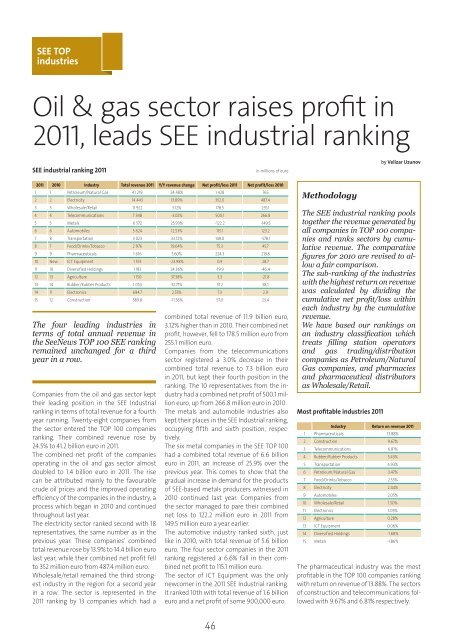
Oil & gas sector raises profi t in<br />
2011, leads <strong>SEE</strong> industrial ranking<br />
<strong>SEE</strong> industrial ranking 2011<br />
2011 2010 Industry Total revenue 2011 Y/Y revenue change Net profit/loss 2011 Net profit/loss 2010<br />
1 1 Petroleum/Natural Gas 41 219 24.48% 1 428 765<br />
2 2 Electricity 14 443 13.89% 352.0 487.4<br />
3 3 Wholesale/Retail 11 922 3.12% 178.5 255.1<br />
4 4 Telecommunications 7 348 -3.02% 500.1 266.8<br />
5 5 Metals 6 572 25.93% -122.2 -149.5<br />
6 6 Automobiles 5 624 12.53% 115.1 123.2<br />
7 8 Transportation 3 023 33.72% 149.0 -578.1<br />
8 7 Food/Drinks/Tobacco 2 976 19.64% 75.3 45.7<br />
9 9 Pharmaceuticals 1 616 5.60% 224.3 213.8<br />
10 New ICT Equipment 1 553 -23.98% 0.9 28.7<br />
11 10 Diversified Holdings 1 183 24.36% -19.9 -46.4<br />
12 13 Agriculture 1 150 37.38% 3.3 -21.8<br />
13 14 Rubber/Rubber Products 1 053 32.71% 57.2 58.1<br />
14 11 Electronics 694.7 2.55% 7.3 2.9<br />
15 12 Construction 589.8 -11.56% 57.0 23.4<br />
The four leading industries in<br />
terms of total annual revenue in<br />
the <strong>SeeNews</strong> <strong>TOP</strong> <strong>100</strong> <strong>SEE</strong> ranking<br />
remained unchanged for a third<br />
year in a row.<br />
Companies from the oil and gas sector kept<br />
their leading position in the <strong>SEE</strong> Industrial<br />
ranking in terms of total revenue for a fourth<br />
year running. Twenty-eight companies from<br />
the sector entered the <strong>TOP</strong> <strong>100</strong> companies<br />
ranking. Their combined revenue rose by<br />
24.5% to 41.2 billion euro in 2011.<br />
The combined net profi t of the companies<br />
operating in the oil and gas sector almost<br />
doubled to 1.4 billion euro in 2011. The rise<br />
can be attributed mainly to the favourable<br />
crude oil prices and the improved operating<br />
effi ciency of the companies in the industry, a<br />
process which began in 2010 and continued<br />
throughout last year.<br />
The electricity sector ranked second with 18<br />
representatives, the same number as in the<br />
previous year. These companies’ combined<br />
total revenue rose by 13.9% to 14.4 billion euro<br />
last year, while their combined net profi t fell<br />
to 352 million euro from 487.4 million euro.<br />
Wholesale/retail remained the third strongest<br />
industry in the region for a second year<br />
in a row. The sector is represented in the<br />
2011 ranking by 13 companies which had a<br />
combined total revenue of 11.9 billion euro,<br />
3.12% higher than in 2010. Their combined net<br />
profi t, however, fell to 178.5 million euro from<br />
255.1 million euro.<br />
Companies from the telecommunications<br />
sector registered a 3.0% decrease in their<br />
combined total revenue to 7.3 billion euro<br />
in 2011, but kept their fourth position in the<br />
ranking. The 10 representatives from the industry<br />
had a combined net profi t of 500.1 million<br />
euro, up from 266.8 million euro in 2010.<br />
The metals and automobile industries also<br />
kept their places in the <strong>SEE</strong> Industrial ranking,<br />
occupying fi fth and sixth position, respectively.<br />
The six metal companies in the <strong>SEE</strong> <strong>TOP</strong> <strong>100</strong><br />
had a combined total revenue of 6.6 billion<br />
euro in 2011, an increase of 25.9% over the<br />
previous year. This comes to show that the<br />
gradual increase in demand for the products<br />
of <strong>SEE</strong>-based metals producers witnessed in<br />
2010 continued last year. Companies from<br />
the sector managed to pare their combined<br />
net loss to 122.2 million euro in 2011 from<br />
149.5 million euro a year earlier.<br />
The automotive industry ranked sixth, just<br />
like in 2010, with total revenue of 5.6 billion<br />
euro. The four sector companies in the 2011<br />
ranking registered a 6.6% fall in their combined<br />
net profi t to 115.1 million euro.<br />
The sector of ICT Equipment was the only<br />
newcomer in the 2011 <strong>SEE</strong> Industrial ranking.<br />
It ranked 10th with total revenue of 1.6 billion<br />
euro and a net profi t of some 900,000 euro.<br />
46<br />
in millions of euro<br />
Methodology<br />
Most profi table industries 2011<br />
by Velizar Uzunov<br />
The <strong>SEE</strong> industrial ranking pools<br />
together the revenue generated by<br />
all companies in <strong>TOP</strong> <strong>100</strong> companies<br />
and ranks sectors by cumulative<br />
revenue. The comparative<br />
fi gures for 2010 are revised to allow<br />
a fair comparison.<br />
The sub-ranking of the industries<br />
with the highest return on revenue<br />
was calculated by dividing the<br />
cumulative net profi t/loss within<br />
each industry by the cumulative<br />
revenue.<br />
We have based our rankings on<br />
an industry classifi cation which<br />
treats fi lling station operators<br />
and gas trading/distribution<br />
companies as Petroleum/Natural<br />
Gas companies, and pharmacies<br />
and pharmaceutical distributors<br />
as Wholesale/Retail.<br />
Industry Return on revenue 2011<br />
1 Pharmaceuticals 13.88%<br />
2 Construction 9.67%<br />
3 Telecommunications 6.81%<br />
4 Rubber/Rubber Products 5.43%<br />
5 Transportation 4.93%<br />
6 Petroleum/Natural Gas 3.47%<br />
7 Food/Drinks/Tobacco 2.53%<br />
8 Electricity 2.44%<br />
9 Automobiles 2.05%<br />
10 Wholesale/Retail 1.50%<br />
11 Electronics 1.05%<br />
12 Agriculture 0.28%<br />
13 ICT Equipment 0.06%<br />
14 Diversified Holdings -1.68%<br />
15 Metals -1.86%<br />
The pharmaceutical industry was the most<br />
profi table in the <strong>TOP</strong> <strong>100</strong> companies ranking<br />
with return on revenue of 13.88%. The sectors<br />
of construction and telecommunications followed<br />
with 9.67% and 6.81% respectively.