they shared, we examined traditional, nomothetic, cross-situational consistency coefficients of individual differences in each behavior, computed for each distinct pair of interpersonal situations. To ensure sufficient samples of observations for each type of interpersonal situation, observations from different camp activities were pooled. Specifically, the 14 camp activities were randomly grouped to form two sets of 7 activities, and within each set, conditional probabilities of each type of behavior in each type of interpersonal situation were computed. The consistency of individual differences in these conditional probabilities was computed across the two sets. Different counselors led different activities, and behavior observations were made at the end of each activity on a computer-scored behavior tracking sheet by the counselor who led that activity. Because observations of behaviors in different activities were made by different counselors, consistency coefficients computed across them do not reflect possible links due to overlap in observers. To minimize chance associations present in any specific random grouping of the camp activities, this procedure was repeated 100 times, and the results were averaged using Fisher's r-to-z transformation. These average correlations should be more stable with a smaller standard error than is usually expected for a single correlation, because such averages are less subject to the sampling error associated with the specific random grouping of the 14 camp activities into two sets of 7. If the 100 iterations had been conducted in independent samples, then one should be able to compute the expected standard error of the mean coefficient following the central limit theorem. However, the 100 iterations do not constitute independent samples, and therefore one cannot compute estimates of the standard error by simply applying the theorem, which assumes independence of sampling. Therefore, we used the bootstrapping procedure, whose method and theoretical rationale are described elsewhere in detail (Diaconis & Efron, 1983; Efron, 1981, 1985; Efron ATibshirani, 1986). Briefly, this computation-intensive, nonparametric method of estimating standard errors involves drawing random samples from the obtained data pool and computing the statistics of interest in each random sample. The bootstrapping procedure calls for sampling with replacement; that is, after a subject is drawn from the pool, the chosen subject is replaced back to the pool so that she or he can be chosen again. Therefore, even though it requires forming random samples of the same size as the size of the obtained data pool from which they are drawn, the exact composition of the random sample varies, due to the fact Liat in each random sample some subjects are represented multiple times while some others are not chosen. The distribution across the random samples of the statistic of interest computed in each sample (which in the case of the present analysis is the mean consistency coefficient) provides an estimate of the sampling distribution. Specifically, the standard errors reported in Table 2 are based on 500 such random samples. Within each sample, 10, rather than 100, random groupings of camp activities were made because of the limitation of computer resources; thus, we obtained conservative overestimates of standard errors and p values. Results Idiographic Analyses oflntraindividual Profile Stability Figure 1 presents examples of idiographic situation-behavior profiles for individuals, illustrating varying levels of profile stability for all five situations. The first profile in Figure 1 indicates that the pattern by which verbal aggression of Child 17 varied across the five situations was stable and distinctive. Specifically, this individual was more verbally aggressive than others when punished by an adult (standard score of over 2.0), but his level of aggression was lower than the average level when teased, provoked, or threatened by a peer (standard score of about 0.5); while in the other three situations his level of verbal aggression STABILITY OF INTRA<strong>INDIVIDUAL</strong> BEHAVIOR PATTERNING 679 was near average in each respective situation. The two lines indicate the profiles based on two different, nonoverlapping samples of occasions in which the child encountered each type of psychological situation, shown as Time 1 and Time 2. At both Time 1 and Time 2, his profile was characterized by the fact that his level of verbal aggression, relative to the level of the peers in each situation (i.e., the "norm"), was the highest when adults punished him and lowest when another child teased. Child 9, whose profile of verbal aggression is shown in the second panel of Figure 1, was most distinctively verbally aggressive when warned by adults and his overall profile indicated substantial stability. Child 28 (the third panel of Figure 1), on the other hand, was most distinctively verbally aggressive when peers approached him. The profile stability was relatively modest, however, because his profile with regard to the remaining psychological situations changed over time. The last panel of Figure 1, for Child 48, illustrates a case of low profile stability. His profile of verbal aggression was distinctive at Time 1 in that he was most verbally aggressive, relative to others, when praised by an adult, but this was no longer the case at Time 2. As these examples illustrate, children differed widely in the stability and nature of their intraindividual profiles for each type of behavior. To test the hypothesis that on the whole these patterns of behavior variation across situations constitute intraindividually stable profiles, rather than "error variance," the mean profile stabilities for each behavior were computed by averaging each subject's profile stability using Fisher's r-to-z transformation. Because the profile stability is computed ipsatively, we considered each child's observed stability coefficient as independently sampled from a distribution of profile stabilities and tested the statistical significance of the group mean stabilities by t tests as estimates of the sampling error using the standard deviations of the stability coefficients across individuals. The first section of Table 2 shows the mean stability coefficients of intraindividual situation-behavior profiles over all five interpersonal situations listed in Table 1. To provide a reliable assessment of the conditional probabilities of behavioral responses in relation to each situation, yet to retain a maximum number of subjects, we included all subjects as long as'they experienced each psychological situation included in a profile at least six times in the course of the 6-week summer, as indicated in the Method section. Of the total of 84 individuals in the sample, 53 encountered all five situations sufficiently to meet this criterion and thus were included in this analysis. On average, they had mean stability coefficients of. 19 (p < .05) for prosocial talk, .28 (p < .001) for whining, .41 (p < .001) for compliance, and .47 (p < .001) for verbal aggression in their intraindividua! profiles of behavior variability across all five situations. It was possible to include more individuals in the analysis by excluding from the profiles the less frequently encountered types of situations. Specifically, excluding the least frequent situation (when teased, provoked, or threatened by a peer), 73 people encountered each of the remaining four types of situations at least six times, and we used that subset of subjects to compute the stabilities of profiles of behavior variability over the four situations. As shown in the second section of Table 2, the average stability coefficients for these profiles were .28 (p
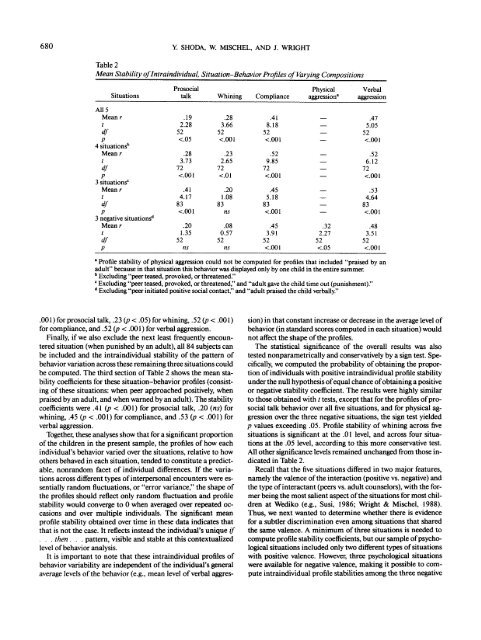
680 Y. SHODA, W. MISCHEL, <strong>AND</strong> J. WRIGHT Table 2 Mean Stability oflntraindividual, Situation-Behavior Profiles of Varying Compositions Situations All 5 Mean r t df P 4 situations'" Meanr t df P 3 situations' Meanr t df P 3 negative situations' 1 Meanr t df P Prosocial talk .19 2.28 52
- Page 1 and 2: PERSONALITY PROCESSES AND INDIVIDUA
- Page 3 and 4: 676 Y. SHODA, W. MISCHEL, AND J. WR
- Page 5: 678 Y. SHODA, W. MISCHEL, AND J. WR
- Page 9 and 10: 682 Y. SHODA, W. MISCHEL, AND J. WR
- Page 11 and 12: 684 Y. SHODA, W. MISCHEL, AND J. WR
- Page 13 and 14: 686 Y. SHODA, W. MISCHEL, AND J. WR