PERSONALITY PROCESSES AND INDIVIDUAL DIFFERENCES ...
PERSONALITY PROCESSES AND INDIVIDUAL DIFFERENCES ...
PERSONALITY PROCESSES AND INDIVIDUAL DIFFERENCES ...

Create successful ePaper yourself
Turn your PDF publications into a flip-book with our unique Google optimized e-Paper software.
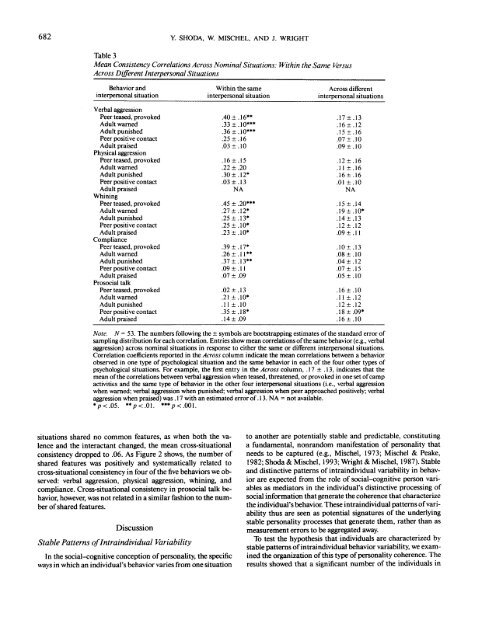
682 Y. SHODA, W. MISCHEL, <strong>AND</strong> J. WRIGHT<br />
Table 3<br />
Mean Consistency Correlations Across Nominal Situations: Within the Same Versus<br />
Across Different Interpersonal Situations<br />
Behavior and<br />
interpersonal situation<br />
Verbal aggression<br />
Peer teased, provoked<br />
Adult warned<br />
Adult punished<br />
Peer positive contact<br />
Adult praised<br />
Physical aggression<br />
Peer teased, provoked<br />
Adult warned<br />
Adult punished<br />
Peer positive contact<br />
Adult praised<br />
Whining<br />
Peer teased, provoked<br />
Adult warned<br />
Adult punished<br />
Peer positive contact<br />
Adult praised<br />
Compliance<br />
Peer teased, provoked<br />
Adult warned<br />
Adult punished<br />
Peer positive contact<br />
Adult praised<br />
Prosocial talk<br />
Peer teased, provoked<br />
Adult warned<br />
Adult punished<br />
Peer positive contact<br />
Adult praised<br />
Within the same<br />
interpersonal situation<br />
.40 ±.16**<br />
.33 ±.10***<br />
.36 ±.10***<br />
.25+ .16<br />
.03 ±.10<br />
.16 + .15<br />
.22 ± .20<br />
.3O±.12*<br />
.03 ±.13<br />
NA<br />
.45 ± .20***<br />
.27 ±.12*<br />
.25 ±.13*<br />
.25 ±.10*<br />
.23 ±.10*<br />
.39 ±.17*<br />
.26 ±.11**<br />
.37 ±.13**<br />
.09 ±.11<br />
.07 ± .09<br />
.02 ±.13<br />
.21 ±.10*<br />
.11 ±.10<br />
.35 ± .18*<br />
.14 ±.09<br />
Across different<br />
interpersonal situations<br />
.17 + . 13<br />
.16 ± .12<br />
.15 ± .16<br />
.07 ±.10<br />
.09 ±.10<br />
.12 ± .16<br />
.11 ±.16<br />
.16 ± .16<br />
.01 ±.10<br />
NA<br />
.15 ± .14<br />
.19±.1O*<br />
.14±.13<br />
.12 ± .12<br />
.09+ .11<br />
.10 ± .13<br />
.08 ±.10<br />
.04 ±.12<br />
.07 ±.15<br />
.05 ±.10<br />
.16 ± .10<br />
.11 ±.12<br />
.12 ± .12<br />
.18 ±.09*<br />
.16 ± .10<br />
Note. N = 53. The numbers following the ± symbols are bootstrapping estimates of the standard error of<br />
sampling distribution for each correlation. Entries show mean correlations of the same behavior (e.g., verbal<br />
aggression) across nominal situations in response to either the same or different interpersonal situations.<br />
Correlation coefficients reported in the Across column indicate the mean correlations between a behavior<br />
observed in one type of psychological situation and the same behavior in each of the four other types of<br />
psychological situations. For example, the first entry in the Across column, .17 ± .13, indicates that the<br />
mean of the correlations between verbal aggression when teased, threatened, or provoked in one set of camp<br />
activities and the same type of behavior in the other four interpersonal situations (i.e., verbal aggression<br />
when warned; verbal aggression when punished; verbal aggression when peer approached positively; verbal<br />
aggression when praised) was. 17 with an estimated error of. 13. NA = not available.<br />
*p