Effect of hygrothermal treatment on the tensile properties - ethesis ...
Effect of hygrothermal treatment on the tensile properties - ethesis ...
Effect of hygrothermal treatment on the tensile properties - ethesis ...

Create successful ePaper yourself
Turn your PDF publications into a flip-book with our unique Google optimized e-Paper software.
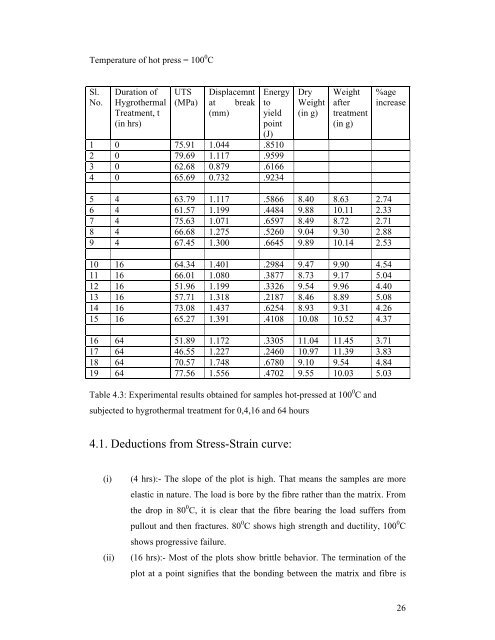
Temperature <str<strong>on</strong>g>of</str<strong>on</strong>g> hot press = 100 0 C<br />
Sl.<br />
No.<br />
Durati<strong>on</strong> <str<strong>on</strong>g>of</str<strong>on</strong>g><br />
Hygro<strong>the</strong>rmal<br />
Treatment, t<br />
(in hrs)<br />
UTS<br />
(MPa)<br />
Displacemnt<br />
at break<br />
(mm)<br />
Energy<br />
to<br />
yield<br />
point<br />
1 0 75.91 1.044 .8510<br />
2 0 79.69 1.117 .9599<br />
3 0 62.68 0.879 .6166<br />
4 0 65.69 0.732 .9234<br />
(J)<br />
Dry<br />
Weight<br />
(in g)<br />
Weight<br />
after<br />
<str<strong>on</strong>g>treatment</str<strong>on</strong>g><br />
(in g)<br />
%age<br />
increase<br />
5 4 63.79 1.117 .5866 8.40 8.63 2.74<br />
6 4 61.57 1.199 .4484 9.88 10.11 2.33<br />
7 4 75.63 1.071 .6597 8.49 8.72 2.71<br />
8 4 66.68 1.275 .5260 9.04 9.30 2.88<br />
9 4 67.45 1.300 .6645 9.89 10.14 2.53<br />
10 16 64.34 1.401 .2984 9.47 9.90 4.54<br />
11 16 66.01 1.080 .3877 8.73 9.17 5.04<br />
12 16 51.96 1.199 .3326 9.54 9.96 4.40<br />
13 16 57.71 1.318 .2187 8.46 8.89 5.08<br />
14 16 73.08 1.437 .6254 8.93 9.31 4.26<br />
15 16 65.27 1.391 .4108 10.08 10.52 4.37<br />
16 64 51.89 1.172 .3305 11.04 11.45 3.71<br />
17 64 46.55 1.227 .2460 10.97 11.39 3.83<br />
18 64 70.57 1.748 .6780 9.10 9.54 4.84<br />
19 64 77.56 1.556 .4702 9.55 10.03 5.03<br />
Table 4.3: Experimental results obtained for samples hot-pressed at 100 0 C and<br />
subjected to <str<strong>on</strong>g>hygro<strong>the</strong>rmal</str<strong>on</strong>g> <str<strong>on</strong>g>treatment</str<strong>on</strong>g> for 0,4,16 and 64 hours<br />
4.1. Deducti<strong>on</strong>s from Stress-Strain curve:<br />
(i) (4 hrs):- The slope <str<strong>on</strong>g>of</str<strong>on</strong>g> <strong>the</strong> plot is high. That means <strong>the</strong> samples are more<br />
elastic in nature. The load is bore by <strong>the</strong> fibre ra<strong>the</strong>r than <strong>the</strong> matrix. From<br />
<strong>the</strong> drop in 80 0 C, it is clear that <strong>the</strong> fibre bearing <strong>the</strong> load suffers from<br />
pullout and <strong>the</strong>n fractures. 80 0 C shows high strength and ductility, 100 0 C<br />
shows progressive failure.<br />
(ii) (16 hrs):- Most <str<strong>on</strong>g>of</str<strong>on</strong>g> <strong>the</strong> plots show brittle behavior. The terminati<strong>on</strong> <str<strong>on</strong>g>of</str<strong>on</strong>g> <strong>the</strong><br />
plot at a point signifies that <strong>the</strong> b<strong>on</strong>ding between <strong>the</strong> matrix and fibre is<br />
26