National Meteorological Library and Archive Fact sheet 6 - Met Office
National Meteorological Library and Archive Fact sheet 6 - Met Office
National Meteorological Library and Archive Fact sheet 6 - Met Office

You also want an ePaper? Increase the reach of your titles
YUMPU automatically turns print PDFs into web optimized ePapers that Google loves.
Beaufort<br />
<strong>National</strong> <strong><strong>Met</strong>eorological</strong> <strong>Library</strong> <strong>and</strong> <strong>Archive</strong><br />
<strong>Fact</strong> <strong>sheet</strong> 6 — The Beaufort Scale<br />
(version 01)<br />
© <strong>National</strong> Portrait Gallery, London
The <strong>National</strong> <strong><strong>Met</strong>eorological</strong> <strong>Library</strong> <strong>and</strong> <strong>Archive</strong><br />
Many people have an interest in the weather <strong>and</strong> the processes that cause it, which is why the<br />
<strong>National</strong> <strong><strong>Met</strong>eorological</strong> <strong>Library</strong> <strong>and</strong> <strong>Archive</strong> are open to everyone.<br />
Holding one of the most comprehensive collections on meteorology anywhere in the world, the <strong>Library</strong><br />
<strong>and</strong> <strong>Archive</strong> are vital for the maintenance of the public memory of the weather, the storage<br />
of meteorological records <strong>and</strong> as an aid to learning.<br />
The <strong>Library</strong> <strong>and</strong> <strong>Archive</strong> collections include:<br />
• around 300,000 books, charts, atlases, journals, articles, microfiche <strong>and</strong> scientific papers on<br />
meteorology <strong>and</strong> climatology, for a variety of knowledge levels<br />
• audio-visual material including digitised images, slides, photographs, videos <strong>and</strong> DVDs<br />
• daily weather reports for the United Kingdom from 1861 to the present, <strong>and</strong> from around the world<br />
• marine weather log books<br />
• a number of the earliest weather diaries dating back to the late 18th century<br />
• artefacts, records <strong>and</strong> charts of historical interest; for example, a chart detailing the weather conditions<br />
for the D-Day L<strong>and</strong>ings, the weather records of Scott’s Antarctic expedition from 1911<br />
• rare books, including a 16th century edition of Aristotle’s <strong>Met</strong>eorologica, held on behalf of the<br />
Royal <strong><strong>Met</strong>eorological</strong> Society<br />
• a display of meteorological equipment <strong>and</strong> artefacts<br />
For more information about the <strong>Library</strong> <strong>and</strong> <strong>Archive</strong> please see our website at:<br />
www.metoffice.gov.uk/learning/library
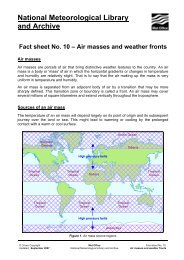
Introduction<br />
It is often said that Francis Beaufort, of the British Royal Navy, was the first to devise a scale of wind force –<br />
towards the start of the 19th century. However, in reality he was not, in fact, the originator of such a scale.<br />
A similar one was actually in use at least a century earlier – <strong>and</strong> probably long before that.<br />
We do not know who first devised a scale of wind force. But it would be surprising if medieval Arab<br />
seafarers did not use one because they had, by the late 15th century, classified in detail virtually every<br />
aspect of the weather that had any navigational significance.<br />
It would be surprising, too, if the mariners of ancient times did not use such a scale – but as they left so<br />
few records, we can only speculate.<br />
The scale we all know – the one that bears Beaufort’s name – was formulated at the start of the 19th<br />
century. But accounts from 1704 show that a similar scale was in use a century earlier.<br />
Daniel Defoe’s ‘Table of Degrees’<br />
Daniel Defoe, in his account of the dreadful<br />
tempest that visited the British Isles on 26–27<br />
November 1703, entitled ‘A Collection of the<br />
most remarkable Casualties <strong>and</strong> Disasters which<br />
happen’d in the late dreadful Tempest both by<br />
Sea <strong>and</strong> L<strong>and</strong>’, referred to a 12-point scale that he<br />
called a ‘table of degrees’. This comprised, as he<br />
put it, “bald terms used by our sailors”:<br />
Defoe’s ‘table of degrees’:<br />
• Stark calm<br />
• Calm weather<br />
• Little wind<br />
• A fine breeze<br />
• A small gale<br />
• A fresh gale<br />
• A topsail gale<br />
• Blows fresh<br />
• A hard gale of wind<br />
• A fret of wind<br />
• A storm<br />
• A tempest<br />
Figure 1. Daniel Defoe (c1661 to 1731)<br />
© <strong>National</strong> Maritime Museum, Greenwich, London.
Colonel Capper’s ‘Table of velocities <strong>and</strong> forces of the wind’<br />
By the beginning of the 19th century, a quantitative version of a wind scale had been devised, as a work<br />
by Colonel Capper of the East India Company shows. In his ‘Observations on the winds <strong>and</strong> monsoons’,<br />
1801, he reproduced “A table of the different velocities <strong>and</strong> forces of the winds, constructed by Mr Rous,<br />
with great care, from a considerable number of facts <strong>and</strong> experiments”.<br />
Terms of the wind<br />
Velocity of wind<br />
Miles in one hour Feet in one second<br />
Perpendicular force on one square<br />
foot in Avoirdupois pounds<br />
Almost calm 1 1.47 0.005<br />
Just perceptible<br />
Gentle breeze<br />
Fresh breeze<br />
Fresh gale<br />
Strong gale<br />
Hard gale<br />
2<br />
3<br />
4<br />
5<br />
10<br />
15<br />
20<br />
25<br />
30<br />
35<br />
40<br />
45<br />
2.93<br />
4.40<br />
5.87<br />
7.33<br />
14.64<br />
22.00<br />
29.34<br />
36.67<br />
44.01<br />
51.34<br />
56.68<br />
66.01<br />
0.020<br />
0.044<br />
0.079<br />
0.123<br />
0.492<br />
1.107<br />
1.968<br />
3.075<br />
4.429<br />
6.027<br />
7.873<br />
9.963<br />
Storm 50 75.35 12.300<br />
Violent hurricanes,<br />
tempests, etc.<br />
60<br />
80<br />
100<br />
Table 1. Velocities <strong>and</strong> forces of the wind by Mr Rous.<br />
88.02<br />
117.36<br />
146.70<br />
17.715<br />
31.490<br />
49.200<br />
From 1660 onwards, keeping weather records at places on l<strong>and</strong> became increasingly popular, <strong>and</strong> as early<br />
as 1723 James Jurin (1684–1750), then Secretary of the Royal Society, recommended a scale for observers<br />
to estimate <strong>and</strong> record wind strength.<br />
Sixty years later, in the Ephemerides published in the 1780s by the Palatine <strong><strong>Met</strong>eorological</strong> Society of<br />
Mannheim – the world’s first meteorological society – there appeared the following scale, in which halves<br />
were used to denote intermediate strengths.<br />
Number Specification<br />
0 Calm<br />
1 Leaves rustle<br />
2 Small branches move<br />
3 Large branches in motion <strong>and</strong> dust swirls up from the ground<br />
4 Twigs <strong>and</strong> branches break off trees<br />
Table 2. Wind scale as used in 1780.
Admiral Beaufort’s ‘Scale of wind force’<br />
Francis Beaufort devised his scale of wind force in 1805, when serving aboard HMS Woolwich, <strong>and</strong> first<br />
mentioned it in his private log on 13 January 1806, stating that he would, “hereafter estimate the force of<br />
the wind according to the following scale”.<br />
Figure 2. Beaufort’s diary from 1806 showing his original scale.<br />
Beaufort modified his scale in 1807, when he decided to combine categories 1 <strong>and</strong> 2 <strong>and</strong> thereafter used a<br />
scale extending from 0 to 12. In the same year, he added a description of the canvas that could be carried by<br />
a fully rigged frigate in different wind conditions. Like the observers of the Palatine <strong><strong>Met</strong>eorological</strong> Society,<br />
he frequently used halves, which suggests he was confident he could estimate wind force accurately.
Who was Beaufort?<br />
Francis Beaufort was born in Irel<strong>and</strong> in 1774, <strong>and</strong><br />
went to sea in 1787. He took comm<strong>and</strong> of HMS<br />
Woolwich in 1805. His seagoing career ended<br />
in 1812 when he was severely wounded in an<br />
encounter with Turks, while surveying the coast<br />
of Asia Minor.<br />
After convalescence, he pursued a number of<br />
scientific interests until, in 1829 when he was<br />
appointed Hydrographer of the Navy.<br />
At the time, he held the rank of captain. In 1831,<br />
Beaufort commissioned the celebrated voyage of<br />
the Beagle. During the voyage (December 1831 to<br />
October 1836), Beaufort’s scale of wind force was<br />
used officially for the first time.<br />
Beagle’s comm<strong>and</strong>er, Robert FitzRoy, subsequently<br />
became, in 1854, the first director of the body now<br />
known as the <strong>Met</strong> <strong>Office</strong>. He <strong>and</strong> Beaufort were<br />
close friends for many years.<br />
Beaufort was made a rear-admiral on the retired list<br />
in 1846, served as Hydrographer until 1855 <strong>and</strong><br />
died in 1857.<br />
A ‘private’ scale<br />
For many years, Beaufort’s scale of wind force was used only in his private logs. There is no mention of it in<br />
the official logs of HMS Woolwich or any other ships on which he served. Nor is there any mention of his<br />
scale of weather notation, also devised in 1805.<br />
In this notation, he assigned letters to weather types, examples being:<br />
b – blue sky<br />
r – rain<br />
fg – foggy<br />
cl – cloudy<br />
sh – showers<br />
Figure 3. Admiral Frances Beaufort<br />
A full <strong>and</strong> comprehensive list of the Beaufort letters can be found in fact <strong>sheet</strong> 11 – interpreting weather<br />
charts. These became known as the Beaufort Letters.<br />
The first published reference to Beaufort’s scales of wind force <strong>and</strong> weather notation came in 1832, when<br />
the Nautical Magazine carried an article entitled ‘The Log Board’.<br />
In this article, formulation of the scales was attributed to Beaufort, <strong>and</strong> the versions of the scales discussed<br />
were identical to those introduced later by the Admiralty in a memor<strong>and</strong>um issued in December 1838 to<br />
‘all Captains <strong>and</strong> Comm<strong>and</strong>ing <strong>Office</strong>rs of Her Majesty’s Ships <strong>and</strong> Vessels’.<br />
© <strong>National</strong> Maritime Museum,<br />
Greenwich, London, Greenwich Hospital Collection.
M E M O R A N D U M.<br />
Admiralty, Dec 28th, 1838<br />
The Lords Commissioners of the Admiralty having had under consideration the general utility of<br />
recording with clearness <strong>and</strong> precision, in the Log Books of all Her Majesty’s Ships <strong>and</strong> Vessels of<br />
War, the actual State of the Winds <strong>and</strong> Weather, have thought fit to order that henceforward in<br />
each page of the Log Book two columns should be introduced, wherein the force of the Wind <strong>and</strong><br />
the appearance of the Atmosphere shall be every hour registered according to the annexed scheme,<br />
a copy of which shall be pasted into each book <strong>and</strong> painted on the back of every Log Board or Log<br />
Slate <strong>and</strong> two more columns shall likewise be given for the purpose of entering the heights of the<br />
Barometer or Sympiesometer, <strong>and</strong> Thermometer, when such instruments may be on board.<br />
By Comm<strong>and</strong> of their Lordships,<br />
Figure 4. Admiralty memor<strong>and</strong>um, 28 December 1838.<br />
C. WOOD<br />
To denote the force of the wind <strong>and</strong> the state of the weather, Royal Navy officers were ordered to use the<br />
scales below.<br />
Beaufort<br />
number<br />
General<br />
description<br />
0 Calm Calm<br />
1 Light air Just sufficient to give steerage way<br />
Beaufort’s criterion<br />
2 Light breeze<br />
With which a well-conditioned man<br />
1 to 2 knots<br />
3 Gentle breeze of war, under all sail, <strong>and</strong> ‘clean full’,<br />
3 to 4 knots<br />
4 Moderate breeze<br />
would go in smooth water from...<br />
5 to 6 knots<br />
5 Fresh breeze<br />
royals<br />
6 Strong breeze<br />
In which a well-conditioned man of<br />
single-reefs <strong>and</strong> top-gallant sails<br />
7 Moderate gale war, under all sail, <strong>and</strong> ‘clean full’,<br />
double-reefs, jib, etc.<br />
8 Fresh gale<br />
could just carry close hauled...<br />
triple-reefs, courses, etc.<br />
9 Strong gale close-reefs <strong>and</strong> courses<br />
10 Whole gale With which she could only bear close-reefed maintop-sail <strong>and</strong> reefed fore-sail<br />
11 Storm With which she would be reduced to storm staysails<br />
12 Hurricane To which she could show no canvas<br />
Table 3. Beaufort’s criterion 1832.
An evolving system<br />
Beaufort’s scale of wind force was revised in 1874 to reflect changes in the rig of warships, <strong>and</strong> exp<strong>and</strong>ed<br />
two decades later to include particulars of the sail required by fishing smacks. A scale of equivalent wind<br />
speeds was introduced in 1903, its basis being the formula:<br />
V = 1.87 x square root (B 3 )<br />
where:<br />
B is the Beaufort number, <strong>and</strong><br />
V the corresponding wind speed in miles per hour 30 feet above the surface of the sea.<br />
By the early 20th century, the passing of sail made a specification based on the canvas carried by a sailing<br />
ship impractical. British meteorologist George Simpson proposed an alternative, a scale of wind force<br />
based on the sea’s appearance. It was devised in 1906 <strong>and</strong> soon accepted by mariners <strong>and</strong> meteorologists,<br />
but it was not adopted by the International <strong><strong>Met</strong>eorological</strong> Organization until 1939.<br />
The Beaufort scale was extended in 1944, when Forces 13 to 17 were added. Before that, Force 12<br />
(Hurricane) had been the highest point on the scale, referring to a sustained wind speed of 64 knots<br />
(32.7 metres per second) or more – that is, the wind speed averaged over a period of 10 minutes.<br />
The additional five points extended the scale to 118 knots (61.2 metres per second), with Force 12 referring<br />
only to speeds in the range 64 to 71 knots (32.7 to 36.9 metres per second). However, Forces 13 to<br />
17 were intended to apply only to special cases, such as tropical cyclones. They were not intended for<br />
ordinary use at sea – indeed, it is impossible to judge Forces 13 to 17 by the appearance of the sea.<br />
For all normal purposes, the Beaufort scale extends from Force 0 (calm) to Force 12 (Hurricane), with Force<br />
12 defined as a sustained wind of 64 knots (32.7 metres per second) or more.<br />
Beaufort’s scale of wind force assumed its present form around 1960, when probable wave heights <strong>and</strong><br />
probable maximum wave heights were added. The latter is the height of the highest wave expected in a<br />
period of 10 minutes, <strong>and</strong> wave heights refer to the open sea, well away from l<strong>and</strong>.<br />
Strictly, it applies only when the sea is fully developed; that is, when waves have reached their maximum<br />
height for a particular wind speed. Care must be exercised when the fetch <strong>and</strong> duration of the wind are<br />
limited (the fetch is the distance over which the wind has blown, <strong>and</strong> the duration the time it has been<br />
blowing). It is also worth remembering that the appearance of the sea’s surface is influenced not only by<br />
wind but also by swell (waves from far away), precipitation, tidal streams <strong>and</strong> other currents.
Force Description<br />
Specification<br />
for use at sea*<br />
Equivalent speed at 10 metres<br />
above sea level<br />
Mean Limits<br />
/knots /ms -1 /knots /ms -1<br />
0 Calm Sea like a mirror 0 0.0
Force Description<br />
9<br />
Strong<br />
gale<br />
10 Storm<br />
11<br />
Violent<br />
storm<br />
12 Hurricane<br />
Specification<br />
for use at sea*<br />
High waves. Dense<br />
streaks of foam along<br />
the direction of the<br />
wind. Crests of waves<br />
begin to topple,<br />
tumble <strong>and</strong> roll over.<br />
Spray may affect<br />
visibility<br />
Very high waves with<br />
long over-hanging<br />
crests. The resulting<br />
foam, in great<br />
patches, is blown in<br />
dense white streaks<br />
along the direction<br />
of the wind. On the<br />
whole the surface<br />
of the sea takes on a<br />
white appearance.<br />
The ‘tumbling’ of<br />
the sea becomes<br />
heavy <strong>and</strong> shock-like.<br />
Visibility affected<br />
Exceptionally high<br />
waves (small <strong>and</strong><br />
medium-sized ships<br />
might be for a time<br />
lost behind the<br />
waves). The sea is<br />
completely covered<br />
with long white<br />
patches of foam lying<br />
along the direction of<br />
the wind. Everywhere<br />
the edges of the wave<br />
crests are blown<br />
into froth. Visibility<br />
affected<br />
The air is filled with<br />
foam <strong>and</strong> spray. Sea<br />
completely white with<br />
driving spray; visibility<br />
very seriously affected<br />
Equivalent speed at 10 metres<br />
above sea level<br />
Mean Limits<br />
/knots /ms -1 /knots /ms -1<br />
44 22.6<br />
52 26.4<br />
60 30.5<br />
- -<br />
*These columns are a guide to show roughly what may be expected in the open sea, remote from l<strong>and</strong>.<br />
Figures in brackets indicate the probable maximum height of waves. In enclosed waters, or when near l<strong>and</strong><br />
with an offshore wind, wave heights will be smaller <strong>and</strong> the waves steeper.<br />
41<br />
to 47<br />
48<br />
to 55<br />
56<br />
to 63<br />
64 <strong>and</strong><br />
over<br />
Table 4. Beaufort scale: specifications <strong>and</strong> equivalent speeds.<br />
20.8 to<br />
24.4<br />
24.5 to<br />
28.4<br />
28.5 to<br />
32.6<br />
32.7<br />
<strong>and</strong><br />
over<br />
Description<br />
in forecast<br />
Severe<br />
gale<br />
State<br />
of sea<br />
Probable<br />
height of<br />
waves*<br />
/metres<br />
Very high 7.0 (10.0)<br />
Storm Very high 9.0 (12.5)<br />
Violent<br />
storm<br />
Hurricane<br />
force<br />
Phenomenal<br />
Phenomenal<br />
11.5<br />
(16.0)<br />
14.0<br />
(-)
Sea states based on the Beaufort Scale<br />
Figure 5. Sea appearance in winds of Force 0 (© N.C. Horner)<br />
Figure 6. Sea appearance in winds of Force 1 (© G.J. Simpson)
Sea states based on the Beaufort Scale<br />
Figure 7. Sea appearance in winds of Force 2 (© G.J. Simpson)<br />
Figure 8. Sea appearance in winds of Force 3 (© I.G. McNeil)
Sea states based on the Beaufort Scale<br />
Figure 9. Sea appearance in winds of Force 4 (© I.G. McNeil)<br />
Figure 10. Sea appearance in winds of Force 5 (© I.G. McNeil)
Sea states based on the Beaufort Scale<br />
Figure 11. Sea appearance in winds of Force 6 (© I.G. McNeil)<br />
Figure 12. Sea appearance in winds of Force 7 (© G.J. Simpson)
Sea states based on the Beaufort Scale<br />
Figure 13. Sea appearance in winds of Force 8 (© W.A.E. Smith)<br />
Figure 14. Sea appearance in winds of Force 9 (© J.P. Lacock)
Sea states based on the Beaufort Scale<br />
Figure 15. Sea appearance in winds of Force 10 (© G. Allen)<br />
Figure 16. Sea appearance in winds of Force 11 (© Crown)
Sea states based on the Beaufort Scale<br />
Figure 17. Sea appearance in winds of Force 12 (© J.F. Thompson)<br />
Douglas sea <strong>and</strong> swell scale<br />
Devised in the 1920s by Captain H.P. Douglas CMG, RN, Hydrographer of the Royal Navy, for estimating<br />
the roughness of the sea for navigation <strong>and</strong> recommended for international use in 1929, this scale consists<br />
of pairs of digits, each on a scale from 0 to 9, the first representing ‘sea’ <strong>and</strong> the second ‘swell’.<br />
Code<br />
figure<br />
Height<br />
(m)<br />
State of the sea Swell<br />
Description<br />
Code<br />
figure<br />
0 0 Calm (glassy) 0 No swell<br />
Description<br />
1 0 – 0.1 Calm (rippled) 1 Very low (short <strong>and</strong> low wave)<br />
2 0.1 – 0.5 Smooth (wavelets) 2 Low (long <strong>and</strong> low wave)<br />
3 0.5 – 1.25 Slight 3 Light (short <strong>and</strong> moderate wave)<br />
4 1.25 – 2.5 Moderate 4 Moderate (average <strong>and</strong> moderate wave)<br />
5 2.5 – 4.0 Rough 5 Moderate rough (long <strong>and</strong> moderate wave)<br />
6 4.0 – 6.0 Very rough 6 Rough (short <strong>and</strong> heavy wave)<br />
7 6.0 – 9.0 High 7 High (average <strong>and</strong> heavy wave)<br />
8 9.0 – 14.0 Very high 8 Very high (long <strong>and</strong> heavy wave)<br />
9 Over 14.0 Phenomenal 9 Confused (wave length <strong>and</strong> height indefinable)<br />
Table 5. Douglas sea <strong>and</strong> swell scale.
Classification<br />
Wave length<br />
Short wave – wave length: < 100 m<br />
Average wave – wave length: 100 m to 200 m<br />
Long wave – wave length: > 200 m<br />
Wave height<br />
Low wave – wave height: < 2 m<br />
Moderate wave – wave height: 2 m to 4 m<br />
High wave – wave height: > 4.0 m<br />
Observations on l<strong>and</strong><br />
George Simpson devised a scale for l<strong>and</strong>-based observers in 1906. Similar in concept to the scale used by<br />
the Palatine <strong><strong>Met</strong>eorological</strong> Society, it has subsequently been altered very little.<br />
Soon after its introduction, Simpson’s version of the Beaufort scale was illustrated in a humorous but<br />
effective way.<br />
The scale for observers on l<strong>and</strong> is a useful <strong>and</strong> reasonably accurate tool for estimating wind strength.<br />
The scale for seafarers, however, is no more than ‘a guide to show roughly what may be expected on the<br />
open sea, remote from l<strong>and</strong>’ – to quote from the warning that used to be attached to the copies of the<br />
scale issued to marine observers.<br />
Figure 18. Simpson’s scale cartoon (right)<br />
Wave length<br />
Wave<br />
height
This fact <strong>sheet</strong> has been produced by the <strong>National</strong> <strong><strong>Met</strong>eorological</strong> <strong>Library</strong> in conjunction with the<br />
<strong>Met</strong> <strong>Office</strong>’s <strong>National</strong> Climate Information Centre.<br />
All of the images used in this fact <strong>sheet</strong> along with many others covering all aspects of meteorology can be<br />
obtained from the <strong>National</strong> <strong><strong>Met</strong>eorological</strong> <strong>Library</strong>.<br />
For more information about available images, please contact the <strong>Library</strong> Information <strong>Office</strong>r:<br />
Tel: 01392 884845<br />
Email: metlib@metoffice.gov.uk<br />
For more information about the <strong>Met</strong> <strong>Office</strong>, please contact the Customer Centre on:<br />
Tel: 0870 900 0100<br />
Fax: 0870 900 5050<br />
Email: enquiries@metoffice.gov.uk<br />
If you are outside the UK:<br />
Tel: +44 (0)1392 885680<br />
Fax: +44 (0)1392 885681
Other titles in this series still available are:<br />
• Number 1 Clouds<br />
• Number 2 Thunderstorms<br />
• Number 3 Water in the atmosphere<br />
• Number 4 Climate of the British Isles<br />
• Number 5 White Christmas<br />
• Number 7 Climate of South West Engl<strong>and</strong><br />
• Number 8 The Shipping Forecast<br />
• Number 9 Weather extremes<br />
• Number 10 Air Masses <strong>and</strong> Weather Fronts<br />
• Number 11 Interpreting Weather Charts<br />
• Number 12 <strong>National</strong> <strong><strong>Met</strong>eorological</strong> <strong>Archive</strong><br />
• Number 13 Upper Air Observation <strong>and</strong> the Tephigram<br />
• Number 14 Microclimates<br />
• Number 15 Weather Radar<br />
• Number 16 World Climates<br />
• Number 17 Weather Observations
Our unique collection of weather images is now available via the <strong>National</strong> <strong><strong>Met</strong>eorological</strong> <strong>Library</strong><br />
<strong>and</strong> <strong>Archive</strong>’s online catalogue.<br />
The collection illustrates all aspects of meteorology, from clouds <strong>and</strong> weather phenomena,<br />
to instruments <strong>and</strong> the work of the <strong>Met</strong> <strong>Office</strong>. Our online catalogue can be found at:<br />
library.metoffice.gov.uk<br />
All of the fact <strong>sheet</strong>s in this series are available to download from our website<br />
The full list can be found at:<br />
www.metoffice.gov.uk/learning/library/publications/fact<strong>sheet</strong>s<br />
<strong>Met</strong> <strong>Office</strong><br />
FitzRoy Road, Exeter<br />
Devon, EX1 3PB<br />
United Kingdom<br />
Tel: 0870 900 0100<br />
Fax: 0870 900 5050<br />
enquiries@metoffice.gov.uk<br />
www.metoffice.gov.uk<br />
Produced by the <strong>Met</strong> <strong>Office</strong>.<br />
© Crown copyright 2010 10/0425<br />
<strong>Met</strong> <strong>Office</strong> <strong>and</strong> the <strong>Met</strong> <strong>Office</strong> logo<br />
are registered trademarks