Report - Maryland Department of the Environment
Report - Maryland Department of the Environment
Report - Maryland Department of the Environment

Create successful ePaper yourself
Turn your PDF publications into a flip-book with our unique Google optimized e-Paper software.
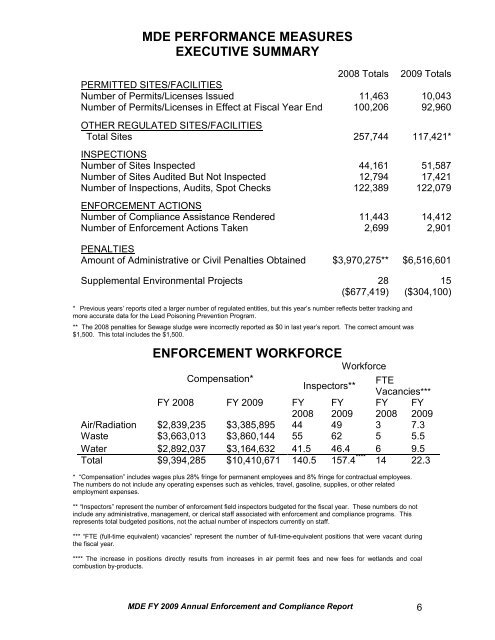
MDE PERFORMANCE MEASURES<br />
EXECUTIVE SUMMARY<br />
2008 Totals 2009 Totals<br />
PERMITTED SITES/FACILITIES<br />
Number <strong>of</strong> Permits/Licenses Issued 11,463 10,043<br />
Number <strong>of</strong> Permits/Licenses in Effect at Fiscal Year End 100,206 92,960<br />
OTHER REGULATED SITES/FACILITIES<br />
Total Sites 257,744 117,421*<br />
INSPECTIONS<br />
Number <strong>of</strong> Sites Inspected 44,161 51,587<br />
Number <strong>of</strong> Sites Audited But Not Inspected 12,794 17,421<br />
Number <strong>of</strong> Inspections, Audits, Spot Checks 122,389 122,079<br />
ENFORCEMENT ACTIONS<br />
Number <strong>of</strong> Compliance Assistance Rendered 11,443 14,412<br />
Number <strong>of</strong> Enforcement Actions Taken 2,699 2,901<br />
PENALTIES<br />
Amount <strong>of</strong> Administrative or Civil Penalties Obtained $3,970,275** $6,516,601<br />
Supplemental <strong>Environment</strong>al Projects 28<br />
($677,419)<br />
* Previous years’ reports cited a larger number <strong>of</strong> regulated entities, but this year’s number reflects better tracking and<br />
more accurate data for <strong>the</strong> Lead Poisoning Prevention Program.<br />
** The 2008 penalties for Sewage sludge were incorrectly reported as $0 in last year’s report. The correct amount was<br />
$1,500. This total includes <strong>the</strong> $1,500.<br />
ENFORCEMENT WORKFORCE<br />
Workforce<br />
MDE FY 2009 Annual Enforcement and Compliance <strong>Report</strong> 6<br />
15<br />
($304,100)<br />
Compensation*<br />
Inspectors**<br />
FTE<br />
Vacancies***<br />
FY 2008 FY 2009 FY FY FY FY<br />
2008 2009 2008 2009<br />
Air/Radiation $2,839,235 $3,385,895 44 49 3 7.3<br />
Waste $3,663,013 $3,860,144 55 62 5 5.5<br />
Water $2,892,037 $3,164,632 41.5 46.4 6 9.5<br />
Total $9,394,285 $10,410,671 140.5 157.4 **** 14 22.3<br />
* “Compensation” includes wages plus 28% fringe for permanent employees and 8% fringe for contractual employees.<br />
The numbers do not include any operating expenses such as vehicles, travel, gasoline, supplies, or o<strong>the</strong>r related<br />
employment expenses.<br />
** “Inspectors” represent <strong>the</strong> number <strong>of</strong> enforcement field inspectors budgeted for <strong>the</strong> fiscal year. These numbers do not<br />
include any administrative, management, or clerical staff associated with enforcement and compliance programs. This<br />
represents total budgeted positions, not <strong>the</strong> actual number <strong>of</strong> inspectors currently on staff.<br />
*** “FTE (full-time equivalent) vacancies” represent <strong>the</strong> number <strong>of</strong> full-time-equivalent positions that were vacant during<br />
<strong>the</strong> fiscal year.<br />
**** The increase in positions directly results from increases in air permit fees and new fees for wetlands and coal<br />
combustion by-products.