

TABLE OF CONTENTS - Report Card Home
TABLE OF CONTENTS - Report Card Home
TABLE OF CONTENTS - Report Card Home

You also want an ePaper? Increase the reach of your titles
YUMPU automatically turns print PDFs into web optimized ePapers that Google loves.
Supplier Delivery Performance Manual <strong>Report</strong> <strong>Card</strong><br />
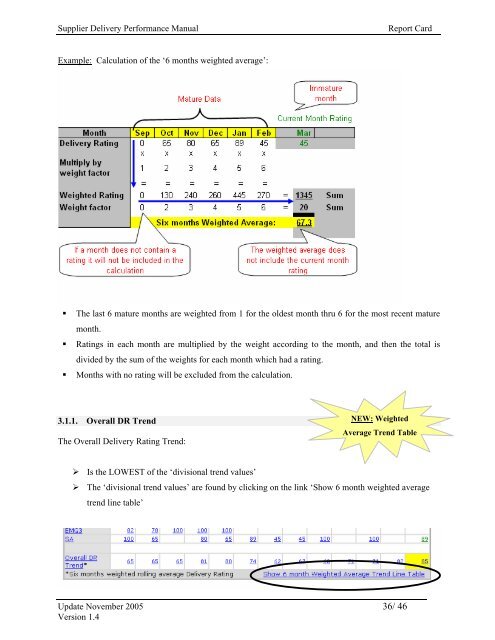
Example: Calculation of the ‘6 months weighted average’:<br />
� The last 6 mature months are weighted from 1 for the oldest month thru 6 for the most recent mature<br />
month.<br />
� Ratings in each month are multiplied by the weight according to the month, and then the total is<br />
divided by the sum of the weights for each month which had a rating.<br />
� Months with no rating will be excluded from the calculation.<br />
3.1.1. Overall DR Trend<br />
The Overall Delivery Rating Trend:<br />
� Is the LOWEST of the ‘divisional trend values’<br />
� The ‘divisional trend values’ are found by clicking on the link ‘Show 6 month weighted average<br />
trend line table’<br />
NEW: Weighted<br />
Average Trend Table<br />
Update November 2005 36/ 46<br />
Version 1.4