

6 - World Journal of Gastroenterology
6 - World Journal of Gastroenterology
6 - World Journal of Gastroenterology

Create successful ePaper yourself
Turn your PDF publications into a flip-book with our unique Google optimized e-Paper software.
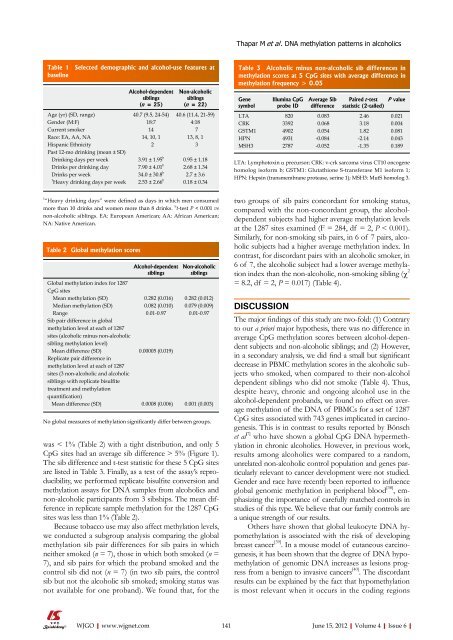
Table 1 Selected demographic and alcohol-use features at<br />
baseline<br />
Alcohol-dependent<br />
siblings<br />
(n = 25)<br />
Non-alcoholic<br />
siblings<br />
(n = 22)<br />
Age (yr) (SD, range) 40.7 (9.5, 24-54) 40.6 (11.4, 21-59)<br />
Gender (M:F) 18:7 4:18<br />
Current smoker 14 7<br />
Race: EA, AA, NA 14, 10, 1 13, 8, 1<br />
Hispanic Ethnicity<br />
Past 12-mo drinking (mean ± SD)<br />
2 3<br />
Drinking days per week 3.91 ± 1.95 b<br />
0.95 ± 1.18<br />
Drinks per drinking day 7.90 ± 4.01 b<br />
2.68 ± 1.34<br />
Drinks per week 34.0 ± 30.8 b<br />
2.7 ± 3.6<br />
1 Heavy drinking days per week 2.53 ± 2.66 b<br />
0.18 ± 0.34<br />
1 “Heavy drinking days” were defined as days in which men consumed<br />
more than 10 drinks and women more than 8 drinks. b t-test P < 0.001 vs<br />
non-alcoholic siblings. EA: European American; AA: African American;<br />
NA: Native American.<br />
Table 2 Global methylation scores<br />
Alcohol-dependent<br />
siblings<br />
Non-alcoholic<br />
siblings<br />
Global methylation index for 1287<br />
CpG sites<br />
Mean methylation (SD) 0.282 (0.016) 0.282 (0.012)<br />
Median methylation (SD) 0.082 (0.010) 0.079 (0.009)<br />
Range 0.01-0.97 0.01-0.97<br />
Sib pair difference in global<br />
methylation level at each <strong>of</strong> 1287<br />
sites (alcoholic minus non-alcoholic<br />
sibling methylation level)<br />
Mean difference (SD) 0.00005 (0.019)<br />
Replicate pair difference in<br />
methylation level at each <strong>of</strong> 1287<br />
sites (3 non-alcoholic and alcoholic<br />
siblings with replicate bisulfite<br />
treatment and methylation<br />
quantification)<br />
Mean difference (SD) 0.0008 (0.006) 0.001 (0.003)<br />
No global measures <strong>of</strong> methylation significantly differ between groups.<br />
was < 1% (Table 2) with a tight distribution, and only 5<br />
CpG sites had an average sib difference > 5% (Figure 1).<br />
The sib difference and t-test statistic for these 5 CpG sites<br />
are listed in Table 3. Finally, as a test <strong>of</strong> the assay’s reproducibility,<br />
we performed replicate bisulfite conversion and<br />
methylation assays for DNA samples from alcoholics and<br />
non-alcoholic participants from 3 sibships. The mean difference<br />
in replicate sample methylation for the 1287 CpG<br />
sites was less than 1% (Table 2).<br />
Because tobacco use may also affect methylation levels,<br />
we conducted a subgroup analysis comparing the global<br />
methylation sib pair differences for sib pairs in which<br />
neither smoked (n = 7), those in which both smoked (n =<br />
7), and sib pairs for which the proband smoked and the<br />
control sib did not (n = 7) (in two sib pairs, the control<br />
sib but not the alcoholic sib smoked; smoking status was<br />
not available for one proband). We found that, for the<br />
Thapar M et al . DNA methylation patterns in alcoholics<br />
Table 3 Alcoholic minus non-alcoholic sib differences in<br />
methylation scores at 5 CpG sites with average difference in<br />
methylation frequency > 0.05<br />
Gene<br />
symbol<br />
Illumina CpG<br />
probe ID<br />
two groups <strong>of</strong> sib pairs concordant for smoking status,<br />
compared with the non-concordant group, the alcoholdependent<br />
subjects had higher average methylation levels<br />
at the 1287 sites examined (F = 284, df = 2, P < 0.001).<br />
Similarly, for non-smoking sib pairs, in 6 <strong>of</strong> 7 pairs, alcoholic<br />
subjects had a higher average methylation index. In<br />
contrast, for discordant pairs with an alcoholic smoker, in<br />
6 <strong>of</strong> 7, the alcoholic subject had a lower average methylation<br />
index than the non-alcoholic, non-smoking sibling (χ 2<br />
= 8.2, df = 2, P = 0.017) (Table 4).<br />
DISCUSSION<br />
Average Sib<br />
difference<br />
Paired t -test P value<br />
statistic (2-tailed)<br />
LTA 820 0.083 2.46 0.021<br />
CRK 3392 0.068 3.18 0.004<br />
GSTM1 4902 0.054 1.82 0.081<br />
HPN 4931 -0.084 -2.14 0.043<br />
MSH3 2787 -0.052 -1.35 0.189<br />
LTA: Lymphotoxin α precursor; CRK: v-crk sarcoma virus CT10 oncogene<br />
homolog is<strong>of</strong>orm b; GSTM1: Glutathione S-transferase M1 is<strong>of</strong>orm 1;<br />
HPN: Hepsin (transmembrane protease, serine 1); MSH3: MutS homolog 3.<br />
The major findings <strong>of</strong> this study are two-fold: (1) Contrary<br />
to our a priori major hypothesis, there was no difference in<br />
average CpG methylation scores between alcohol-dependent<br />
subjects and non-alcoholic siblings; and (2) However,<br />
in a secondary analysis, we did find a small but significant<br />
decrease in PBMC methylation scores in the alcoholic subjects<br />
who smoked, when compared to their non-alcohol<br />
dependent siblings who did not smoke (Table 4). Thus,<br />
despite heavy, chronic and ongoing alcohol use in the<br />
alcohol-dependent probands, we found no effect on average<br />
methylation <strong>of</strong> the DNA <strong>of</strong> PBMCs for a set <strong>of</strong> 1287<br />
CpG sites associated with 743 genes implicated in carcinogenesis.<br />
This is in contrast to results reported by Bönsch<br />
et al [7] who have shown a global CpG DNA hypermethylation<br />
in chronic alcoholics. However, in previous work,<br />
results among alcoholics were compared to a random,<br />
unrelated non-alcoholic control population and genes particularly<br />
relevant to cancer development were not studied.<br />
Gender and race have recently been reported to influence<br />
global genomic methylation in peripheral blood [38] , emphasizing<br />
the importance <strong>of</strong> carefully matched controls in<br />
studies <strong>of</strong> this type. We believe that our family controls are<br />
a unique strength <strong>of</strong> our results.<br />
Others have shown that global leukocyte DNA hypomethylation<br />
is associated with the risk <strong>of</strong> developing<br />
breast cancer [39] . In a mouse model <strong>of</strong> cutaneous carcinogenesis,<br />
it has been shown that the degree <strong>of</strong> DNA hypomethylation<br />
<strong>of</strong> genomic DNA increases as lesions progress<br />
from a benign to invasive cancers [40] . The discordant<br />
results can be explained by the fact that hypomethylation<br />
is most relevant when it occurs in the coding regions<br />
WJGO|www.wjgnet.com 141<br />
June 15, 2012|Volume 4|Issue 6|


