Long-Term Clinical Significance of the Prevention ... - Karger
Long-Term Clinical Significance of the Prevention ... - Karger
Long-Term Clinical Significance of the Prevention ... - Karger

You also want an ePaper? Increase the reach of your titles
YUMPU automatically turns print PDFs into web optimized ePapers that Google loves.
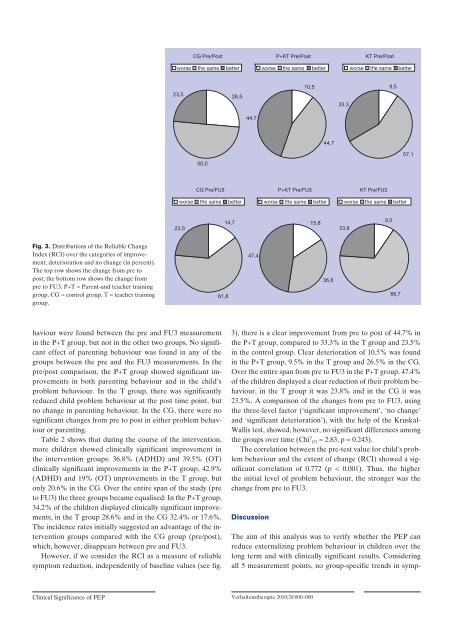
Fig. 3. Distributions <strong>of</strong> <strong>the</strong> Reliable Change<br />
Index (RCI) over <strong>the</strong> categories <strong>of</strong> improvement,<br />
deterioration and no change (in percent).<br />
The top row shows <strong>the</strong> change from pre to<br />
post; <strong>the</strong> bottom row shows <strong>the</strong> change from<br />
pre to FU3. P+T = Parent-and teacher training<br />
group, CG = control group, T = teacher training<br />
group.<br />
<strong>Clinical</strong> <strong>Significance</strong> <strong>of</strong> PEP<br />
23,5<br />
23,5<br />
haviour were found between <strong>the</strong> pre and FU3 measurement<br />
in <strong>the</strong> P+T group, but not in <strong>the</strong> o<strong>the</strong>r two groups. No significant<br />
effect <strong>of</strong> parenting behaviour was found in any <strong>of</strong> <strong>the</strong><br />
groups between <strong>the</strong> pre and <strong>the</strong> FU3 measurements. In <strong>the</strong><br />
pre/post comparison, <strong>the</strong> P+T group showed significant improvements<br />
in both parenting behaviour and in <strong>the</strong> child’s<br />
problem behaviour. In <strong>the</strong> T group, <strong>the</strong>re was significantly<br />
reduced child problem behaviour at <strong>the</strong> post time point, but<br />
no change in parenting behaviour. In <strong>the</strong> CG, <strong>the</strong>re were no<br />
significant changes from pre to post in ei<strong>the</strong>r problem behaviour<br />
or parenting.<br />
Table 2 shows that during <strong>the</strong> course <strong>of</strong> <strong>the</strong> intervention,<br />
more children showed clinically significant improvement in<br />
<strong>the</strong> intervention groups: 36.8% (ADHD) and 39.5% (OT)<br />
clinically significant improvements in <strong>the</strong> P+T group, 42.9%<br />
(ADHD) and 19% (OT) improvements in <strong>the</strong> T group, but<br />
only 20.6% in <strong>the</strong> CG. Over <strong>the</strong> entire span <strong>of</strong> <strong>the</strong> study (pre<br />
to FU3) <strong>the</strong> three groups became equalised: In <strong>the</strong> P+T group,<br />
34.2% <strong>of</strong> <strong>the</strong> children displayed clinically significant improvements,<br />
in <strong>the</strong> T group 28.6% and in <strong>the</strong> CG 32.4% or 17.6%.<br />
The incidence rates initially suggested an advantage <strong>of</strong> <strong>the</strong> intervention<br />
groups compared with <strong>the</strong> CG group (pre/post),<br />
which, however, disappears between pre and FU3.<br />
However, if we consider <strong>the</strong> RCI as a measure <strong>of</strong> reliable<br />
symptom reduction, independently <strong>of</strong> baseline values (see fig.<br />
CG Pre/Post P+KT Pre/Post KT Pre/Post<br />
worse <strong>the</strong> same better worse <strong>the</strong> same better worse <strong>the</strong> same better<br />
50,0<br />
26,5<br />
44,7<br />
3), <strong>the</strong>re is a clear improvement from pre to post <strong>of</strong> 44.7% in<br />
<strong>the</strong> P+T group, compared to 33.3% in <strong>the</strong> T group and 23.5%<br />
in <strong>the</strong> control group. Clear deterioration <strong>of</strong> 10.5% was found<br />
in <strong>the</strong> P+T group, 9.5% in <strong>the</strong> T group and 26.5% in <strong>the</strong> CG.<br />
Over <strong>the</strong> entire span from pre to FU3 in <strong>the</strong> P+T group, 47.4%<br />
<strong>of</strong> <strong>the</strong> children displayed a clear reduction <strong>of</strong> <strong>the</strong>ir problem behaviour,<br />
in <strong>the</strong> T group it was 23.8% and in <strong>the</strong> CG it was<br />
23.5%. A comparison <strong>of</strong> <strong>the</strong> changes from pre to FU3, using<br />
<strong>the</strong> three-level factor (‘significant improvement’, ‘no change’<br />
and ‘significant deterioration’), with <strong>the</strong> help <strong>of</strong> <strong>the</strong> Kruskal-<br />
Wallis test, showed, however, no significant differences among<br />
<strong>the</strong> groups over time (Chi 2 (2) = 2.83, p = 0.243).<br />
The correlation between <strong>the</strong> pre-test value for child’s problem<br />
behaviour and <strong>the</strong> extent <strong>of</strong> change (RCI) showed a significant<br />
correlation <strong>of</strong> 0.772 (p < 0.001). Thus, <strong>the</strong> higher<br />
<strong>the</strong> initial level <strong>of</strong> problem behaviour, <strong>the</strong> stronger was <strong>the</strong><br />
change from pre to FU3.<br />
Discussion<br />
10,5<br />
The aim <strong>of</strong> this analysis was to verify whe<strong>the</strong>r <strong>the</strong> PEP can<br />
reduce externalizing problem behaviour in children over <strong>the</strong><br />
long term and with clinically significant results. Considering<br />
all 5 measurement points, no group-specific trends in symp-<br />
Verhaltens<strong>the</strong>rapie 2010;20:000–000<br />
44,7<br />
33,3<br />
CG Pre/FU3 P+KT Pre/FU3 KT Pre/FU3<br />
worse <strong>the</strong> same better worse <strong>the</strong> same better worse <strong>the</strong> same better<br />
61,8<br />
14,7<br />
47,4<br />
15,8<br />
36,8<br />
23,8<br />
9,5<br />
9,5<br />
66,7<br />
57,1