Macular Edema: Definition and Basic Concepts - Karger
Macular Edema: Definition and Basic Concepts - Karger
Macular Edema: Definition and Basic Concepts - Karger

Create successful ePaper yourself
Turn your PDF publications into a flip-book with our unique Google optimized e-Paper software.
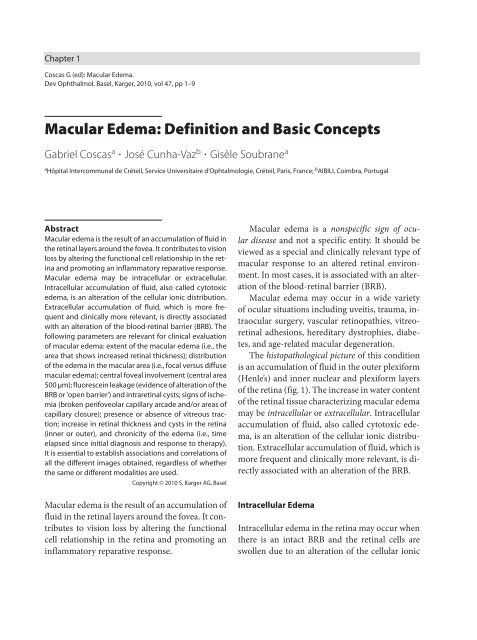
Chapter 1<br />
Coscas G (ed): <strong>Macular</strong> <strong>Edema</strong>.<br />
Dev Ophthalmol. Basel, <strong>Karger</strong>, 2010, vol 47, pp 1–9<br />
<strong>Macular</strong> <strong>Edema</strong>: <strong>Definition</strong> <strong>and</strong> <strong>Basic</strong> <strong>Concepts</strong><br />
Gabriel Coscas a � José Cunha-Vaz b � Gisèle Soubrane a<br />
a Hôpital Intercommunal de Créteil, Service Universitaire d’Ophtalmologie, Créteil, Paris, France; b AIBILI, Coimbra, Portugal<br />
Abstract<br />
<strong>Macular</strong> edema is the result of an accumulation of fluid in<br />
the retinal layers around the fovea. It contributes to vision<br />
loss by altering the functional cell relationship in the retina<br />
<strong>and</strong> promoting an inflammatory reparative response.<br />
<strong>Macular</strong> edema may be intracellular or extracellular.<br />
Intracellular accumulation of fluid, also called cytotoxic<br />
edema, is an alteration of the cellular ionic distribution.<br />
Extracellular accumulation of fluid, which is more frequent<br />
<strong>and</strong> clinically more relevant, is directly associated<br />
with an alteration of the blood-retinal barrier (BRB). The<br />
following parameters are relevant for clinical evaluation<br />
of macular edema: extent of the macular edema (i.e., the<br />
area that shows increased retinal thickness); distribution<br />
of the edema in the macular area (i.e., focal versus diffuse<br />
macular edema); central foveal involvement (central area<br />
500 μm); fluorescein leakage (evidence of alteration of the<br />
BRB or 'open barrier') <strong>and</strong> intraretinal cysts; signs of ischemia<br />
(broken perifoveolar capillary arcade <strong>and</strong>/or areas of<br />
capillary closure); presence or absence of vitreous traction;<br />
increase in retinal thickness <strong>and</strong> cysts in the retina<br />
(inner or outer), <strong>and</strong> chronicity of the edema (i.e., time<br />
elapsed since initial diagnosis <strong>and</strong> response to therapy).<br />
It is essential to establish associations <strong>and</strong> correlations of<br />
all the different images obtained, regardless of whether<br />
the same or different modalities are used.<br />
Copyright © 2010 S. <strong>Karger</strong> AG, Basel<br />
<strong>Macular</strong> edema is the result of an accumulation of<br />
fluid in the retinal layers around the fovea. It contributes<br />
to vision loss by altering the functional<br />
cell relationship in the retina <strong>and</strong> promoting an<br />
inflammatory reparative response.<br />
<strong>Macular</strong> edema is a nonspecific sign of ocular<br />
disease <strong>and</strong> not a specific entity. It should be<br />
viewed as a special <strong>and</strong> clinically relevant type of<br />
macular response to an altered retinal environment.<br />
In most cases, it is associated with an alteration<br />
of the blood-retinal barrier (BRB).<br />
<strong>Macular</strong> edema may occur in a wide variety<br />
of ocular situations including uveitis, trauma, intraocular<br />
surgery, vascular retinopathies, vitreoretinal<br />
adhesions, hereditary dystrophies, diabetes,<br />
<strong>and</strong> age-related macular degeneration.<br />
The histopathological picture of this condition<br />
is an accumulation of fluid in the outer plexiform<br />
(Henle’s) <strong>and</strong> inner nuclear <strong>and</strong> plexiform layers<br />
of the retina (fig. 1). The increase in water content<br />
of the retinal tissue characterizing macular edema<br />
may be intracellular or extracellular. Intracellular<br />
accumulation of fluid, also called cytotoxic edema,<br />
is an alteration of the cellular ionic distribution.<br />
Extracellular accumulation of fluid, which is<br />
more frequent <strong>and</strong> clinically more relevant, is directly<br />
associated with an alteration of the BRB.<br />
Intracellular <strong>Edema</strong><br />
Intracellular edema in the retina may occur when<br />
there is an intact BRB <strong>and</strong> the retinal cells are<br />
swollen due to an alteration of the cellular ionic
Fig. 1. Schematic presentation of<br />
the inner <strong>and</strong> outer BRBs <strong>and</strong> their<br />
relative location. ECF = Extracellular<br />
fluid.<br />
distribution, resulting in excessive accumulation<br />
of sodium ions (Na + ) inside the cells.<br />
This is known as cytotoxic edema. It may be induced<br />
by accumulation of excitatory neurotransmitters,<br />
such as glutamate, or excessive accumulation<br />
of lactic acid, or it may be the immediate<br />
result of ischemia, trauma, or toxic cell damage.<br />
Extracellular <strong>Edema</strong><br />
Inner BRB<br />
Junctions<br />
Outer BRB<br />
Extracellular edema is directly associated with an<br />
open BRB (i.e., it is caused by a breakdown of the inner<br />
or outer BRB). The increase in tissue volume is<br />
due to an increase in the retinal extracellular space.<br />
Retinal capillary blood<br />
Choroidal capillary blood<br />
Neurons<br />
Pigment<br />
epithelium<br />
Connective<br />
tissue<br />
Choroid<br />
endothelium<br />
Breakdown of the BRB is identified by fluorescein<br />
leakage, which can be detected in a clinical environment<br />
by fluorescein angiography (FA) or vitreous<br />
fluorometry measurements. Starling’s law a ,<br />
which governs the movements of fluids, applies in<br />
this type of edema (Cunha-Vaz et al., 1984) 1 .<br />
After a breakdown of the BRB, the progression<br />
of retinal edema depends directly on the hydrostatic<br />
pressure difference (ΔP) <strong>and</strong> osmotic<br />
pressure difference (Δπ) gradients. In these conditions,<br />
tissue compliance becomes more important,<br />
directly influencing the rate of edema progression.<br />
Thus, in the presence of retinal edema,<br />
it is essential to recognize whether the edema has<br />
arisen due to an intact or open BRB.<br />
a Starling’s law: In extracellular edema, the ‘force’ driving water across the capillary wall is the result of a hydrostatic pressure difference<br />
(ΔP) <strong>and</strong> an effective osmotic pressure difference (Δπ). The equation regulating fluid movements across the BRB is: driving force = Lp<br />
[(Pplasma – Ptissue) – σ (πplasma – πtissue)], where Lp is the membrane permeability of the BRB; σ is an osmotic reflection coefficient; Pplasma is<br />
blood pressure, <strong>and</strong> Ptissue is the retinal tissue osmotic pressure. An increase in ΔP, contributing to retinal edema, may be due to an increase<br />
in Pplasma <strong>and</strong>/or a decrease in Ptissue. An increase in Pplasma due to increased systemic blood pressure contributes to retinal edema<br />
formation only after loss of autoregulation of retinal blood flow <strong>and</strong> alteration of the characteristics of the BRB. A decrease in Ptissue is<br />
an important component that has previously not been given sufficient attention. Any loss in the cohesiveness of the retinal tissue due<br />
to pathologies, such as cyst formation, vitreous traction, or pulling at the inner limiting membrane, will lead to a decrease in Ptissue.<br />
A decrease in Ptissue (i.e., increased retinal tissue compliance) may lead to fluid accumulation, edema formation, <strong>and</strong> an increase in<br />
retinal thickness. A decrease in Δπ contributing to retinal edema may occur due to increased protein accumulation in the retina after<br />
breakdown of the BRB. Extravasation of proteins will draw more water into the retina. This is the main factor provoking a decrease in<br />
Δπ, as a reduction in plasma osmolarity high enough to contribute to edema formation is an extremely rare event.<br />
2 Coscas � Cunha-Vaz � Soubrane<br />
ECF<br />
Endothelium<br />
Pericapillary<br />
glia
BRB breakdown leading to macular edema may<br />
be mediated by locally released cytokines, <strong>and</strong> it<br />
induces an inflammatory reparative response creating<br />
the conditions for further release of cytokines<br />
<strong>and</strong> growth factors. The BRB cells, retinal<br />
endothelial cells, <strong>and</strong> retinal pigment epithelium<br />
(RPE) cells are both the target <strong>and</strong> producer of eicosanoids,<br />
growth factors, <strong>and</strong> cytokines.<br />
<strong>Macular</strong> edema is one of the most serious consequences<br />
of inflammation in the retinal tissue.<br />
Inflammatory cells can alter the permeability of<br />
the tight junctions that maintain the inner <strong>and</strong><br />
outer BRB. Cell migration may occur primarily<br />
through splitting of the junctional complexes or<br />
through the formation of channels or pores across<br />
the junctional complexes.<br />
Clinical Evaluation of <strong>Macular</strong> <strong>Edema</strong><br />
The clinical evaluation of macular edema has been<br />
difficult to characterize, but evaluation has become<br />
more precise with the help of modern imaging such<br />
as FA <strong>and</strong> optical coherence tomography (OCT).<br />
The following parameters are relevant for clinical<br />
evaluation of macular edema: extent of the<br />
macular edema (i.e., the area that shows increased<br />
retinal thickness); distribution of the edema in the<br />
macular area (i.e., focal versus diffuse macular edema);<br />
central fovea involvement (central area 500<br />
μm); fluorescein leakage (evidence of alteration of<br />
BRB or ‘open barrier’) <strong>and</strong> intraretinal cysts; signs<br />
of ischemia (broken perifoveolar capillary arcade<br />
<strong>and</strong>/or areas of capillary closure); presence or absence<br />
of vitreous traction; increase in retinal thickness<br />
<strong>and</strong> cysts in the retina (inner or outer), <strong>and</strong><br />
chronicity of the edema (i.e., time elapsed since<br />
first diagnosis <strong>and</strong> response to therapy).<br />
Direct <strong>and</strong> Indirect Ophthalmoscopy<br />
Direct <strong>and</strong> indirect ophthalmoscopy may show<br />
only an alteration of the foveal reflexes. Slit<br />
lamp biomicroscopy <strong>and</strong> stereoscopic fundus<br />
photography have played an important role in<br />
demonstrating changes in retinal volume in the<br />
macular area, but they are dependent on the observer’s<br />
experience, <strong>and</strong> the results do not offer a<br />
reproducible measurement of the volume change<br />
(Gonzalez et al., 1995) 2 .<br />
The Early Treatment Diabetic Retinopathy<br />
Study specified the following characteristics as<br />
indicating clinically significant macular edema:<br />
(1) thickening of the retina (as seen by slit lamp<br />
biomicroscopy or stereoscopic fundus photography)<br />
at or within 500 μm of the center of the<br />
macula; (2) hard exudates at or within 500 μm of<br />
the center of the macula associated with thickening<br />
of the adjacent retina (but not residual hard<br />
exudates remaining after disappearance of retinal<br />
thickening), <strong>and</strong> (3) a zone or zones of retinal<br />
thickening 1 disk in area or larger in size, any part<br />
of which is within 1 disk diameter of the center<br />
of the macula. This definition of macular edema<br />
specifically takes into consideration the involvement<br />
of the center of the macula <strong>and</strong> its relationship<br />
to visual loss.<br />
Fluorescein Angiography<br />
FA documents if there is fluorescein leakage,<br />
which in turn determines whether a barrier is<br />
classified as open or intact. Clinical use of FA has<br />
contributed significantly to the present underst<strong>and</strong>ing<br />
of retinal disease, <strong>and</strong> it is considered<br />
the ‘gold st<strong>and</strong>ard’.<br />
The dye used in FA is sodium fluorescein, a<br />
small molecule that diffuses freely through the<br />
choriocapillaris <strong>and</strong> Bruch’s membrane but does<br />
not diffuse through the tight junctions of the retinal<br />
endothelial cells <strong>and</strong> the RPE, which are the<br />
inner <strong>and</strong> outer BRBs. Underst<strong>and</strong>ing these barriers<br />
is the key to underst<strong>and</strong>ing <strong>and</strong> interpreting a<br />
fluorescein angiogram (Cunha-Vaz et al., 1984) 1 .<br />
FA also fundamentally contributes to our underst<strong>and</strong>ing<br />
of vascular retinopathy. FA will help for<br />
the identification of areas of capillary leakage <strong>and</strong>/<br />
or capillary closure or capillary dropout. Capillary<br />
closure <strong>and</strong> fluorescein leakage were first clinically<br />
identified with FA, <strong>and</strong> they are accepted as the<br />
<strong>Macular</strong> <strong>Edema</strong>: <strong>Definition</strong> <strong>and</strong> <strong>Basic</strong> <strong>Concepts</strong> 3
a<br />
d<br />
determinant alterations occurring in the diabetic<br />
retina, retinal vein occlusion, <strong>and</strong> other retinal vasculopathies<br />
identifying the progression of retinopathy<br />
(Kohner et al., 1970; Coscas et al., 1978) 3,4 .<br />
Intravenous injection of sodium fluorescein is<br />
generally safe <strong>and</strong> easy to perform. It is routinely<br />
used in ophthalmological clinics despite severe<br />
anaphylactic reactions that may occur on rare occasions<br />
(1 in 200,000) (Yannuzzi et al., 1986) 5 .<br />
FA is an indispensable imaging tool in determining<br />
the definitive diagnosis of macular edema<br />
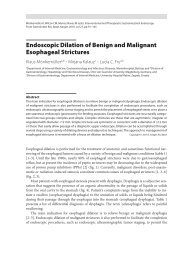
(Gass, 1997) 6 . The angiographic definition distinguishes<br />
between noncystoid <strong>and</strong> cystoid macular<br />
edema (CME) (Richard et al., 1998) 7 .<br />
The noncystoid form of macular edema is<br />
characterized by diffuse abnormal permeability<br />
of the retinal capillary bed with diffuse leakage<br />
<strong>and</strong> intraretinal fluid accumulation that has not<br />
b c<br />
Fig. 2. CME. a Color photo. b, c FA (early <strong>and</strong> late stage); capillary dilation <strong>and</strong> leakage; fluorescein<br />
dye pools in cystoid spaces located in the outer plexiform layer (Henle’s layer) <strong>and</strong> arranged<br />
radially from the fovea. d Spectral domain OCT (Spectralis): typical image of cystoid spaces. OCT<br />
imaging allows precise analysis of large cystoid spaces, <strong>and</strong> their location, the extent of an area of<br />
increased thickness, <strong>and</strong> the extent of the involvement of the central macula are essential in determining<br />
the presence of macular edema. Moreover, the analysis of the outer retinal layers could<br />
give valuable prognostic indications.<br />
accumulated in cystoid spaces but may still do so<br />
in the later course of the disease. It is displayed<br />
as a diffusely outlined <strong>and</strong> ill-delimited area of<br />
hyperfluorescence.<br />
In CME, early capillary dilation <strong>and</strong> leakage<br />
can be detected. In the late phase of the angiogram,<br />
fluorescein pools in cystoid spaces located in the<br />
outer plexiform layer (Henle’s layer) displayed as<br />
the classic petaloid staining pattern (Guyer et al.,<br />
1999) 8 . These cystoid spaces are usually arranged<br />
radially from the fovea (fig. 2). In long-st<strong>and</strong>ing<br />
CME, the cystoid spaces enlarge <strong>and</strong> may merge,<br />
representing irreversible damage of the retina.<br />
The extent of dye leakage alone does not completely<br />
correlate with functional damage <strong>and</strong> visual<br />
acuity. Duration of the edema <strong>and</strong> associated<br />
changes (RPE <strong>and</strong> the degree of ischemia) must<br />
also be taken into account.<br />
4 Coscas � Cunha-Vaz � Soubrane
Presence or predominance of the ischemic<br />
component needs to be analyzed with the help of<br />
FA <strong>and</strong> must be considered when signs of capillary<br />
dropout predominate in the central macular area.<br />
Fundus imaging using indocyanine green dye,<br />
particularly with the scanning laser, may provide<br />
additional direct signs for macular edema but also<br />
for the precise analysis of RPE alterations <strong>and</strong> for<br />
the detection <strong>and</strong> delimitation of cystoid spaces<br />
progressively filled with the dye. Analogous to the<br />
Rosetta Stone, the key to interpretation is correlation<br />
of the data acquired from the different imaging<br />
systems.<br />
Optical Coherence Tomography<br />
OCT provides images of retinal structures that<br />
could not previously be obtained by any other<br />
noninvasive, noncontact, transpupillary diagnostic<br />
method. OCT allows assessment <strong>and</strong> detection<br />
of subretinal <strong>and</strong> intraretinal fluid related to<br />
changes in the inner <strong>and</strong> outer BRBs <strong>and</strong> abnormal<br />
exudation from the retinal capillary bed.<br />
OCT provides anteroposterior images by measuring<br />
the echo time <strong>and</strong> intensity of reflected or<br />
backscattered light from intraretinal microstructures.<br />
These anteroposterior 2-dimensional or<br />
B-scan images (analogous to those of ultrasound)<br />
were demonstrated for the first time in 1991 by<br />
Huang (Huang et al., 1991) 9 <strong>and</strong> in the human<br />
retina in 1993 by Fercher (Fercher et al., 1993) 10<br />
<strong>and</strong> Swanson (Swanson et al., 1993) 11 . These optical<br />
scans are based on the principle of low-coherence<br />
light interferometry (Puliafito et al., 1995;<br />
Schuman et al., 2004) 12,13 .<br />
Schematically, in conventional (time domain)<br />
OCT, the light beam emitted by a superluminescent<br />
diode is split into two beams by a beam splitter:<br />
an incident beam enters the ocular media <strong>and</strong><br />
is reflected by the various layers of the fundus,<br />
while the other beam is reflected by a reference<br />
mirror. Displacement of the mirror placed on the<br />
path of the reference light beam allows analysis of<br />
structures situated at various depths during each<br />
light echo acquisition, forming an A-scan. The<br />
time necessary for this scanning <strong>and</strong> for the acquisition<br />
of these sections is the essential determinant<br />
of the quality of the signal, hence the name<br />
time domain OCT (TD-OCT).<br />
Spectral-Domain OCT (SD-OCT), a method<br />
based on the famous Fourier transform mathematical<br />
equation (1807), eliminates the need for a moving<br />
mirror in the path of the reference beam, which<br />
allows for much more rapid image acquisition <strong>and</strong><br />
provides excellent resolution (axial resolution of<br />
Fig. 3. Multimodal images from 3 patients (rows 1, 2, <strong>and</strong> 3) from visits 0, 12, 24, <strong>and</strong> 36 months<br />
showing the foveal avascular zone contour, retinal leakage analyzer results, <strong>and</strong> retinal thickness<br />
analyzer results. The retinal leakage analyzer color-coded maps of the BRB permeability indexes<br />
are shown. Retinal thickness analyzer views show white dot density maps of the percentage increases<br />
in retinal thickness. Patterns a, b, <strong>and</strong> c are shown on rows 1, 2, <strong>and</strong> 3, respectively.<br />
diagnose <strong>and</strong> follow macular edema. Assessment<br />
<strong>and</strong> mapping of retinal thickness with the time<br />
domain OCT-3 Stratus has been the st<strong>and</strong>ard for<br />
many years <strong>and</strong> has been used in clinical studies.<br />
After introduction of new spectral domain<br />
OCT (SD-OCT) instruments, studies have been<br />
published comparing retinal thickness measurements.<br />
These studies have demonstrated that retinal<br />
thickness measurements are dependent on the<br />
segmentation of the inner <strong>and</strong> outer retinal borders.<br />
The new spectral domain OCT systems image<br />
the outer retinal layers as 3 hyper-reflective<br />
b<strong>and</strong>s: the external limiting membrane, the junction<br />
(or interface) of the photoreceptor outer <strong>and</strong><br />
inner segments, <strong>and</strong> the RPE.<br />
The outer layers of the retina can now be analyzed<br />
due to these recent technological progresses<br />
allowing high-definition, high-speed volume<br />
imaging. This allows analysis of structural changes<br />
particularly affecting photoreceptors <strong>and</strong> the<br />
IS/OS interface, thereby providing functional information<br />
on these tissues. The possibility of integrated<br />
structural imaging <strong>and</strong> functional imaging<br />
will play an increasingly important role in clinical<br />
applications (Coscas, 2009) 14 .<br />
Real-time images of the microscopic retinal<br />
tissues have been termed ‘optical biopsy’ <strong>and</strong><br />
closely reflect histological sections of the macula<br />
<strong>and</strong> fovea.<br />
Increasingly, they resemble a real anatomical<br />
representation, especially with the development of<br />
ultrahigh-resolution techniques <strong>and</strong> the upcoming<br />
combination with adaptive optics (Soubrane,<br />
2009) 15 .<br />
In macular edema, the process begins with diffuse<br />
swelling of the outer retinal layers, advancing<br />
6 Coscas � Cunha-Vaz � Soubrane<br />
100<br />
90<br />
80<br />
70<br />
60<br />
50<br />
40<br />
30<br />
20<br />
10
Fig. 4. Multimodal image composed<br />
of a color photograph of the<br />
eye fundus (morphology reference),<br />
a color-coded leakage map (BRB<br />
functional information), <strong>and</strong> a map<br />
of retinal thickness with average<br />
values for the earmarked areas. This<br />
image allows simultaneous correlation<br />
of both leakage <strong>and</strong> thickness<br />
in the eye fundus.<br />
Fig. 5. The same information presented<br />
in figure 2 is now shown<br />
3-dimensionally. The differences in<br />
the information presented is significant.<br />
Although the shape of the<br />
thickness is now clear, it occurs at<br />
the expense of having fewer details<br />
on the leakage itself <strong>and</strong> the location<br />
of both the thickness <strong>and</strong> leakage<br />
within the macular area.<br />
to the typical image of cystoid spaces. Later, the<br />
large cystoid spaces can extend from the RPE to<br />
the internal limiting membrane <strong>and</strong> even rupture,<br />
causing macular holes. Hence, OCT is becoming<br />
a very efficient tool for following the distribution,<br />
evolution, <strong>and</strong> location of macular edema.<br />
The extent of an area of increased thickness<br />
<strong>and</strong> the involvement of the central macula are essential<br />
to describe a clinical case of macular edema<br />
<strong>and</strong> predict visual loss. The presence of cysts<br />
<strong>and</strong> vitreous traction are particularly well documented<br />
using OCT. The analysis of the outer<br />
<strong>Macular</strong> <strong>Edema</strong>: <strong>Definition</strong> <strong>and</strong> <strong>Basic</strong> <strong>Concepts</strong> 7
etinal layers may provide valuable prognostic indications<br />
(fig. 2).<br />
To establish a correlation between different images,<br />
either from the same or from different modalities,<br />
it is essential to associate <strong>and</strong> to correlate<br />
them all. Multimodal macula mapping, for example,<br />
uses a variety of diagnostic tools <strong>and</strong> techniques<br />
to obtain additional information (fig. 3–6)<br />
0 0.5 1.0 1.5 2.0 2.5 3.0 3.5 4.0 4.5 5.0 5.5<br />
Position (mm)<br />
0<br />
0 1 2 3 4 5<br />
Position (mm)<br />
Fig. 6. This new approach on the representation of a multimodal imaging system integrates the<br />
fundus reference (left column), the color-coded thickness, <strong>and</strong> leakage maps (left column, top <strong>and</strong><br />
bottom rows, respectively). A selected location (marked as a red horizontal line on the left column<br />
images) allows choosing the location where details are to be shown on the right. On the top right<br />
image, the detailed structure of the retina <strong>and</strong> the respective thickness profile is shown. On the<br />
bottom right image, the plotted profile of the leakage information for the same location is shown,<br />
allowing correlation of the structure, thickness, <strong>and</strong> leakage at the local level.<br />
(Lobo et al., 2004; Bernardes et al., 2002; Cunha-<br />
Vaz, 2006) 16–18 .<br />
Spectral domain OCT facilitates correlations<br />
with clinical data, angiographies, <strong>and</strong> functional<br />
investigations.<br />
These imaging techniques are essential to<br />
guide the indications for current treatment <strong>and</strong><br />
to assess the response to treatment.<br />
8 Coscas � Cunha-Vaz � Soubrane<br />
Thickness (µm)<br />
Leakage<br />
450<br />
400<br />
350<br />
300<br />
250<br />
50<br />
45<br />
40<br />
35<br />
30<br />
25<br />
20<br />
15<br />
10<br />
5
References<br />
1 Cunha-Vaz JG, Travassos A: Breakdown<br />
of the blood-retinal barriers <strong>and</strong> cystoid<br />
macular edema. Surv Ophthalmol 1984;<br />
28:485–492.<br />
2 Gonzalez ME, Gonzalez C, Stern MP,<br />
Arredondo B, Martinez S, Mexico City<br />
Diabetes Study Retinopathy Group: Concordance<br />
in diagnosis of diabetic retinopathy<br />
by fundus photography between<br />
retina specialists <strong>and</strong> a st<strong>and</strong>ardized<br />
reading center. Arch Med Res 1995;26:<br />
127–131.<br />
3 Kohner EM, Henkind P: Correlation of<br />
fluorescein angiogram <strong>and</strong> retinal digest<br />
in diabetic retinopathy. Am J Ophthalmol<br />
1970;69:403–414.<br />
4 Coscas G, Dhermy P: Occlusions<br />
veineuses rétiniennes. Rapport Société<br />
Française d’Ophtalmologie. Paris, Masson,<br />
1978.<br />
5 Yannuzzi LA, Rohrer KJ, Tinder LJ, et al:<br />
Fluorescein angiography complications<br />
survey. Ophthalmology 1986;93,611–617.<br />
Prof. Gabriel Coscas<br />
Hôpital Intercommunal de Créteil, Service Universitaire d’Ophtalmologie<br />
40, avenue de Verdun<br />
FR–94010 Créteil (France)<br />
E-Mail gabriel.coscas@gmail.com<br />
6 Gass JD: Stereoscopic Atlas of <strong>Macular</strong><br />
Disease – Diagnosis <strong>and</strong> Treatment, ed<br />
4. St Louis, Mosby, 1997.<br />
7 Richard G, Soubrane G, Yanuzzi L: Fluorescein<br />
<strong>and</strong> ICG Angiography: Textbook<br />
<strong>and</strong> Atlas, ed 2. New York, Thieme, 1998.<br />
8 Guyer D, Yannuzzi LA, Chang S, Shields<br />
JA, Green WR: Retina-Vitreous-Macula,<br />
ed 1. Philadelphia, Saunders, 1999.<br />
9 Huang D, Swanson E, Lin C, et al: Optical<br />
coherence tomography. Science 1991;<br />
254:1178–1181.<br />
10 Fercher AF, Hitzenberger CK, Drexler W,<br />
et al: In vivo optical coherence tomography.<br />
Am J Ophthalmol 1993;116:113–114.<br />
11 Swanson EA, Izatt JA, Hee MR, et al: In<br />
vivo retinal imaging by optical coherence<br />
tomography. Opt Lett 1993;18:<br />
1864–1866.<br />
12 Puliafito CA, Hee MR, Lin CP, et al:<br />
Imaging of macular diseases with optical<br />
coherence tomography. Ophthalmology<br />
1995;102:217–229.<br />
13 Schuman JS, Puliafito CA, Fujimoto JG:<br />
Optical Coherence Tomography of Ocular<br />
Diseases, ed 2. Thorofare, Slack<br />
Incorporated, 2004.<br />
14 Coscas G: Optical Coherence Tomography<br />
in Age-Related <strong>Macular</strong> Degeneration,<br />
ed 2. Berlin, Springer, 2009.<br />
15 Soubrane G: (Personal communication,<br />
unpublished data).<br />
16 Lobo CL, Bernardes RC, Figueira JP, de<br />
Abreu JR, Cunha-Vaz JG: Three-year follow-up<br />
study of blood-retinal barrier <strong>and</strong><br />
retinal thickness alterations in patients<br />
with type 2 diabetes mellitus <strong>and</strong> mild<br />
nonproliferative diabetic retinopathy.<br />
Arch Ophthalmol 2004;122:211–217.<br />
17 Bernardes R, Lobo C, Cunha-Vaz JG:<br />
Multimodal macula mapping: a new<br />
approach to study diseases of the macula.<br />
Surv Ophthalmol 2002;47:580–589.<br />
18 Cunha-Vaz JG: Clinical characterization<br />
of diabetic macular edema. Int Ophthalmol<br />
2006;1:99–100.<br />
<strong>Macular</strong> <strong>Edema</strong>: <strong>Definition</strong> <strong>and</strong> <strong>Basic</strong> <strong>Concepts</strong> 9