NCEP Cyclone track evaluation - RAL
NCEP Cyclone track evaluation - RAL
NCEP Cyclone track evaluation - RAL

You also want an ePaper? Increase the reach of your titles
YUMPU automatically turns print PDFs into web optimized ePapers that Google loves.
Verification at <strong>NCEP</strong>/EMC<br />
Geoff DiMego, Guang-Ping Lou, Binbin<br />
Zhou, Perry Shafran, Marina Tsidulko<br />
geoff.dimego@noaa.gov<br />
(301) 763-8000 ext 7221
Operational Extra-Tropical <strong>Cyclone</strong><br />
Tracks Verification System<br />
Tracking, sorting and matching model analysis and its<br />
corresponding forecast cyclone <strong>track</strong>s for verification<br />
Guang Ping Lou NOAA/NWS/<strong>NCEP</strong>/EMC/MMB<br />
Tim Marchok NOAA/OAR/GFDL
Routine Model Storm Tracks<br />
Operationally, the Marchok “genesis” <strong>track</strong>er is invoked<br />
on the following forecast models: GFS, NAM, CMC,<br />
UKMO, ECMWF, NOGAPS, and ensemble forecasts<br />
GEFS, SREF, CMC and ECMWF.<br />
All cyclones of sufficient strength and longenvity are<br />
<strong>track</strong>ed.<br />
<strong>Cyclone</strong> <strong>track</strong>s are plotted and graphics are pushed to a<br />
web server.<br />
Tracks are archived in ATCF format.<br />
http://www.emc.ncep.noaa.gov/mmb/gplou/mchurr/nwprod/
•<br />
The verification challenge<br />
A “truth” is needed. In the tropical case, HPC puts<br />
out storm vitals file containing the best observed<br />
<strong>track</strong>s as the “truth”. However, there is no vitals file<br />
for extra-tropical storms and it is too labor intensive<br />
to do operationally at HPC, OPC + TPC.<br />
Solution:<br />
• Utilize existing 00 hr (i.e. analysis) forecast model<br />
position) as “truth”, stringing them together to form<br />
the “observed” storm <strong>track</strong>s.<br />
Schematic Diagram:
00hr<br />
00hr<br />
Forecast<br />
00hr 24hrs 48hr 72hrs<br />
96hrs 120hrs<br />
00Z 12Z 00Z 12Z 00Z 12Z 00Z 12Z 00Z 12Z 00Z<br />
120hrs<br />
96hr<br />
72hrs<br />
Verification<br />
Extra-<strong>Cyclone</strong> Tracks Verification:<br />
1.Extra-Tropical cyclone verification will use analysis as the truth since observed cyclone <strong>track</strong>s are not available.<br />
2Therefore the tcvitals are already contained in the output of the forecast <strong>track</strong>er after it completes the <strong>track</strong>er processing. The first three records in the output<br />
file are the analysis position and intensity of the cyclone.<br />
3Position, center pressure, and/or direction, and wind strength for each quadrant are possible variables for verification every 12(24) hours. Mean errors of<br />
these variables can be calculated in the interval of 12(24) hours on a monthly bases and/or continuously (moving average).<br />
00hr<br />
48hrs<br />
00hr<br />
24hr<br />
00hr
1.<br />
2.<br />
3.<br />
4.<br />
Sorting<br />
Model analysis ATCF data are picked out from the forecast<br />
<strong>track</strong>s.<br />
Search nearby cyclone center in the next synoptic time. The<br />
criteria for recognizing as the same cyclone are: 3.5 by 4.5 lat<br />
and lon in middle to low latitudes; 4.5 by 5.5 lat and lon in<br />
high latitudes. Set aside preliminary storm <strong>track</strong>s.<br />
Search for cyclones that are weakened and then re-appeared<br />
within 12 hours in the vicinity areas.<br />
Perform another iteration that strings fragmented analysis<br />
storm <strong>track</strong>s to form a unique <strong>track</strong> that will span the storm’s<br />
life cycle from cyclogenesis to dissipation.
1)<br />
2)<br />
3)<br />
Matching<br />
Separate each forecast <strong>track</strong> into an independent<br />
file.<br />
Search for analysis cyclone <strong>track</strong> that matches the<br />
forecast <strong>track</strong>.<br />
Combine the forecast and analysis <strong>track</strong>s into one<br />
file. Operationally, previous 10 day’s cyclones are<br />
lined up for verification.
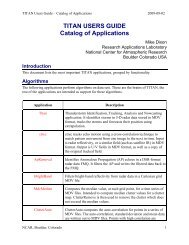
From 12Z March 26 to 12Z April 5,<br />
there are a total of 24 traceable<br />
extra-tropical cyclones that<br />
are automatically searched out<br />
within the operational <strong>track</strong>ing<br />
domains. Of these 24 cyclones, 86<br />
forecasts were made.<br />
Top panel: GFS forecast <strong>track</strong>s<br />
Bottom panel: analysis <strong>track</strong>s in<br />
Alaska and vicinity<br />
3. Examples
GFS forecast (left) and analysis (right) <strong>track</strong>s in 10 day span<br />
in North Atlantic region (12Z March 26 – 12Z April 5, 2008)
Verification<br />
Following Marchok’s conventional tropical storm<br />
verification procedure, cyclone <strong>track</strong>s are arranged<br />
in two “decks”:<br />
a)<br />
b)<br />
Adeck, contains past 10 day’s forecast <strong>track</strong>s.<br />
Bdeck, holds analysis <strong>track</strong>s that match the forecast’s.<br />
Verification is done for both <strong>track</strong> distance errors and<br />
intensity errors amongst other stats.<br />
A VSDB record is produced.<br />
In the examples shown previous slides, <strong>track</strong> errors are<br />
calculated as displayed next.
Average forecast distance errors for <strong>track</strong>s in 10 day span
Verification output table<br />
Average <strong>track</strong> errors (NM) for homogeneous sample<br />
fcst<br />
hrs<br />
00 12 24 36 48 72 96 120<br />
GFS 0.0 24.2 54.5 70.6 96.8 0.0 0.0<br />
#Cases 89 60 36 22 10 0 0 0<br />
Error standard deviation<br />
fcst<br />
hrs 00 12 24 36 48 72 96 120<br />
GFS 0.0 24.7 59.6 53.2 76.6 0.0 0.0<br />
Average Xbias (NM)<br />
fcst<br />
hrs 00 12 24 36 48 72 96 120<br />
GFS 0.0 -1.0 -10.7 -6.8 28.4 0.0 0.0<br />
Average Ybias (NM)<br />
fcst<br />
hrs 00 12 24 36 48 72 96 120<br />
GFS 0.0 -4.8 -10.3 -26.7 -64.8 0.0 0.0<br />
0.0<br />
0.0<br />
0.0<br />
0.0
•<br />
•<br />
•<br />
•<br />
Discussion<br />
In the first stage, the operational <strong>track</strong> verification will be performed<br />
on those <strong>track</strong>s that are initiated on the analysis cyclones for past 10<br />
days every 12 hours. Will move to every 6 hours next for those<br />
models producing more frequent output.<br />
Forecast and analysis <strong>track</strong>s are not well matched even in the same<br />
model.<br />
Tracks from forecast models will only be verified against their own<br />
analysis <strong>track</strong>s for now.<br />
A "unified" sfc analysis produced every 6 hours amongst OPC, HPC<br />
and TPC should soon be put into gridded form, providing realistic<br />
“observed” cyclone <strong>track</strong>s (after applying the <strong>track</strong>er). This may be the<br />
“best” hope for middle latitude cyclones, but not a global analysis.
PBL Height Verification vs<br />
RAOB
Current Time Series at San Diego, CA
Current Time Series at Little Rock, AR
Current Time Series at Salt Lake City, UT
North America<br />
North Hemisphere<br />
South Hemisphere<br />
Tropical<br />
Europe<br />
Asia<br />
Temperature<br />
Height<br />
Wind U<br />
Wind V<br />
Reliability<br />
Spread&RMSE<br />
BSS<br />
BS-fcst<br />
BS-clim<br />
Total Reliability<br />
Resolution<br />
Uncertainty<br />
Inf<br />
Low10% BS<br />
High10%BS<br />
Economic value<br />
Histogram<br />
Relative pos<br />
ROC<br />
RPSS<br />
RPSS-fcst<br />
RPSS-clim<br />
PAC<br />
Absolute Error<br />
MYSQL-based Ensemble FVS<br />
● Web GUI adapted from GSD RTVS<br />
●<br />
MYSQL tables were specially<br />
�Designed for ensemble verification<br />
� Normalized<br />
● Only GENS verification data at this time<br />
● EMC/<strong>NCEP</strong>’s GENS verification data<br />
� Converted into VSDB-like format<br />
� Routinely stored into MYSQL DB<br />
● User send request web online<br />
● Web sends request to MYSQL server<br />
●<br />
MYSQL server selects required data<br />
● MYSQL server computes stats<br />
● MYSQL server creates plots<br />
● MYSQL server sends back the result<br />
to the user
Y2007 Brier Skill Score of T2m ( Climatology data as ref ) over NA, SH, TR and AS for all fcst hours<br />
NA has skill before 144hr (6 days); SH has skill before 216hr (9 days)<br />
TR and AS have skills for all fcst hours (16 days)
Y2007 Reliability of 500mb Height over NA for different fcst times: 2, 4, 6, and 8 days<br />
�Decrease with forecast range<br />
�Positive bias
NA: Y2007 500mb height’s Spread and RMSE on different days/months (left) and fcst times (right)<br />
�Spread generally follow RMSE for all times � Good performance indicator for an ensemble system<br />
�After 6days (144hr), Spread and RMSE increase with fcst time in parallel � Also a good indicator
NA: Y2007 2mT economic value (upper-left: for C/L > 1/18, has value), ROC (upper-right: has skill),<br />
Ranked Prob Skill Score (lower-left: has skill for all fcst times) and Talagrand distribution (lowerright:<br />
outlier rate 12 % + 16 % )
■ Future Work:<br />
o Unify SREF’s<br />
verification system (gridtobsE<br />
� Generate same data format as GENS’s<br />
and grid-to-grid)<br />
o Add unified SREF verification data to MYSQL-based Ensemble FVS<br />
o Add NAEFS (North America Ensemble Forecast System) data to MYSQL<br />
o Add other ensemble forecasts (e.g. bias correction)