The slides for the analyst presentation - Lafarge
The slides for the analyst presentation - Lafarge
The slides for the analyst presentation - Lafarge

You also want an ePaper? Increase the reach of your titles
YUMPU automatically turns print PDFs into web optimized ePapers that Google loves.
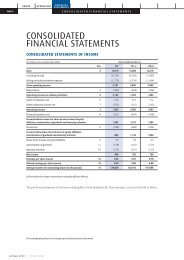
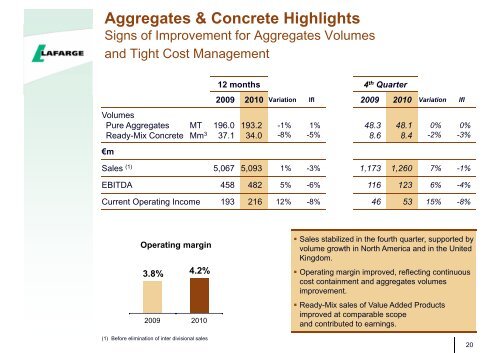
Aggregates & Concrete Highlights<br />
Signs of Improvement <strong>for</strong> Aggregates Volumes<br />
and Tight Cost Management<br />
Volumes<br />
Pure Aggregates MT<br />
Ready-Mix Concrete Mm 3<br />
€m<br />
(1) Be<strong>for</strong>e elimination of inter divisional sales<br />
12 months 4 th Quarter<br />
2009 2010 Variation lfl 2009 2010 Variation lfl<br />
196.0<br />
37.1<br />
193.2<br />
34.0<br />
-1%<br />
-8%<br />
Sales (1) 5,067 5,093 1% -3% 1,173 1,260 7% -1%<br />
EBITDA 458 482 5% -6% 116 123 6% -4%<br />
Current Operating Income 193 216 12% -8% 46 53 15% -8%<br />
Operating margin<br />
3.8%<br />
4.2%<br />
2009 2010<br />
1%<br />
-5%<br />
48.3<br />
8.6<br />
48.1<br />
8.4<br />
0%<br />
-2%<br />
0%<br />
-3%<br />
� Sales stabilized in <strong>the</strong> fourth quarter, supported by<br />
volume growth in North America and in <strong>the</strong> United<br />
Kingdom.<br />
� Operating margin improved, reflecting continuous<br />
cost containment and aggregates volumes<br />
improvement.<br />
� Ready-Mix sales of Value Added Products<br />
improved at comparable scope<br />
and contributed to earnings.<br />
20