2000 consolidated accounts - Lafarge
2000 consolidated accounts - Lafarge
2000 consolidated accounts - Lafarge

You also want an ePaper? Increase the reach of your titles
YUMPU automatically turns print PDFs into web optimized ePapers that Google loves.
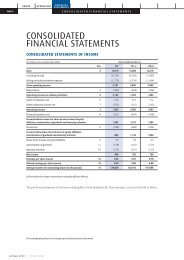
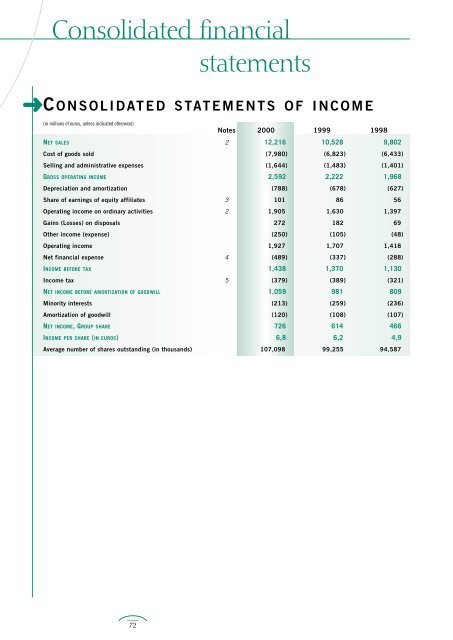
Consolidated financial<br />
statements<br />
➜ C ONSOLIDATED STATEMENTS OF INCOME<br />
(in millions of euros, unless indicated otherwise)<br />
72<br />
Notes <strong>2000</strong> 1999 1998<br />
NET SALES 2 12,216 10,528 9,802<br />
Cost of goods sold (7,980) (6,823) (6,433)<br />
Selling and administrative expenses (1,644) (1,483) (1,401)<br />
GROSS OPERATING INCOME 2,592 2,222 1,968<br />
Depreciation and amortization (788) (678) (627)<br />
Share of earnings of equity affiliates 3 101 86 56<br />
Operating income on ordinary activities 2 1,905 1,630 1,397<br />
Gains (Losses) on disposals 272 182 69<br />
Other income (expense) (250) (105) (48)<br />
Operating income 1,927 1,707 1,418<br />
Net financial expense 4 (489) (337) (288)<br />
INCOME BEFORE TAX 1,438 1,370 1,130<br />
Income tax 5 (379) (389) (321)<br />
NET INCOME BEFORE AMORTIZATION OF GOODWILL 1,059 981 809<br />
Minority interests (213) (259) (236)<br />
Amortization of goodwill (120) (108) (107)<br />
NET INCOME, GROUP SHARE 726 614 466<br />
INCOME PER SHARE (IN EUROS) 6,8 6,2 4,9<br />
Average number of shares outstanding (in thousands) 107,098 99,255 94,587
➜<br />
C ONSOLIDATED BALANCE SHEETS<br />
(Before appropriation, in millions of euros, unless indicated otherwise)<br />
73<br />
Notes <strong>2000</strong> 1999 (a) 1998 (a)<br />
Goodwill 7 2,820 3,157 2,669<br />
Intangible assets 7 1,127 1,079 791<br />
Property, plant and equipment 9 8,882 7,904 6,619<br />
FIXED ASSETS, NET 12,829 12,140 10,079<br />
Investments in equity affiliates 10 420 333 316<br />
Other investments 10 1,716 413 901<br />
Long-term loans and receivables 489 384 374<br />
OTHER LONG-TERM ASSETS 2,625 1,130 1,591<br />
Inventories and work-in-progress 11 1,309 1,237 1,062<br />
Accounts and notes receivable, trade 12 1,495 1,908 1,565<br />
Other receivables 899 760 691<br />
Accounts and notes payable, trade (1,114) (1,041) (912)<br />
Other payables (1,457) (1,655) (1,333)<br />
WORKING CAPITAL REQUIREMENTS 1,132 1,209 1,073<br />
CASH AND CASH EQUIVALENTS 13 1,740 1,061 970<br />
TOTAL 18,326 15,540 13,713<br />
Common stock 14 429 400 392<br />
Additional paid-in capital 15 3,028 2,459 2,313<br />
Retained earnings 16 2,910 3,180 2,428<br />
Cumulative translation adjustment (324) (188) (444)<br />
SHAREHOLDERS' EQUITY, GROUP SHARE 6,043 5,851 4,689<br />
Minority interests 1,707 1,598 1,489<br />
Other equity 17 162 439 135<br />
TOTAL EQUITY 7,912 7,888 6,313<br />
PROVISIONS 18 2,038 1,181 1,109<br />
Long- and medium-term debt 7,490 5,520 5,821<br />
Current portion of long- and medium-term debt 579 655 268<br />
Short-term bank borrowings 307 296 202<br />
DEBT 19 8,376 6,471 6,291<br />
TOTAL 18,326 15,540 13,713<br />
(a) After reclassification of cash and cash equivalents.
Consolidated financial statements<br />
➜<br />
C ONSOLIDATED STATEMENTS<br />
OF CASH FLOWS<br />
(in millions of euros, unless indicated otherwise)<br />
74<br />
Notes <strong>2000</strong> 1999 1998<br />
NET INCOME BEFORE AMORTIZATION OF GOODWILL 1,059 981 809<br />
Depreciation and amortization 788 678 627<br />
Equity affiliates (35) (37) (27)<br />
Gains (Losses) on disposals (272) (174) (69)<br />
Deferred tax (and tax provisions) 31 24 16<br />
Others 5 23 (74)<br />
Reversal of other income (expense) 217 103 133<br />
CASH FLOW FROM ORDINARY ACTIVITIES 1,793 1,598 1,415<br />
Other income (expense) brought forward (217) (103) (133)<br />
CASH FLOW FROM OPERATING ACTIVITIES 1,576 1,495 1,282<br />
Net change in working capital requirements (92) (217) (25)<br />
NET CASH FROM OPERATING ACTIVITIES 1,484 1,278 1,257<br />
Capital expenditures (1,307) (1,141) (1,058)<br />
Investment in <strong>consolidated</strong> companies (1) 8 (584) (859) (750)<br />
Investment in non-<strong>consolidated</strong> companies (1,484) (147) (644)<br />
TOTAL INVESTMENTS (3,375) (2,147) (2,452)<br />
Disposals (2) 991 569 391<br />
Net (increase) decrease in loans and other long-term receivables (33) (24) (8)<br />
NET CASH USED IN INVESTING ACTIVITIES (2,417) (1,602) (2,069)<br />
Proceeds from issuance of common stock 322 213 604<br />
Movements in treasury stock (38) 381 (33)<br />
Increase (Decrease) in other equity 7 292 6<br />
Dividends paid (275) (280) (192)<br />
INCREASE (DECREASE) IN EQUITY 16 606 385<br />
Increase (Decrease) in long- and medium-term debt 1,656 11 575<br />
Increase (Decrease) in short-term debt (70) (286) 26<br />
NET CASH FROM FINANCING ACTIVITIES 1,602 331 986<br />
INCREASE (DECREASE) IN CASH AND CASH EQUIVALENTS 669 7 174<br />
Effect of exchange rate changes 10 84 (69)<br />
Cash and cash equivalents at beginning of year 1,061 970 865<br />
CASH AND CASH EQUIVALENTS AT END OF YEAR 1,740 1,061 970<br />
(1) Net of cash balances of companies acquired 34 13 -<br />
(2) Net of cash balances of companies disposed of 179 23 39
➜<br />
C ONSOLIDATED STATEMENTS<br />
OF SHAREHOLDERS' EQUITY<br />
AND MINORITY INTERESTS<br />
(in millions of euros)<br />
75<br />
Common Additional Retained Cumulative Total Minority<br />
stock paid-in earnings translation Group interests<br />
capital adjustment share<br />
BALANCE AS OF DECEMBER 31, 1997 361 1,849 2,130 (187) 4,153 1,338<br />
Net income - - 467 (1) 466 236<br />
Dividends paid<br />
Issuance of common stock, dividends reinvested<br />
- - (141) - (141) (51)<br />
and options exercised 31 464 - - 495 -<br />
Decrease (Increase) in treasury stock - - (28) - (28) -<br />
Minority interests movements - - - - - 70<br />
Cumulative translation adjustment - - - (256) (256) (104)<br />
BALANCE AS OF DECEMBER 31, 1998 392 2,313 2,428 (444) 4,689 1,489<br />
Net income - - 613 1 614 259<br />
Dividends paid<br />
Issuance of common stock, dividends reinvested<br />
- - (183) - (183) (97)<br />
and options exercised 8 146 - - 154 -<br />
Decrease (Increase) in treasury stock - - 322 - 322 -<br />
Minority interests movements - - - - - (235)<br />
Translation adjustment - - - 255 255 182<br />
BALANCE AS OF DECEMBER 31, 1999 400 2,459 3,180 (188) 5,851 1,598<br />
Net income - - 731 (5) 726 213<br />
Dividends paid<br />
Issuance of common stock, dividends reinvested<br />
- - (215) - (215) (60)<br />
and options exercised 29 569 - - 598 -<br />
Decrease (Increase) in treasury stock - - (37) - (37) -<br />
Minority interests movements<br />
Impact of the change in accounting<br />
- - - - - (41)<br />
for deferred taxes<br />
Goodwill previously written off<br />
- - (759) - (759) (64)<br />
against retained earnings on subsidiaries sold - - 10 - 10 -<br />
Translation adjustment - - - (131) (131) 61<br />
BALANCE AS OF DECEMBER 31, <strong>2000</strong> 429 3,028 2,910 (324) 6,043 1,707
Consolidated financial statements<br />
➜ N OTES TO THE CONSOLIDATED<br />
FINANCIAL STATEMENTS<br />
1. A CCOUNTING POLICIES<br />
◗ A CCOUNTING PRINCIPLES<br />
The <strong>consolidated</strong> financial statements of <strong>Lafarge</strong> SA<br />
(the parent company) and its subsidiaries (the<br />
Group) are prepared in accordance with the<br />
provisions of French accounting legislation and<br />
standards.<br />
◗ N EW ACCOUNTING STANDARDS<br />
Effective January 1, <strong>2000</strong>, the Group adopted the<br />
new accounting standard CRC No. 99-02 on<br />
Consolidated Financial Statement published by the<br />
French Accounting Standards Committee ("Comité<br />
de la Réglementation Comptable"). The standard<br />
requires that the balance-sheet liability method be<br />
applied for the recognition of deferred income taxes<br />
(the change in method is explained in note 1.L.).<br />
◗ U SE OF ESTIMATES<br />
The preparation of financial statements in<br />
conformity with accounting principles generally<br />
accepted in France requires the use of estimates<br />
and assumptions that affect the reported amounts<br />
of assets and liabilities, such as depreciation and<br />
provisions, the disclosure of contingent assets<br />
and liabilities at the date of the financial<br />
statements and the reported amounts of revenues<br />
and expenses. Actual results may differ from<br />
those estimates and assumptions.<br />
A. Principles of consolidation<br />
◗ C RITERIA FOR CONSOLIDATION<br />
AND CONSOLIDATION METHODS<br />
Companies over which <strong>Lafarge</strong> has exclusive<br />
control are fully <strong>consolidated</strong>.<br />
Companies over which <strong>Lafarge</strong> has significant<br />
76<br />
influence, which is presumed where the<br />
shareholding exceeds 20% of the capital, are<br />
accounted for under the equity method.<br />
Companies over which control is exercised jointly<br />
with another group are <strong>consolidated</strong> on a<br />
proportional basis.<br />
◗ B ASIS OF CONSOLIDATION<br />
The accounting period for the financial statements<br />
of all companies included in the consolidation ends<br />
on December 31. The individual companies'<br />
financial statements are adjusted, where necessary,<br />
to comply with Group accounting policies.<br />
◗ T RANSLATION OF THE FINANCIAL<br />
STATEMENTS OF FOREIGN COMPANIES<br />
The financial statements of foreign companies are<br />
translated using the closing rate of exchange method:<br />
translation of all assets and liabilities in the balance<br />
sheet at the year-end rate of exchange, and all the<br />
income statement items at the average annual rate<br />
of exchange. Translation gains and losses are shown<br />
separately under shareholders' equity. For companies<br />
in countries with high inflation, as an<br />
exception to the above, fixed assets, investments,<br />
inventories and the corresponding income<br />
statements items are not revalued and the original<br />
values are translated at historical rates of exchange.<br />
Translation gains and losses are included on the<br />
relevant line in the income statement.<br />
◗ G OODWILL<br />
The excess of the purchase price over the fair value<br />
of the net assets of businesses acquired is allocated<br />
to "Goodwill". Minority interests are credited with<br />
their share of the fair value of recorded assets and<br />
liabilities in acquired companies.<br />
Specific non-amortizable intangible assets, such as
market shares and trademarks, are recorded as part<br />
of the purchase price allocation to the extent that<br />
they can be valued using a sufficiently accurate and<br />
objective method based on average profitability.<br />
Changes in the value of such intangible assets in<br />
future periods are monitored using the same<br />
criterion and where necessary an impairment of<br />
the value of such assets provided.<br />
The Group amortizes goodwill on a straight-line<br />
basis over periods not exceeding 40 years.<br />
Negative goodwill is amortized to income statement<br />
on a systematic basis, in accordance with a schedule<br />
that takes into account the objectives and the acquired<br />
company's prospects at the time of acquisition.<br />
These accounting policies have been applied to<br />
acquisitions that have taken place since January 1,<br />
1989. Before this date the value of market shares,<br />
trademarks and positive and negative goodwill were<br />
not capitalized but written off against retained<br />
earnings.<br />
◗ E FFECTIVE DATE OF ACQUISITIONS<br />
AND DISPOSALS<br />
Revenues and expenses of companies <strong>consolidated</strong><br />
for the first time during the year are included in<br />
the <strong>consolidated</strong> income statement only for the<br />
period starting after the transfer of control.<br />
Similarly, only revenues and expenses recorded<br />
prior to the transfer of control of the companies<br />
disposed of during the period are included in the<br />
<strong>consolidated</strong> income statement.<br />
B. Revenue recognition<br />
Revenues from the sale of cement, concrete,<br />
aggregates, roofing, gypsum-based products and<br />
specialty materials are recorded when the products<br />
are shipped. Consolidated sales represent the value,<br />
net of tax, of goods and services sold by Group<br />
companies in the normal course of operations, after<br />
inter-company eliminations.<br />
77<br />
C. Other income (expense)<br />
"Other income (expense)" results from operations<br />
and includes in particular net restructuring expenses<br />
and provisions for disputes.<br />
D. Financial instruments<br />
• Cash and cash equivalents: cash and cash equivalents<br />
consist of cash and highly liquid investments<br />
with maturities generally of less than three months<br />
at time of purchase. They are accounted for at their<br />
historical cost net of depreciation.<br />
• Other investments: other investments, which consist<br />
either of shares held in non-<strong>consolidated</strong> companies<br />
or shares in listed companies treated as longterm<br />
equity investments, are valued at acquisition<br />
cost, after provision for impairment, where necessary,<br />
on the basis of the Group’s share of net<br />
worth, future prospects and stock market prices<br />
where meaningful.<br />
• Financial derivative instruments: the Group enters<br />
into financial derivatives for hedging purposes only,<br />
in order to reduce its exposure to adverse movements<br />
in interest rates and foreign exchange rates.<br />
Forward exchange contracts and foreign currency<br />
swaps are used to hedge the foreign exchange<br />
exposure. Hedged transactions are recorded in<br />
the financial statement using the hedging rate.<br />
Exchanges differences arising from foreign currency<br />
transactions are recorded in the income<br />
statement under net financial expense.<br />
The Group also enters into interest rate swaps<br />
to manage its interest rate exposure. The differences<br />
between interest paid and received are recognized<br />
as interest expense or interest income<br />
over the life of the hedged item, on a prorata temporis<br />
basis.
Consolidated financial statements<br />
• Concentration of credit risk: financial instruments,<br />
which potentially expose the Group to concentration<br />
of credit risk are primarily receivables,<br />
cash and cash equivalents and financial derivative<br />
instruments. The Group manages this risk by<br />
rigorously selecting its counterparts, and strictly<br />
monitoring the exposure to avoid any significant<br />
exposure to a single third party. The Group generally<br />
requires no collateral on its receivables.<br />
E. Property,<br />
plant and equipment<br />
Property, plant and equipment is recorded in each<br />
country at the historical cost.<br />
Capital leases are capitalized.<br />
Interest on borrowings directly related to the<br />
financing of construction projects and incurred<br />
during the construction phase is included within<br />
the acquisition cost.<br />
Depreciation in the <strong>consolidated</strong> financial statements<br />
is calculated as follows:<br />
• land on which quarries are located is depreciated<br />
on a depletion basis; this depletion is recorded as<br />
the material extraction advances; other land is not<br />
depreciated;<br />
• buildings are depreciated using the straight-line<br />
method over estimated useful lives varying from<br />
20 years for industrial building to 50 years for<br />
offices or residential properties;<br />
• cement works plant and equipment are<br />
depreciated using the straight-line method over<br />
international industry-recognized useful lives, to<br />
a maximum of 20 years;<br />
• other plant, equipment and installations are<br />
depreciated using the straight-line over estimated<br />
useful lives varying from 8 to 20 years.<br />
F. Intangible assets<br />
Intangible assets include amortizable assets (such<br />
as patents, licenses, leaseholds) which are amortized<br />
using the straight-line method over periods not<br />
exceeding their estimated useful lives, and non-<br />
78<br />
amortizable assets (such as market shares and<br />
acquired trademarks) which meet the criteria<br />
described in the above goodwill note 1.A.<br />
G. Impairment of long lived<br />
assets<br />
Whenever events or changes in circumstances<br />
indicate that the carrying amount of long-lived<br />
assets may not be recoverable, this carrying amount<br />
to which the associated goodwill is added, is<br />
compared with the estimated future cash flows<br />
(undiscounted and without interest charges)<br />
expected to result from the use of the assets and<br />
their possible disposition. If the sum of expected<br />
cash flows is less than the carrying amount of the<br />
assets, an impairment loss is recognized based on<br />
the fair value of the assets, generally estimated as<br />
the present value of expected cash flows.<br />
H. Inventories<br />
All inventories are stated at the lower of cost and<br />
net realizable value. Cost is calculated using the<br />
weighted average method.<br />
I. Pension plans<br />
and retirement indemnities<br />
The Group's projected benefits obligation relating<br />
to defined benefit pension plans and to retirement<br />
indemnity schemes is calculated on the basis of length<br />
of service, life expectancy and turnover, taking into<br />
account actuarial assumptions. This obligation is<br />
covered either by plan assets to which the Group<br />
contributes or by reserves recorded in the balance<br />
sheet over the period the rights are acquired.<br />
<strong>Lafarge</strong> and several French subsidiaries have made<br />
arrangements with an external organization to fund<br />
retirement termination payment and supplementary<br />
pension commitments. Foreign companies, which<br />
operate defined benefit pension plans, pay<br />
contributions to pension funds. A reserve is recorded<br />
only for the portion of commitments which exceeds<br />
the value of the plan assets.
Differences resulting from changes in actuarial<br />
assumptions in excess of 10% of the amount of the<br />
engagements or plan assets are spread over the<br />
residual life of the commitment.<br />
J. Other post-retirement<br />
benefits<br />
The Group's obligation relating to healthcare and<br />
life insurance benefits is recognized over the period<br />
the rights are acquired. The accrued obligation is<br />
based on an actuarial valuation, which takes into<br />
account assumptions regarding mortality and future<br />
healthcare cost trends.<br />
K. Sites restoration<br />
Where the Group is legally or contractually<br />
required to restore a quarry site, a reserve is<br />
recorded over the operating life of the quarry to<br />
cover such costs. This reserve is recorded on a siteby-site<br />
basis at the discounted present value of<br />
future work to be performed, estimated on the basis<br />
of current known costs and the planned work<br />
schedule.<br />
L. Income taxes<br />
As of January 1, <strong>2000</strong>, deferred income taxes are<br />
accounted for using the balance-sheet liability<br />
method on temporary differences between the tax<br />
base of assets and liabilities and their carrying<br />
amount in the balance sheet, (including tax losses<br />
available for carryforward). These deferred taxes<br />
are measured by applying currently enacted tax<br />
laws. Deferred tax assets are recognized when there<br />
is a reasonable expectation that the assets will be<br />
realized. Before January 1, <strong>2000</strong>, the deferred tax<br />
provision was calculated using the partial allocation<br />
method, whereby deferred taxes were provided<br />
only where timing differences were expected to<br />
reverse in the foreseable future. This method only<br />
takes into account timing differences arising<br />
between the adjusted net accounting profit of<br />
<strong>consolidated</strong> subsidiaries and net taxable income.<br />
79<br />
A cumulative adjustment was recognized as a result<br />
of the adoption of the new accounting principle<br />
and the impact of this change is shown in the<br />
<strong>consolidated</strong> statements of changes in shareholders'<br />
equity (see note 18).<br />
M. Research & Development<br />
The company is committed to improving its<br />
manufacturing process, maintaining product quality<br />
and meeting existing and future customer needs.<br />
These objectives are pursued through various<br />
programs. Research and development costs are<br />
charged to expense as incurred.<br />
N. Change in presentation<br />
In <strong>2000</strong> the Group changed the presentation of<br />
investments and disposals of <strong>consolidated</strong><br />
companies in the cash flow statement. They are<br />
now shown "Net of cash acquired or disposed of",<br />
and no longer "net of indebtedness acquired or<br />
disposed of".<br />
Secondly, the caption "Cash and cash equivalents"<br />
was reclassified in the balance sheet from the<br />
liability to the asset side.<br />
In both cases previous years figures have been<br />
restated to make the comparison possible.<br />
2. SEGMENT AND GEOGRAPHIC<br />
INFORMATION<br />
Operating segments are defined as components of<br />
an enterprise that engage in business activities<br />
which earn revenues, incur expenses and prepare<br />
separate financial information that is evaluated<br />
regularly by the company's chief operating decision<br />
makers in order to allocate resources and assess<br />
performance.
Consolidated financial statements<br />
Up until December 31, <strong>2000</strong>, the Group primarily operates and manages five business segments (Cement,<br />
Aggregates & Concrete, Roofing, Gypsum and Specialty Products) which represent separately managed strategic<br />
business units that have different capital requirements and marketing strategies. Cement produces a wide range<br />
of cement and hydraulic binders adapted to the needs of the construction industry. Aggregates & Concrete produces<br />
construction aggregate, ready-mixed concrete, other concrete products (gravity and pressure pipe, precast<br />
structures, pavers and masonry units). Roofing primarily consists of the sale of roof tiles, roofing accessories and<br />
chimney systems. Gypsum produces drywall for the commercial and residential construction sectors. Specialty<br />
Products produces industrial lime, calcium aluminates, admixtures for construction materials, refractories products,<br />
road marking products, façade and specialty mortars and adhesive and floor products, and indoor and outdoor<br />
paints.<br />
The accounting policies applied in the determination of segment earnings are identical to those described in note 1.<br />
◗ B USINESS SEGMENTS<br />
Division <strong>2000</strong> 1999 1998<br />
(in millions of euros) Net sales Operating Capital Net sales Operating Capital Net sales Operating Capital<br />
income employed income employed income employed<br />
on ordinary on ordinary on ordinary<br />
activities activities activities<br />
Cement 4,420 1,167 6,789 3,635 908 6,476 3,288 784 5,065<br />
Aggregates & Concrete 3,725 309 3,235 3,202 249 2,628 3,117 232 2,359<br />
Roofing 1,684 219 2,848 1,621 232 2,808 1,569 221 2,362<br />
Gypsum 1,000 60 1,166 855 127 979 670 81 834<br />
Specialty Products 1,387 150 294 (*) 1,207 122 873 1,123 85 885<br />
Other - - 50 8 (8) (82) 35 (6) (37)<br />
TOTAL 12,216 1,905 14,382 10,528 1,630 13,682 9,802 1,397 11,468<br />
(*) This amount excludes the capital employed of the part of the Specialty Products Division that was sold in December <strong>2000</strong>.<br />
80
◗ A NALYSIS BY GEOGRAPHIC AREA<br />
Geographic area <strong>2000</strong> 1999 1998<br />
(in millions of euros) Net sales Capital Net sales Capital Net sales Capital<br />
employed employed employed<br />
Western Europe 5,717 6,159 5,498 6,638 5,327 6,549<br />
of which France 2,367 1,479 2,260 1,798 2,200 1,956<br />
Germany 962 2,046 1,076 2,000 1,033 1,791<br />
United Kingdom 852 604 739 719 816 755<br />
United States 2,307 2,030 1,993 1,715 1,797 1,366<br />
Canada 985 1,319 768 906 719 678<br />
Eastern and central Europe<br />
Emerging Mediterranean<br />
501 868 359 767 399 720<br />
countries 638 1,211 516 1,070 426 627<br />
Latin America<br />
Sub-Saharan Africa/<br />
761 829 517 791 628 764<br />
Indian ocean 553 406 507 421 355 373<br />
Asia-Pacific 754 1,560 370 1,374 151 391<br />
TOTAL 12,216 14,382 10,528 13,682 9,802 11,468<br />
3. S HARE OF EARNINGS<br />
OF EQUITY AFFILIATES<br />
(in millions of euros) <strong>2000</strong> 1999 1998<br />
Operating income<br />
on ordinary activities 101 86 56<br />
Gains (Losses) on disposals 8<br />
Other income (expense) (7) (5) (3)<br />
Net financial expense (21) (19) (5)<br />
Income tax (23) (19) (13)<br />
Net income after tax (1) 50 51 35<br />
(1) Of which Molins for €23 million in <strong>2000</strong> (€32 million in 1999, €11 million in 1998)<br />
4. A NALYSIS OF NET<br />
FINANCIAL EXPENSE<br />
(in millions of euros) <strong>2000</strong> 1999 1998<br />
Interest and similar expense<br />
Interest income from loans<br />
618 370 368<br />
and investments (129) (33) (80)<br />
TOTAL 489 337 288<br />
Interest expense on long- and medium-term debt<br />
is reported net of capitalized interest costs for construction<br />
projects of €12 million in <strong>2000</strong> (€6 million<br />
in 1999 and €4 million in 1998).<br />
81<br />
5. INCOME TAX<br />
The current income tax is equal to the amount<br />
paid or payable in the short term to the tax<br />
authorities in respect of the financial year, in<br />
accordance with currently applicable tax rules<br />
and rates in the various countries, taking into<br />
account the taxation regime described below.<br />
The Group benefits from tax assessment on<br />
a worldwide-<strong>consolidated</strong> basis. The approval covers<br />
the years 1998, 1999 and <strong>2000</strong>. The tax charge<br />
is calculated on the fiscal <strong>consolidated</strong> net income<br />
of French and foreign subsidiaries in which the<br />
Group holds an interest in excess of 50% with<br />
deduction of any tax already paid by the subsidiaries.<br />
◗ I NCOME TAX CHARGE<br />
The income tax charge breaks down as follows:<br />
(in millions of euros) <strong>2000</strong> 1999 1998<br />
Current 344 382 305<br />
Deferred 35 7 16<br />
TOTAL 379 389 321
Consolidated financial statements<br />
◗ E FFECTIVE TAX RATE<br />
The difference between the effective tax rate and<br />
the tax rate applicable for the worldwide tax consolidation<br />
is as follows:<br />
<strong>2000</strong> 1999 1998<br />
Enacted tax rate<br />
Capital gains taxed<br />
33.3% 33.3% 33.3%<br />
at lower rates<br />
Effect of foreign tax<br />
-5.8% -1.0% -2.0%<br />
rates differential<br />
Changes in tax rates<br />
1.5% - -<br />
in France and Germany<br />
Impact of the use<br />
-2.7% - -<br />
of the partial method - -2.4% -2.4%<br />
Other 0.1% -1.5% -0.5%<br />
EFFECTIVE TAX RATE 26.4% 28.4% 28.4%<br />
6. E ARNINGS PER SHARE -<br />
DILUTED<br />
The diluted earnings per share amounts to 6.69 in<br />
<strong>2000</strong> and 6.12 in 1999.<br />
The calculation of basic and diluted earnings per<br />
share is based on the weighted average number of<br />
shares in circulation, after deduction of the shares<br />
owned by the <strong>consolidated</strong> companies. The dilution<br />
effect of stock options and stock warrants is computed<br />
in accordance with the treasury stock method.<br />
82<br />
7. I NTANGIBLE ASSETS<br />
AND GOODWILL<br />
◗ A NALYSIS OF CHANGES IN GOODWILL<br />
(in millions of euros) <strong>2000</strong> 1999<br />
Goodwill, net, as of January 1 3,157 2,669<br />
Amortization (120) (108)<br />
Additions 309 580<br />
Divestments (185) (20)<br />
Fair value exercise (352) (182)<br />
Translation adjustment 11 218<br />
Goodwill, net, as of December 31 2,820 3,157<br />
Goodwill recognized before January 1, 1989 has<br />
been debited against retained earnings. The analysis<br />
of the residual net amount of this goodwill is<br />
as follows:<br />
(in millions of euros) <strong>2000</strong> 1999<br />
Goodwill, net, as of January 1 79 84<br />
Amortization (3) (5)<br />
Divestments (10) -<br />
Goodwill, net, as of December 31 66 79
◗ I NTANGIBLE ASSETS<br />
(in millions of euros) Market shares Trademarks Other Total<br />
Cost as of January 1, 1999 595 46 270 911<br />
Additions 255 - 63 318<br />
Disposals - - (20) (20)<br />
Other changes (6) - 21 15<br />
Translation adjustment (13) - 9 (4)<br />
Costs as of December 31,1999 831 46 343 1,220<br />
Accumulated depreciation and write-down - - (141) (141)<br />
Net book value as of December 31, 1999 831 46 202 1,079<br />
Cost as of January 1, <strong>2000</strong> 831 46 343 1,220<br />
Additions 76 - 79 155<br />
Disposals (6) (46) (28) (80)<br />
Other changes 9 - (25) (16)<br />
Translation adjustment (7) - 5 (2)<br />
Costs as of December 31, <strong>2000</strong> 903 - 374 1,277<br />
Accumulated depreciation and write-down - - (150) (150)<br />
Net book value as of December 31, <strong>2000</strong> 903 - 224 1,127<br />
8. S COPE VARIATIONS<br />
◗ IMPACT ON THE BALANCE SHEET OF ACQUISITION OF CONSOLIDATED COMPANIES<br />
(in millions of euros) <strong>2000</strong> 1999<br />
Long-term assets 594 572<br />
Long-term liabilities (356) (424)<br />
Working capital requirements 62 (16)<br />
Net assets of companies acquired 300 132<br />
<strong>Lafarge</strong> share in net assets acquired 293 27<br />
Minority interests acquired 92 487<br />
Investments in equity affiliates - 17<br />
Market shares and trademarks 15 150<br />
Residual goodwill 281 755<br />
Cost of investments 681 1 436<br />
Cost of investment acquired in previous years (63) (564)<br />
Cost of investments acquired during the year 618 872<br />
Net cash of acquired companies (34) (4)<br />
TOTAL 584 868<br />
The main newly <strong>consolidated</strong> companies during the year are:<br />
- <strong>Lafarge</strong> Halla Cement Corporation (South Korea/Cement);<br />
- Presque Isle Corporation (USA/Aggregates);<br />
- Warren Paving & Materials Group (Canada/Aggregates).<br />
◗ C HANGE IN CONSOLIDATION METHOD<br />
The activities of the Specialty Products Division, sold at the end of the year, are recorded in the <strong>accounts</strong> using<br />
the equity method. The impact of this change on the key balance sheet headings is presented in note 10.<br />
83
Consolidated financial statements<br />
9. P ROPERTY, PLANT AND EQUIPMENT<br />
(in millions of euros) Land Buildings Machinery, Construction Total<br />
equipment, in progress<br />
fixtures and<br />
fittings<br />
Cost as of January 1, 1999 1,417 1,905 8,118 539 11,979<br />
Additions 38 161 403 476 1,078<br />
Disposals (94) (52) (366) (30) (542)<br />
Change in scope 68 181 292 94 635<br />
Other changes 20 53 286 (407) (48)<br />
Translation adjustment 120 80 535 46 781<br />
Cost as of December 31, 1999 1,569 2,328 9,268 718 13,883<br />
Accumulated depreciation and write-down (147) (968) (4,864) (5,979)<br />
Net book value as of December 31, 1999 1,422 1,360 4,404 718 7,904<br />
Cost as of January 1, <strong>2000</strong> 1,569 2,328 9,268 718 13,883<br />
Additions 61 250 332 583 1,226<br />
Disposals (21) (44) (270) (12) (347)<br />
Change in scope 144 (37) 192 (26) 273<br />
Other changes 45 118 338 (473) 28<br />
Translation adjustment 28 28 157 13 226<br />
Cost as of December 31, <strong>2000</strong> 1,826 2,643 10,017 803 15,289<br />
Accumulated depreciation and write-down (200) (1,025) (5,182) - (6,407)<br />
Net book value as of December 31, <strong>2000</strong> 1,626 1,618 4,835 803 8,882<br />
Depreciation charge and losses due to write-down<br />
of property, plant and equipment is as follows: 10. I NVESTMENTS<br />
(in millions of euros) <strong>2000</strong> 1999 1998<br />
Depreciation<br />
Write-down of property,<br />
741 646 604<br />
plant and equipment 23 21 34<br />
TOTAL 764 667 638<br />
◗ C APITAL LEASES<br />
The gross value of property, plant and equipment<br />
includes €41 million of assets acquired under capital<br />
leases for the year ended December 31, <strong>2000</strong><br />
(1999: €43 million) and the remaining debt on such<br />
assets totals €22 million for the year ended December<br />
31, <strong>2000</strong> (1999: €17 million).<br />
84<br />
◗ E QUITY AFFILIATES<br />
(in millions of euros) <strong>2000</strong> 1999<br />
Beginning of the period<br />
Changes<br />
333 316<br />
Share in net income of affiliates<br />
Dividends received from equity<br />
50 51<br />
affiliates<br />
New investments<br />
(15) (14)<br />
or share capital increases<br />
Divestments and reduction<br />
32 32<br />
in ownership percentage<br />
Change from equity method<br />
(1) (21)<br />
to consolidation<br />
Change from full consolidation<br />
(28) (24)<br />
to equity method 39 -<br />
Other (4) (23)<br />
Translation adjustment 14 16<br />
End of the period 420 333
Key financial statistics of major equity affiliates (presented at 100%)<br />
Key financial statistics are derived from financial statements prepared on the same basis as Group financial<br />
statements.<br />
Balance sheet date (as of December 31) <strong>2000</strong> 1999<br />
(in millions of euros) Total of which of which Total of which of which<br />
Molins Materis Molins Egypt<br />
Long-term assets 1,538 340 594 1,030 288 200<br />
Working capital requirements 268 5 179 270 70 62<br />
Equity (853) (389) (182) (609) (306) (50)<br />
Provisions (132) (3) (71) (117) (45) (48)<br />
Net indebtedness (821) (47) (520) (574) (7) (164)<br />
Statement of income data<br />
(year ended December 31)<br />
(in millions of euros) <strong>2000</strong> 1999 1998<br />
Net sales 977 898 496<br />
Operating profit<br />
on ordinary activities 154 142 77<br />
Net income 65 93 45<br />
◗ O THER INVESTMENTS<br />
(in millions of euros) <strong>2000</strong> 1999<br />
Investments in non-<strong>consolidated</strong><br />
companies 1,606 293<br />
Long-term equity investments 110 120<br />
TOTAL 1,716 413<br />
• Investments in non-<strong>consolidated</strong> companies<br />
As of December 31, <strong>2000</strong>, <strong>Lafarge</strong> holds 22.58%<br />
of Blue Circle Industries PLC shares for €1,031 million.<br />
On the other hand, Dresdner Bank holds<br />
9.77% of Blue Circle Industries PLC shares.<br />
On June, 9, <strong>Lafarge</strong> contractually agreed with<br />
Dresdner Bank to compensate the Bank for any<br />
loss incurred on the sale of Blue Circle Industries<br />
PLC shares at a smaller price than the purchase price.<br />
85<br />
• Long-term equity investments<br />
(in millions of euros) Gross Net Estimated<br />
value value value<br />
Cost as of<br />
January 1, 1999 176 176 308<br />
Net disposals (56) (56) (134)<br />
Change<br />
in estimated value - - 23<br />
Cost as of<br />
December 31, 1999 120 120 197<br />
Net disposals (10) (10) (41)<br />
Change<br />
in estimated value - - 18<br />
Cost as of<br />
December 31, <strong>2000</strong> 110 110 174<br />
Long-term equity investments represent interests<br />
of between 0.5% and 3% in several listed companies.<br />
Their estimated value is determined using the<br />
companies' net equity as a reference.<br />
11. I NVENTORIES<br />
AND WORK- IN- PROGRESS<br />
(in millions of euros) <strong>2000</strong> 1999<br />
Raw materials 288 303<br />
Work-in-progress 71 48<br />
Finished and<br />
semi-finished goods 638 576<br />
Maintenance and operating supplies 397 385<br />
Inventories, gross 1,394 1,312<br />
Less allowance (85) (75)<br />
Inventories, net 1,309 1,237
Consolidated financial statements<br />
12. A CCOUNTS<br />
RECEIVABLE - TRADE<br />
(in millions of euros) <strong>2000</strong> 1999<br />
Accounts and notes receivable 1,628 2,050<br />
Less allowance<br />
for doubtful receivables (133) (142)<br />
TOTAL 1,495 1,908<br />
The activity in the allowance for doubtful receivables<br />
is as follows:<br />
(in millions of euros) <strong>2000</strong> 1999<br />
Balance as of January 1 (142) (120)<br />
Provision charged to income (76) (75)<br />
Release for consumption 65 67<br />
Cancellation 5 7<br />
Other changes 17 (12)<br />
Translation adjustment (2) (9)<br />
Balance as of December 31 (133) (142)<br />
In January <strong>2000</strong>, the Group has entered into pluriannual<br />
securitization agreements of trade<br />
receivables without recourse. "Accounts and notes<br />
receivable" is presented net of outstanding balances<br />
of receivables sold of €410 million.<br />
The agreements are guaranteed by subordinated<br />
deposits classified in long-term deposits for<br />
€66 million as of December 31, <strong>2000</strong>.<br />
13. C ASH AND CASH<br />
EQUIVALENTS<br />
In order to give a true and fair view of the <strong>accounts</strong>,<br />
in accordance with Art. 9 of the commercial law,<br />
the Group did not adhere to the strict required<br />
application of the accounting practices and included<br />
in cash and cash equivalent a receivable of<br />
€667 million representing the cash received on<br />
January 22, 2001, related to the sale of the major<br />
part of the Specialty Products Division.<br />
86<br />
14. C OMMON EQUITY<br />
INTERESTS<br />
◗ C OMMON STOCK<br />
As of December 31, <strong>2000</strong>, <strong>Lafarge</strong> common stock<br />
comprises 112,441,935 shares with a par value of<br />
FRF25 each. Changes in common stock are as follows:<br />
(in thousands of shares) <strong>2000</strong> 1999<br />
Shares outstanding<br />
at beginning of year 104,978 102,787<br />
Dividend reinvested 366 1,325<br />
Capital increase 3,180 494<br />
Exercise of stock<br />
subscription options 155 372<br />
Exercise of stock<br />
subscription warrants (ORANE) 3,763 -<br />
Shares outstanding<br />
at the end of year 112,442 104,978<br />
Average number of shares<br />
outstanding (for earnings<br />
per share calculation purpose,<br />
excluding treasury stock) 107,098 99,255<br />
Stock subscription and purchase options plans as<br />
well as stock subscription warrants plans related to<br />
the bonds redeemable in stock or cash are described<br />
in the "Financial and legal information". As of<br />
December 31, <strong>2000</strong>, voting rights attaching to the<br />
outstanding shares totaled 123,686,779, after inclusion<br />
of the double voting rights attaching to registered<br />
shares held at least two years and cancellation of the<br />
voting rights attaching to treasury stock.<br />
◗ T REASURY SHARES<br />
As of December 31, <strong>2000</strong>, <strong>Lafarge</strong> and its<br />
subsidiaries held 1,837,840 treasury shares.<br />
The Annual General Meetings of May 26, 1998<br />
and May 27, 1999 granted the authorization to<br />
purchase <strong>Lafarge</strong>’s stock with a view to:<br />
• regulating the share price of the Company,<br />
• granting stock purchase options to employees<br />
and management of the Company and/or all or<br />
certain Group companies,
• granting stock to employees under employee<br />
profit sharing arrangements or corporate saving<br />
schemes,<br />
• holding, disposing of or generally transferring<br />
the shares, in particular by way of exchange<br />
(or allotment),<br />
• if necessary, canceling the stock in order to<br />
optimize the earning per share.<br />
994,585 shares are held by <strong>Lafarge</strong> pursuant to the<br />
aforementioned authorizations, the rest being held<br />
by Group subsidiaries.<br />
15. A DDITIONAL<br />
PAID- IN CAPITAL<br />
Additional paid-in capital represents the difference<br />
between the issue price in cash or in kind and the<br />
par value of the shares, after deduction of issuance<br />
costs, net of tax, of €41 million in <strong>2000</strong> (€36 million<br />
in 1999) .<br />
18. P ROVISIONS<br />
◗ M OVEMENTS OF THE YEAR ( EXCLUDING DEFERRED TAXES)<br />
16. R ETAINED EARNINGS<br />
Retained earnings, before appropriation, are as<br />
follows:<br />
(in millions of euros) <strong>2000</strong> 1999<br />
Retained earnings before<br />
deduction of treasury stock 3,023 3,268<br />
Treasury stock (113) (88)<br />
TOTAL 2,910 3,180<br />
The distribution of certain reserves could result in<br />
an additional tax liability. Such reserves are considered<br />
as permanently invested and therefore no<br />
provision for taxation has been made.<br />
17. O THER EQUITY<br />
Other equity includes investments subsidies and,<br />
in 1999, an amount of €286 million relating to shares<br />
issued during the first half of year <strong>2000</strong>, in order<br />
to remunerate the former shareholders of <strong>Lafarge</strong><br />
Braas following the sale of their shares.<br />
(in millions of euros) Pension Site Restructuring Other Total<br />
and other restoration<br />
Balance<br />
benefits and environment<br />
as of January 1, 1999 541 174 114 256 1,085<br />
Provision of the year 49 27 27 75 178<br />
Release for consumption (21) (26) (72) (66) (185)<br />
Cancellation (2) - (2) (9) (13)<br />
Other changes (11) 4 22 38 53<br />
Translation adjustment 31 11 6 - 48<br />
Balance<br />
as of December 31, 1999 587 190 95 294 1,166<br />
Provision of the year 77 23 30 129 259<br />
Release for consumption (56) (32) (52) (77) (217)<br />
Cancellation (3) (1) (2) (50) (56)<br />
Other changes (19) 9 27 40 57<br />
Translation adjustment 13 1 3 - 17<br />
Balance<br />
as of December 31, <strong>2000</strong> 599 190 101 336 1,226<br />
87
Consolidated financial statements<br />
◗ D EFERRED INCOME TAXES<br />
As explained note 1.L., as of January 1, <strong>2000</strong>,<br />
the Group has changed its method of accounting<br />
for deferred taxes as follows:<br />
(in millions of euros) <strong>2000</strong> 1999 1999<br />
liability liability published<br />
Significant components method of the Group's method net deferred<br />
pro forma<br />
tax balance are as follows:<br />
Balance<br />
as of December 31 810 770 13<br />
The impact of the change in the recognition of<br />
deferred tax on the opening balance has been debited<br />
directly to retained earnings for an amount of<br />
€823 million.<br />
Concerning the effect of the change on the income<br />
statements, the impacts are as follows:<br />
(in millions of euros) <strong>2000</strong> 1999 1999<br />
restated published<br />
Income tax (379) (475) (389)<br />
Minority interests (213) (249) (259)<br />
Net income, Group share 726 538 614<br />
Income per share<br />
(in euros) 6.8 5.4 6.2<br />
Significant components of the Group’s net deferred<br />
tax balance are as follows:<br />
(in millions of euros) <strong>2000</strong> 1999<br />
Deferred tax - assets<br />
pro forma<br />
Employee benefits liabilities 137 129<br />
Depreciation and amortization 99 78<br />
Expenses and provisions<br />
not deductible in the year 67 50<br />
Restructuring reserves 16 15<br />
TOTAL ASSETS 319 272<br />
Deferred tax - liabilities<br />
Depreciation and amortization 891 829<br />
Employee benefit prepayments 105 75<br />
Others 133 138<br />
TOTAL LIABILITIES 1,129 1,042<br />
Net deferred tax - liability 810 770<br />
88<br />
19. BORROWINGS AND<br />
FINANCIAL INDEBTEDNESS<br />
A. Debt by category<br />
Financial debt consists of:<br />
(in millions of euros) As of As of<br />
December 31, December 31,<br />
<strong>2000</strong> 1999<br />
Perpetual loan notes (1) 247 292<br />
Debenture loans (2) 3,219 2,610<br />
Other notes (3) 1,481 1,398<br />
Bank loans (4) and overdrafts 3,138 1,851<br />
Others 291 320<br />
Total debt 8,376 6,471<br />
Less short-term borrowings<br />
and current portion<br />
of long-term debt 886 951<br />
Total long-term debt 7,490 5,520<br />
◗ (1) PERPETUAL LOAN NOTES<br />
I SSUANCE DATE January 31, May 9,<br />
(in millions of euros) 1990 1990<br />
Issued amount 610 152<br />
Balance at December 31, 1999 230 62<br />
Balance at December 31, <strong>2000</strong> 194 53<br />
In 1990, <strong>Lafarge</strong> issued two series of subordinated<br />
notes (‘TSDI’), repackaged in 1996 as perpetual<br />
loan notes (‘EDIs’). These notes bear interest at an<br />
annual rate of 6-month Pibor + 0.45% for an initial<br />
term of 15 years.<br />
According to an agreement entered with third party<br />
special vehicle companies, the repackaged notes<br />
are recorded on the balance sheet for an amount<br />
that will be progressively reduced to a nil value at<br />
the end of the fifteen-year period. In this agreement,<br />
and in return for an initial lump sum payment<br />
by <strong>Lafarge</strong>, the third party companies have<br />
promised to hold or to repurchase the notes to noteholders<br />
in 2005, and have agreed to relinquish any<br />
rights for interest on these notes after that time.
According to this arrangement:<br />
• the perpetual notes are recorded in the balance<br />
sheet at their par value after deduction of the initial<br />
lump sum payment; each year, these notes are<br />
subject to an amortization corresponding to the<br />
annual interest yielded by this invested lump sum;<br />
• the <strong>consolidated</strong> net result of each year is impacted<br />
◗ (2) DEBENTURE LOAN PORTFOLIO<br />
(in millions of euros) Type of rate Interest rate As of December 31<br />
89<br />
by the interest expenses borne on the par value,<br />
after deduction of the portion corresponding to the<br />
amortization.<br />
The subordinated notes, issued at floating rate, have<br />
been swapped in fixed rate for an amount of<br />
€739 million.<br />
<strong>2000</strong> 1999<br />
1 Bn FRF - 1993-<strong>2000</strong> - <strong>Lafarge</strong> SA Fixed 8.000% - 152<br />
1 Bn FRF - 1997-2007 - <strong>Lafarge</strong> SA Fixed 6.000% 152 152<br />
1 Bn FRF - 1997-2004 - <strong>Lafarge</strong> SA Fixed 5.600% 152 152<br />
1 Bn FRF - 1998-2008 - <strong>Lafarge</strong> SA Fixed 5.400% 152 152<br />
1 Bn FRF - 1998-2005 - <strong>Lafarge</strong> SA Fixed 5.100% 152 152<br />
500 M EUR - 1998-2006 - <strong>Lafarge</strong> SA Fixed 5.125% 500 500<br />
500 M EUR - 1999-2004 - <strong>Lafarge</strong> SA Fixed 4.375% 500 500<br />
700 M EUR - <strong>2000</strong>-2007 - <strong>Lafarge</strong> SA Fixed 6.375% 700 -<br />
250 M USD - 1998-2005 - <strong>Lafarge</strong> Corporation Fixed 6.380% 269 249<br />
200 M USD - 1998-2008 - <strong>Lafarge</strong> Corporation Fixed 6.500% 215 199<br />
200 M USD - 1998-2013 - <strong>Lafarge</strong> Corporation Fixed 6.880% 215 199<br />
125 M GBP - 1991-2001 - Redland PLC Fixed 10.875% 200 203<br />
Other debenture loans Fixed - 12 -<br />
TOTAL 3,219 2,610<br />
In <strong>2000</strong>, <strong>Lafarge</strong> SA issued an €700 million bond under its Euro Medium Term Notes program, at a fixed face<br />
rate of 6.375% maturing in 7 years.<br />
◗ (3) OTHER NOTES<br />
<strong>Lafarge</strong> SA has set up programs in order to issue long, medium- and short-term debts:<br />
• an Euro Medium Term Notes program, set up in 1999 for an initial maximum amount of €1.5 billion, and increased<br />
to €3 billion in <strong>2000</strong>. At the end of year <strong>2000</strong>, the EMTN issuance amounted to €1,510 million, leaving an available<br />
balance of €1,490 million on the program;<br />
• a Commercial Paper program ("Billets de Trésorerie"), with a maximum amount of €2.5 billion. At the end of <strong>2000</strong>,<br />
commercial paper issuance were of €730 million, leaving an available balance of €1,770 million.<br />
Some other subsidiaries (<strong>Lafarge</strong> Polska, <strong>Lafarge</strong> India) have also set up Commercial Paper programs for smaller<br />
amounts.<br />
◗ (4) COMMITTED CREDIT LINES<br />
As of December 31, <strong>2000</strong>, the medium- and long-term committed credit lines, set up by <strong>Lafarge</strong> SA and its<br />
subsidiaries, amounted to €4.1 billion, of which €2.4 billion were available (€4.1 billion and €2.3 billion, respectively,<br />
as of December 31, 1999).<br />
The average maturity of these lines was approximately 3 years as of end of <strong>2000</strong>.
Consolidated financial statements<br />
B. Debt by maturity<br />
(in millions of euros) As of As of<br />
December 31, December 31,<br />
<strong>2000</strong> 1999<br />
<strong>2000</strong> - 951<br />
2001 886 545<br />
2002 1,231 734<br />
2003 685 343<br />
2004 1,781 1,275<br />
2005 1,178 -<br />
beyond 5 years 2,615 2,623<br />
TOTAL 8,376 6,471<br />
As of end of <strong>2000</strong>, €981 million of short-term debt<br />
(€1,003 million as of end of 1999) have been reclassified<br />
into medium- and long-term debt, as being backed<br />
by medium- and long- term committed credit lines.<br />
C. Debt by currency<br />
As of December 31, Before Impact of After<br />
<strong>2000</strong> swaps currency swaps<br />
(in millions of euros) swaps<br />
EUR and “in” currencies 5,087 -1,099 3,988<br />
USD 1,208 1,100 2,308<br />
GBP 1,455 -91 1,364<br />
JPY 132 23 155<br />
CHF 22 43 65<br />
Others 472 24 496<br />
TOTAL 8,376 8,376<br />
As of December 31, Before Impact of After<br />
1999 swaps currency swaps<br />
(in millions of euros) swaps<br />
EUR and “in” currencies 4,517 -1,312 3,205<br />
USD 1,048 929 1,977<br />
GBP 389 310 699<br />
JPY 59 0 59<br />
CHF 34 21 55<br />
Others 424 52 476<br />
TOTAL 6,471 6,471<br />
90<br />
D. Debt by interest rate (1)<br />
As of December 31, Before Impact of After<br />
<strong>2000</strong> swaps interest swaps<br />
(in millions of euros) rate swaps<br />
Floating rate (2) 4,127 -1,004 3,123<br />
Fixed rate<br />
below 6% 1,964 391 2,355<br />
between 6% and 10% 1,923 593 2,516<br />
10% and over 362 20 382<br />
TOTAL 8,376 8,376<br />
As of December 31, Before Impact of After<br />
1999 swaps interest swaps<br />
(in millions of euros) rate swaps<br />
Floating rate (2) 3,094 -643 2,451<br />
Fixed rate<br />
Below 6% 1,913 378 2,291<br />
Between 6% and 10% 1,195 239 1,434<br />
10% and over 269 26 295<br />
TOTAL 6,471 6,471<br />
(1) The average spot interest rate of the gross indebtedness, as at December 31, <strong>2000</strong>,<br />
was 6.6% (6.1% as at December 31, 1999)<br />
(2) As at December 31, <strong>2000</strong>, the average effective rate of the floating rate debt,<br />
all currencies mixed, was 7.1% (5.7% as of December 31, 1999)<br />
20. FINANCIAL INSTRUMENTS<br />
◗ PURPOSES FOR USING DERIVATIVE<br />
INSTRUMENTS<br />
The Group only uses derivative financial instruments<br />
to manage market risk exposures, as these<br />
financial instruments are generally designated as<br />
hedges of underlying exposures associated with<br />
specific assets, liabilities or commitments.<br />
No derivative instrument is negotiated for speculative<br />
purpose.<br />
◗ F OREIGN CURRENCY RISK<br />
Group policies require all liabilities of a company<br />
to be denominated in the same currency as the cash<br />
flow used to service and repay said liability. Similarly,<br />
all investments must be performed in the<br />
same currency as the company's cash flow. The<br />
Group may amend this general rule under special<br />
circumstances in order to take into account<br />
specific conditions in a particular country (high
inflation, high interest rate, convertibility, liquidity…).<br />
When needed, currency swaps are used<br />
to convert debts most often raised in euros, into<br />
foreign currencies.<br />
In the course of its operations, and in relation to<br />
transactional foreign currency exposures, the Group<br />
policy is to hedge all material foreign currency exposures<br />
through derivative instruments as soon as a<br />
firm commitment is entered into or known. These<br />
derivative instruments are limited to forward contracts<br />
and standard (plain vanilla) foreign currency<br />
options, with a term generally less than one year.<br />
The Group does not enter into foreign currency<br />
exchange contracts for speculative purposes.<br />
If material, the Group also hedges estimated cash<br />
flows related to operational budget, forecasted investments<br />
or dividends usually using forward contracts.<br />
Forward exchange contract and currency swap<br />
portfolio<br />
(in millions of euros) Principals as Principals as<br />
of December 31, of December 31,<br />
<strong>2000</strong> 1999<br />
Forward purchase,<br />
including forward leg<br />
of currency swaps<br />
GBP 264 -<br />
USD 33 98<br />
SEK 19 1<br />
Other currencies 9 2<br />
TOTAL 325 101<br />
Forward sales,<br />
including forward leg<br />
of currency swaps<br />
USD 1,085 995<br />
GBP 168 337<br />
CHF 50 21<br />
SEK 24 33<br />
JPY 21 26<br />
BRL - 47<br />
Other currencies 16 16<br />
TOTAL 1,364 1,475<br />
91<br />
At end of <strong>2000</strong> and 1999, all forward contracts had<br />
a maturity below than one year.<br />
The principal amount of derivatives represents the<br />
face value of financial instruments. It is not a direct<br />
measure of the Group's exposure to foreign currency<br />
risk. Principal amounts in foreign currency are<br />
expressed in euros at the year-end exchange rate.<br />
◗ I NTEREST RATE RISK<br />
Interest rate exposure can be sub-divided into the<br />
following risks:<br />
• a price risk for fixed-rate financial assets and liabilities.<br />
By contracting a fixed rate liability for<br />
example, the Group is exposed to an opportunity<br />
cost in the event of a fall in interest rates. Changes<br />
in interest rates impact the market value of fixed<br />
rate assets and liabilities, leaving the associated<br />
financial income or expense unchanged until their<br />
maturity;<br />
• a cash flow risk for floating rate assets and liabilities.<br />
Changes in interest rates have small<br />
impact on the market value of floating rate assets<br />
and liabilities, but directly influence the future<br />
financial income or expense flows of the company.<br />
In accordance with general policy, the Group seeks<br />
to arbitrage these two types of risks, using derivatives<br />
instruments in order to hedge against the interest<br />
rate risk to which its financial assets and liabilities<br />
- and in particular its borrowings - are<br />
exposed. These derivatives are never held or issued<br />
for speculative purposes.
Consolidated financial statements<br />
Interest rate swap and FRA portfolio<br />
As of December 31, <strong>2000</strong> Average Maturities of notional contract values<br />
(in millions of euros)<br />
Interest rate swaps: pay fixed<br />
fixed rate 2001 2002 2003 2004 2005 > 5 years Total<br />
EUR and "in" currencies 7.06% 99 234 77 - 835 221 1,466<br />
GBP 7.12% 48 54 - - - - 102<br />
Interest rate swaps: receive fixed<br />
CHF 2.77% 20 - - - - - 20<br />
EUR and "in" currencies 5.17% 2 2 2 2 47 - 55<br />
JPY 3.00% - 19 - - - - 19<br />
ZAR 14.64% 4 4 4 3 - - 15<br />
Interest rate swaps:<br />
pay and receive floating<br />
EUR and "in" currencies N/A - 175 - - - - 175<br />
TOTAL 173 488 83 5 882 221 1,852<br />
As of December 31, 1999 Average Maturities of notional contract values<br />
(in millions of euros)<br />
Interest rate swaps: pay fixed<br />
fixed rate <strong>2000</strong> 2001 2002 2003 2004 > 5 years Total<br />
EUR and "in" currencies 7.71% 222 99 84 77 - 739 1,221<br />
GBP 7.24% 48 48 55 - - - 151<br />
SEK 6.03% 16 - - - - - 16<br />
Interest rate swaps: receive fixed<br />
CHF 2.77% - 19 - - - - 19<br />
EUR and "in" currencies 7.09% 141 2 2 2 2 47 196<br />
GBP 7.00% 8 - - - - - 8<br />
JPY 2.97% 39 - 19 - - - 58<br />
ZAR 14.64% 4 4 4 4 3 - 19<br />
Interest rate swaps:<br />
pay and receive floating<br />
EUR and "in" currencies N/A - - 5 - - - 5<br />
USD N/A 30 - - - - - 30<br />
FRA purchased<br />
PLN 18.95% 6 - - - - - 6<br />
TOTAL 514 172 169 83 5 786 1,729<br />
The principal amount of derivatives represents the<br />
face value of financial instruments. It does not represent<br />
actual amount exchanged by the counterparts<br />
and thus is not a direct measure of the Group's<br />
exposure to interest rate risk. Notional amounts<br />
in foreign currency are expressed in euros at the<br />
year end exchange rate.<br />
◗ C OMMODITY RISK<br />
The Group is subject to a risk of price changes principally<br />
in the coal, electricity, pet coke, gas and<br />
clinker markets. Until now, the Group has rarely<br />
92<br />
used derivatives related to commodities.<br />
As of end of 1999 and <strong>2000</strong>, the Group had no<br />
derivative instrument related to commodities.<br />
◗ C OUNTERPARTY RISK<br />
The Group is exposed to credit risk in the event of<br />
a counterpart’s default. The Group limits its exposure<br />
to counterpart risk by rigorously selecting the<br />
counterparts with which it trades over the counter,<br />
through regularly monitoring limits calculated<br />
according to several criteria (rating assigned by<br />
rating agencies, assets and equity), as well as the
nature and maturity of operations. These limits are<br />
regularly updated.<br />
The Group's exposure to credit risk is limited and<br />
there is no material concentration of risk with any<br />
counterpart. We do not anticipate any third party<br />
default that might have a significant impact on our<br />
financial positions and results.<br />
21. FAIR VALUE<br />
Cash and cash equivalents, trade <strong>accounts</strong> receivable,<br />
bank overdrafts and other short-term borrowings,<br />
trade <strong>accounts</strong> payable:<br />
given the short-term nature of these balances, carrying<br />
amount is considered to represent fair value.<br />
Marketable securities, investment securities:<br />
estimated fair value of publicly traded securities are<br />
based on quoted market prices as of December 31,<br />
<strong>2000</strong> and 1999. For other investments for which there<br />
is no quoted price, a reasonable estimate of fair value<br />
could not be made without incurring excessive costs.<br />
93<br />
Debenture loans:<br />
the fair value of the debenture loans is estimated<br />
at the quoted value for borrowings listed on a sufficiently<br />
liquid market.<br />
Other long-term debts:<br />
the fair value of the other long-term debts is determined<br />
for each borrowing by estimating future cash<br />
flows, discounting these future cash flows using<br />
the swap interest rate curves at year end, and taking<br />
into account a spread that corresponds to the<br />
average risk classification of the Group.<br />
Off- balance sheet instruments:<br />
the fair value of foreign exchange forward contracts<br />
and currency swaps is calculated by the<br />
Group, using December 31 market prices for contracts<br />
of similar terms.<br />
The fair value of interest rate swaps is obtained<br />
from the banks that are counterparts of the transactions.<br />
(in millions of euros) As of December 31, <strong>2000</strong> As of December 31, 1999<br />
Carrying Net fair Carrying Net fair<br />
amount value amount value<br />
Balance sheet financial instruments<br />
Assets<br />
Cash 1,451 1,451 486 486<br />
Marketable securities 289 289 575 575<br />
Cash and cash equivalents 1,740 1,740 1,061 1,061<br />
Accounts receivable - Trade 1,495 1,495 1,908 1,908<br />
Investments (other than equity affiliates) 1,716 1,916 413 632<br />
Liabilities<br />
Bank overdrafts and other short-term borrowings 307 307 296 296<br />
Accounts payable - Trade 1,114 1,114 1,041 1,041<br />
Debenture loans 3,219 3,140 2,610 2,528<br />
Other long-term debts 4,850 4,875 3,565 3,580<br />
Off-balance sheet financial instruments<br />
Interest rate swaps 1,852 -211 1,729 -224<br />
Forward rate agreements - - 6 -<br />
Forward exchange contracts 98 1 98 6<br />
Currency swaps 1,580 58 1,412 -25
Consolidated financial statements<br />
22. C OMMITMENTS<br />
AND CONTINGENCIES<br />
(in millions of euros) <strong>2000</strong> 1999<br />
Securities and assets pledged 264 54<br />
Mortgages 214 71<br />
Guarantees given 223 397<br />
Capital expenditures commitments 98 52<br />
Non-capitalized lease commitments 205 140<br />
Other commitments 44 75<br />
TOTAL 1,048 789<br />
Other commitments:<br />
The Group, as part of the agreements for the purchase<br />
of certain <strong>consolidated</strong> companies, has granted third<br />
party shareholders put options. The exercise of these<br />
options would result in an increase in the percentage<br />
of ownership interest in these companies. Most of these<br />
options are exercisable after 2003. Assuming that all<br />
of them are exercised, the purchase price resulting<br />
from such exercise would amount to, as of<br />
December 31, <strong>2000</strong>, €311 million.<br />
23. R ELATED PARTY<br />
TRANSACTIONS<br />
Transactions with equity affiliates (excluding Spe-<br />
cialty Products companies) are not significant in<br />
<strong>2000</strong>.<br />
The transactions entered into with the other related<br />
parties were made at normal terms and conditions,<br />
similar to those normally granted to comparable<br />
groups.<br />
94<br />
24. E MPLOYEES<br />
AS AT D ECEMBER 31<br />
AND EMPLOYEES COST<br />
25. DIRECTORS’ AND EXECUTIVE<br />
OFFICERS’ REMUNERATION<br />
FOR SERVICES IN<br />
CONSOLIDATED COMPANIES<br />
(in millions of euros) <strong>2000</strong> 1999 1998<br />
Board of Directors* 0.5 0.4 0.3<br />
Senior Executives 8.1 8.1 6.1<br />
TOTAL 8.6 8.5 6.4<br />
* Directors' fees<br />
<strong>2000</strong> 1999 1998<br />
Management staff 7,546 8,539 7,768<br />
Non-management staff 58,407 62,406 57,910<br />
Total employees<br />
Employees costs<br />
65,953 70,945 65,678<br />
(millions of euros) 2,253 1,892 1,845<br />
26. LITIGATION AND OTHER<br />
NON-RECURRING MATTERS<br />
Penalties given by the European Commission to<br />
several cement companies in the Group in 1994<br />
have been reduced by approximately 50% by a<br />
ruling of The Court of first instance of the European<br />
communities on March 15, <strong>2000</strong>, which<br />
decreases the total amount of the fines from<br />
€29.0 million to €15.2 million for the Group.<br />
In accordance with the article 81 of the Rome<br />
Treaty, the European Commission is conducting<br />
an inquiry with respect to the gypsum industry<br />
in Europe, however it is not possible, at this stage,<br />
to foresee the end-result nor the deadline. As at<br />
December 31, <strong>2000</strong>, no liability has been booked<br />
in the Group <strong>accounts</strong>.
Finally, certain subsidiaries have litigation and claims pending in the normal course of business. Management<br />
is of the opinion that these matters will be settled without any significant impact on the Group's<br />
activity levels, assets, financial position or results.<br />
27. F IVE YEAR SUMMARY OF G ROUP FINANCIAL DATA<br />
(in millions of euros, unless otherwise indicated)<br />
Financial data at year end<br />
<strong>2000</strong> 1999 1998 1997 1996<br />
Number of shares outstanding (in thousands) 112,442 104,978 102,787 94,663 94,403<br />
Total equity 7,912 7,888 6,313 5,517 4,658<br />
Shareholders' equity Group share 6,043 5,851 4,689 4,153 3,827<br />
Shareholders' equity Group share per share (in euros) 54.6 56.6 48.3 46.5 42.7<br />
Net indebtedness (1) 6,636 5,410 5,321 4,920 1,420<br />
Consolidated income<br />
Sales 12,216 10,528 9,802 6,413 5,376<br />
Net income before amortization of goodwill 1,059 981 809 559 412<br />
Net income Group share 726 614 466 371 281<br />
Net cash from operating activities 1,576 1,495 1,282 883 715<br />
Per share data (in euros)<br />
Attributable net income for the year 6.8 6.2 4.9 4.1 3.1<br />
Cash flow from operating activities 14.7 15.1 13.6 9.9 7.9<br />
Employees<br />
Number of employees as at December 31 65,953 70,945 65,678 37,097 35,232<br />
(1) Including perpetual loan notes (EDIs) of €247 million in <strong>2000</strong>, €292 million in 1999, €333 million in 1998, €371 million in 1997 and of €404 million in 1996.<br />
95
Consolidated financial statements<br />
28. RATES OF EXCHANGE<br />
AS AT DECEMBER 31, <strong>2000</strong> (AGAINST THE EURO)<br />
96<br />
Year-end rate Average rate<br />
<strong>2000</strong> 1999 1998 <strong>2000</strong> 1999 1998<br />
US dollar (USD) 1.0747 0.9954 0.8571 1.0820 0.9374 0.9031<br />
Canadian dollar (CAD) 0.7170 0.6846 0.5537 0.7286 0.6307 0.6078<br />
Deutsche mark (DEM) 0.5113 0.5113 0.5113 0.5113 0.5113 0.5111<br />
Peseta (ESP) 0.0060 0.0060 0.0060 0.0060 0.0060 0.0060<br />
Sterling (GBP) 1.6023 1.6085 1.4175 1.6405 1.5171 1.4935<br />
Austrian schilling (ATS) 0.0727 0.0727 0.0727 0.0727 0.0727 0.0726<br />
Polish zloty (PLN) 0.2598 0.2405 0.2446 0.2495 0.2366 0.2576<br />
Moroccan dirham (MAD) 0.1014 0.0987 0.0922 0.1019 0.0956 0.0936<br />
South african rand (ZAR) 0.1422 0.1616 0.1461 0.1557 0.1532 0.1643<br />
Brasilian real (BRL) 0.5508 0.5545 0.7092 0.5908 0.5153 0.7761<br />
Chinese yuan (CNY) 0.1298 0.1202 0.1035 0.1307 0.1132 0.1086<br />
Philippine peso (PHP) 0.0215 0.0246 0.0219 0.0244 0.0239 0.0219
➜<br />
C OMPANIES INCLUDED<br />
IN THE CONSOLIDATION<br />
Divisions Consolidation<br />
method and percentage<br />
as of 12/31/<strong>2000</strong><br />
Country and companies Cement Aggregates Roofing Gypsum Speciality Method % %<br />
Argentina<br />
& Concrete Products control interest<br />
Durlock S.A. ■ Proportionate 40.00 40.00<br />
Klaukol (1) Mortars Equity 34.69 34.69<br />
<strong>Lafarge</strong> Losa ■ Full 60.00 60.00<br />
Australia<br />
Pioneer Plasterboard ■ Full 100.00 100.00<br />
Davco Australie (1) Mortars Equity 34.69 34.69<br />
Austria<br />
<strong>Lafarge</strong> Perlmooser AG ■ ■ Full 100.00 98.00<br />
Schiedel Kaminwerke GmbH<br />
Bramac Dachsysteme<br />
■ Full 100.00 100.00<br />
International GmbH<br />
Ziegelwerke Gleinstätten GmbH<br />
■ Proportionate 50.00 50.00<br />
& Co KG ■ Equity 25.00 25.00<br />
Belgium<br />
<strong>Lafarge</strong> Réfractaires<br />
Monolithiques Benelux (1) Refractories Equity 34.69 34.69<br />
Bengladesh<br />
<strong>Lafarge</strong> Surma Cement ■ Full 100.00 100.00<br />
Bosnia<br />
Schiedel Sistemi Dimnnjaka D.j.l ■ Full 100.00 100.00<br />
Brazil<br />
Companhia Nacional<br />
de Cimento Portland ■ Full 99.75 99.75<br />
Concrebras<br />
Gipsita SA Mineraçào,<br />
■ ■ Full 100.00 91.06<br />
Industria E commercio ■ Proportionate 60.00 60.00<br />
<strong>Lafarge</strong> Aluminoso Do Brazil (1) Aluminates Equity 34.69 34.69<br />
Cimento Tupi S.A. ■ Equity 20.00 19.95<br />
<strong>Lafarge</strong> Braas Roofing Brazil ■ Full 100.00 100.00<br />
Bulgaria<br />
Beker EOOD ■ Proportionate 50.00 50.00<br />
Cameroon<br />
CIMENCAM<br />
- Cimenteries du Cameroun ■ Full 55.31 55.31<br />
Chile<br />
Sociedad Industrial Romeral S.A. ■ Proportionate 40.00 40.00<br />
97
Consolidated financial statements<br />
Divisions Consolidation<br />
method and percentage<br />
as of 12/31/<strong>2000</strong><br />
Country and companies Cement Aggregates Roofing Gypsum Speciality Method % %<br />
China<br />
Beijing Chinefarge Cement<br />
& Concrete Products control interest<br />
Limited Liability Company ■ Full 65.00 56.79<br />
Beijing Ycheng <strong>Lafarge</strong> Concrete ■ Full 76.71 67.03<br />
<strong>Lafarge</strong> Onoda Gypsum in Shanghai ■ Full 57.20 57.20<br />
<strong>Lafarge</strong> Aluminates China (1) Aluminates Equity 34.69 34.69<br />
Dujiangyan ■ Full 75.00 65.53<br />
<strong>Lafarge</strong> Braas Roofing China ■ Full 100.00 100.00<br />
Czech. Republic<br />
Cízkovická Cementárna a.s. ■ ■ Full 96.37 94.48<br />
Denmark<br />
<strong>Lafarge</strong> Braas Dansk Tag A/S ■ Full 100.00 100.00<br />
Egypt<br />
Beni Suef Cement Company ■ Proportionate 47.50 47.50<br />
Finland<br />
<strong>Lafarge</strong> Braas Ormax Katot Oy AB ■ Full 100.00 100.00<br />
France and Overseas<br />
<strong>Lafarge</strong> Ciments ■ Full 100.00 100.00<br />
Société des Ciments Antillais ■ ■ Full 69.16 69.16<br />
<strong>Lafarge</strong> Bétons ■ Full 100.00 100.00<br />
<strong>Lafarge</strong> Granulats ■ Full 100.00 100.00<br />
<strong>Lafarge</strong> Plâtres ■ Full 100.00 100.00<br />
Chryso (1) Admixtures Equity 34.69 34.69<br />
<strong>Lafarge</strong> Aluminates (1) Aluminates Equity 34.69 34.69<br />
<strong>Lafarge</strong> Mortiers SA (1) Mortars Equity 34.69 34.69<br />
<strong>Lafarge</strong> Peintures (1) Paints Equity 34.69 34.69<br />
<strong>Lafarge</strong> Réfractaires Monolithiques (1) Refractories Equity 34.69 34.69<br />
<strong>Lafarge</strong> Couverture SA ■ Full 100.00 100.00<br />
Germany<br />
<strong>Lafarge</strong> Zement GmbH ■ ■ Full 100.00 100.00<br />
<strong>Lafarge</strong> Gips GmbH ■ Full 100.00 100.00<br />
<strong>Lafarge</strong> Aluminates GmbH (1) Aluminates Equity 34.69 34.69<br />
<strong>Lafarge</strong> Braas GmbH ■ Full 100.00 100.00<br />
Braas Dachsysteme GmbH & Co<br />
Dasy Roofing Accessories<br />
■ Full 100.00 100.00<br />
Production GmbH & Co ■ Full 100.00 100.00<br />
RuppKeramik GmbH ■ Full 100.00 100.00<br />
Schiedel GmbH & Co ■ Full 100.00 100.00<br />
Basalt Feuerfest GmbH (1) Refractories Equity 34.69 34.69<br />
98
Divisions Consolidation<br />
method and percentage<br />
as of 12/31/<strong>2000</strong><br />
Country and companies Cement Aggregates Roofing Gypsum Speciality Method % %<br />
Great-Britain<br />
& Concrete Products control interest<br />
<strong>Lafarge</strong> Redland Aggregates Ltd ■ Lime Full 100.00 100.00<br />
<strong>Lafarge</strong> Plasterboard Ltd ■ Full 100.00 100.00<br />
<strong>Lafarge</strong> Aluminates Ltd (1) Aluminates Equity 34.69 34.69<br />
<strong>Lafarge</strong> Monolithics (1) Refractories Equity 34.69 34.69<br />
Redland Roofing Systems Ltd ■ Full 100.00 100.00<br />
Greece<br />
Hellamat ■ Full 100.00 100.00<br />
Honduras<br />
Industria Cementera Hondurena ■ Full 53.00 52.44<br />
India<br />
<strong>Lafarge</strong> India Ltd ■ Full 85.42 85.42<br />
Indonesia<br />
P.T. Semen Andalas Indonesia ■ Full 82.36 79.93<br />
P.T. Monier Indonesia ■ Full 100.00 100.00<br />
Ireland<br />
<strong>Lafarge</strong> Plasterboard Ireland Ltd ■ Full 100.00 100.00<br />
Redland Tile and Brick Ltd ■ Full 100.00 100.00<br />
Italy<br />
<strong>Lafarge</strong> Adriasebina ■ ■ Full 100.00 98.95<br />
<strong>Lafarge</strong> Gessi SpA ■ Full 100.00 100.00<br />
<strong>Lafarge</strong> Coatings Italia (1) Paints Equity 34.69 34.69<br />
<strong>Lafarge</strong> Paints Italia (1) <strong>Lafarge</strong> Refrattari Monolitici<br />
Paints Equity 34.69 34.69<br />
Italia SRL (1) Refractories Equity 34.69 34.69<br />
<strong>Lafarge</strong> Braas Italia SpA ■ Full 100.00 100.00<br />
Baldini (1) Paints Equity 34.69 34.69<br />
Japan<br />
<strong>Lafarge</strong> Svenska Höganäs KK (1) Refractories Equity 34.69 34.69<br />
<strong>Lafarge</strong> Braas Roofing Japan ■ Full 60.94 60.94<br />
Jordan<br />
Jordan Cement Factory ■ Full 43.31 43.31<br />
Kenya<br />
Bamburi Cement Ltd ■ Full 40.00 28.35<br />
Korea<br />
<strong>Lafarge</strong> Buycksan Gypsum ■ Full 100.00 84.14<br />
<strong>Lafarge</strong> Halla Cement ■ Proportionate 39.90 39.90<br />
Malaysia<br />
<strong>Lafarge</strong> Braas Roofing Malaysia ■ Full 100.00 100.00<br />
Mexico<br />
California Clay Tile de Mexico ■ Equity 50.00 50.00<br />
Cemento Portland Blanco de Mexico ■ Full 100.00 98.95<br />
99
Consolidated financial statements<br />
Divisions Consolidation<br />
method and percentage<br />
as of 12/31/<strong>2000</strong><br />
Country and companies Cement Aggregates Roofing Gypsum Speciality Method % %<br />
Morocco<br />
& Concrete Products control interest<br />
<strong>Lafarge</strong> Maroc ■ ■ Full 50.00 51.11<br />
Netherlands<br />
Gyvlon BV ■ Full 100.00 100.00<br />
<strong>Lafarge</strong> Gips BV ■ Full 100.00 100.00<br />
<strong>Lafarge</strong> Dakproducten BV ■ Full 100.00 100.00<br />
North America<br />
<strong>Lafarge</strong> Canada ■ ■ ■ Full 54.33 54.00<br />
<strong>Lafarge</strong> Corporation ■ ■ ■ Full 54.33 54.00<br />
<strong>Lafarge</strong> Calcium Aluminates (1) Aluminates Equity 34.69 34.69<br />
Parex Inc (1) Mortars Equity 34.69 34.44<br />
Carmeuse North America Lime Equity 40.00 40.00<br />
Monier Inc ■ Full 100.00 100.00<br />
<strong>Lafarge</strong> Road Marking System Road<br />
Markings Full 100.00 100.00<br />
La Habra (1) Mortars Equity 34.69 34.69<br />
Norway<br />
Zanda AS ■ Full 100.00 100.00<br />
Philippines<br />
<strong>Lafarge</strong> Philippines ■ Full 100.00 100.00<br />
CPAC Monier ■ Proportionate 50.00 50.00<br />
Poland<br />
<strong>Lafarge</strong> Polska Spolka Akcyja ■ ■ Lime Full 77.57 76.02<br />
Braas Polska Sp z.o.o ■ Full 100.00 100.00<br />
Rupp Ceramika Polska Sp z.o.o ■ Full 100.00 100.00<br />
<strong>Lafarge</strong> Gips Polska ■ Full 100.00 100.00<br />
Romania<br />
<strong>Lafarge</strong> Romcim SA ■ ■ Lime Full 92.54 72.67<br />
Russia<br />
OAO Voskresenskcement ■ Full 83.85 83.85<br />
OOO Braas DSK 1 ■ Full 67.10 67.10<br />
South Africa<br />
<strong>Lafarge</strong> South Africa Limited ■ ■ Full 100.00 100.00<br />
<strong>Lafarge</strong> Braas Roofing South Africa ■ Full 100.00 100.00<br />
<strong>Lafarge</strong> Aluminates Southern Africa (1) Aluminates Equity 34.69 34.69<br />
Spain<br />
<strong>Lafarge</strong> Asland SA ■ ■ Full 99.62 98.95<br />
Texsa SA Mortars Full 100.00 100.00<br />
Yesos Ibericos ■ Equity 40.69 40.69<br />
Cementos Molins ■ Equity 40.91 40.48<br />
Redland Ibérica SA ■ Equity 47.00 47.00<br />
Singapour<br />
Davco Singapour (1) Mortars Equity 34.69 34.69<br />
100
Divisions Consolidation<br />
method and percentage<br />
as of 12/31/<strong>2000</strong><br />
Country an companies Cement Aggregates Roofing Gypsum Speciality Method % %<br />
Sweden<br />
& Concrete Products control interest<br />
Orebrö Kartongbruck AB<br />
<strong>Lafarge</strong> Hogänäs Eldfast AB<br />
■ Full 100.00 100.00<br />
and affiliates (1) Refractories Equity 34.69 34.69<br />
<strong>Lafarge</strong> Braas Scandinavia AB ■ Full 100.00 100.00<br />
Switzerland<br />
Cementia Trading Ltd AG ■ Full 96.72 96.72<br />
Marine Cement Ltd ■ Full 50.00 48.36<br />
Braas Schweiz AG ■ Full 100.00 100.00<br />
Taïwan<br />
<strong>Lafarge</strong> Eastern Monolithic<br />
Refractories Co Ltd Refractories Full 100.00 100.00<br />
Thaïland<br />
<strong>Lafarge</strong> Prestia Co Ltd ■ Full 99.81 99.81<br />
CPAC Roof Tiles ■ Equity 24.90 24.90<br />
Turkey<br />
<strong>Lafarge</strong> Aslan Cimento AS ■ ■ Full 96.84 95.55<br />
Agretas Agrega Insaat San.ve Tic. AS ■ ■ Full 100.00 99.58<br />
Dalsan Alçy AS ■ Proportionate 50.00 50.00<br />
<strong>Lafarge</strong> Entegre Mortars/<br />
Harç Sanayi ve Ticaret AS Lime Full 50.00 49.79<br />
Braas Cati Sistemleri Ticaret AS ■ Full 100.00 100.00<br />
Uganda<br />
Hima Cement Ltd ■ Full 100.00 34.35<br />
Venezuela<br />
Fabrica Nacional de Cementos ■ Full 61.14 60.55<br />
Cementos Catatumbo CA ■ Equity 23.32 23.32<br />
Indocunagre ■ Full 100.00 60.55<br />
Note :The percentage of interest reflects the share of equity owned by the parent company in a subsidiary, directly or indirectly.<br />
The percentage of control indicates whether the parent company has the power to govern the subsidiary. It determines the consolidation method (see note 1 page 76).<br />
(1) These companies are part of the new Materis subgroup.<br />
101
➜<br />
Consolidated financial statements<br />
A UDITORS' REPORT ON THE CONSOLIDATED<br />
FINANCIAL STATEMENTS<br />
F OR THE YEAR ENDED D ECEMBER 31, <strong>2000</strong><br />
Deloitte Touche Tohmatsu Cogerco Flipo<br />
185, avenue Charles-de-Gaulle 9 avenue Percier<br />
B.P. 136 75008 Paris<br />
92203 Neuilly-sur-Seine cedex<br />
In accordance with our appointment as auditors by your Annual General Meeting, we have audited the accompanying<br />
<strong>consolidated</strong> financial statements of <strong>Lafarge</strong> for the year ended December 31, <strong>2000</strong>, prepared in euros.<br />
The <strong>consolidated</strong> financial statements have been approved by the Board of Directors. Our role is to express an opinion<br />
on these financial statements, based on our audit.<br />
We conducted our audit in accordance with professional standards applicable in France. Those standards require that<br />
we plan and perform the audit to obtain reasonable assurance about whether the <strong>consolidated</strong> financial statements<br />
are free of material misstatement. An audit includes examining, on a test basis, evidence supporting the amounts and<br />
disclosures in the financial statements. An audit also includes assessing the accounting principles used and significant<br />
estimates made by management, as well as evaluating the overall financial statement presentation. We believe<br />
that our audit provides a reasonable basis for our opinion.<br />
In our opinion, the <strong>consolidated</strong> financial statements give a true and fair view of the financial position and the assets<br />
and liabilities of the Group as of December 31, <strong>2000</strong> and the results of its operations for the year then ended in accordance<br />
with accounting principles generally accepted in France.<br />
Without qualifying the above opinion we would draw your attention to Note 1.L.) to the <strong>consolidated</strong> financial statements<br />
for the year ended December 31, <strong>2000</strong>, disclosing the change in accounting method resulting from the application,<br />
with effect from January 1, <strong>2000</strong>, of the new regulation issued by the Accounting Regulation Committee applicable<br />
to <strong>consolidated</strong> financial statements.<br />
We also performed procedures on the information presented in the Group management report, in accordance with professional<br />
standards applicable in France. We have no comment to make as to the fair presentation of this information<br />
nor its consistency with the <strong>consolidated</strong> financial statements.<br />
Neuilly-sur-Seine and Paris, March 1, 2001<br />
The Auditors’<br />
Deloitte Touche Tohmatsu Cogerco Flipo<br />
Arnaud de Planta Jean-Paul Picard Henri Lejetté<br />
This is a free translation of the original French text for information purposes only)<br />
102