- Page 2 and 3: Sector energético Carpeta Informat
- Page 4 and 5: Índice Introducción 7 PARTE I. EL
- Page 6: 7.4. Transformaciones de la industr
- Page 10: Parte I El sector petrolero 9
- Page 14 and 15: I. Contexto La energía primaria se
- Page 16 and 17: de que en los últimos quince años
- Page 18 and 19: Secretaría de Energía: Balance Na
- Page 20 and 21: Secretaría de Energía: Balance Na
- Page 22 and 23: El consumo de energía ha aumentado
- Page 24 and 25: Prospectiva del Mercado de Petróle
- Page 26 and 27: Los principios fundamentales que ri
- Page 28 and 29: Marco regulatorio de la industria d
- Page 30 and 31: Prospectiva del mercado de petróle
- Page 32 and 33: Prospectiva del mercado de petróle
- Page 34 and 35: Prospectiva del mercado de petróle
- Page 36 and 37: Prospectiva del mercado de petróle
- Page 38 and 39: Prospectiva del mercado de petróle
- Page 40 and 41: organismos técnicos donde México
- Page 44 and 45: 7,576.6 1,270.3 3,068.3 3,238.1 2,6
- Page 46 and 47: Cabe señalar que la tasa de restit
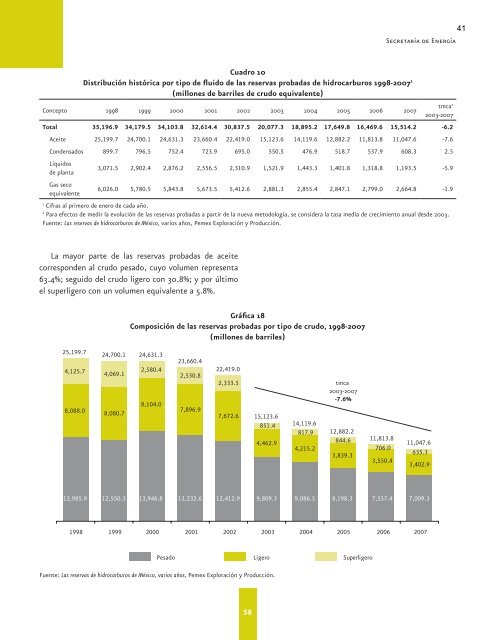
- Page 48 and 49: En lo correspondiente a la composic
- Page 50 and 51: En lo que respecta al volumen de la
- Page 52 and 53: Fuente: Sener con base en Pemex. 88
- Page 54 and 55: Gráfica 26 Composición de las res
- Page 56 and 57: Las reservas probables se componen
- Page 58 and 59: año en el que tuvo su mayor aporta
- Page 60 and 61: 3.2.1.2 Producción de la Región M
- Page 62 and 63: 700 600 500 400 300 200 100 0 Fuent
- Page 64 and 65: 100% 90% 80% 70% 60% 50% 40% 30% 20
- Page 66 and 67: 1,400 1,200 1,000 800 600 400 200 0
- Page 68 and 69: 2,000 1,800 1,600 1,400 1,200 1,000
- Page 70 and 71: Gráfica 38 Distribución porcentua
- Page 72: Cuadro 17 (continuación) Balance n
- Page 75 and 76: Resumen ejecutivo En 2006 la capaci
- Page 77 and 78: Las estrategias adoptadas por el SN
- Page 79 and 80: derivados del petróleo y los produ
- Page 81 and 82: 2.1.2.2 De fuentes móviles Ejemplo
- Page 83 and 84: • • • • • • • • •
- Page 85 and 86: Todas las referencias empleadas son
- Page 87 and 88: Mercado nacional de petrolíferos 1
- Page 89 and 90: Prospectiva de petrolíferos 2007-2
- Page 91 and 92: Prospectiva de petrolíferos 2007-2
- Page 93 and 94:
Prospectiva de petrolíferos 2007-2
- Page 95 and 96:
Prospectiva de petrolíferos 2007-2
- Page 97 and 98:
Prospectiva de petrolíferos 2007-2
- Page 99 and 100:
Prospectiva de petrolíferos 2007-2
- Page 101 and 102:
Prospectiva de petrolíferos 2007-2
- Page 103 and 104:
Prospectiva de petrolíferos 2007-2
- Page 105 and 106:
Prospectiva de petrolíferos 2007-2
- Page 107 and 108:
Prospectiva de petrolíferos 2007-2
- Page 109 and 110:
Prospectiva de petrolíferos 2007-2
- Page 111 and 112:
Prospectiva de petrolíferos 2007-2
- Page 113 and 114:
Prospectiva de petrolíferos 2007-2
- Page 115 and 116:
Prospectiva de petrolíferos 2007-2
- Page 117 and 118:
2 116
- Page 119 and 120:
PETRÓLEO HISTORIA DEL PETRÓLEO: A
- Page 121 and 122:
nistrando los productos que demanda
- Page 123 and 124:
La weltpolitik de Alemania como nue
- Page 125 and 126:
aban en la región habían firmado
- Page 127 and 128:
de que Irán cayera bajo la influen
- Page 129 and 130:
tador de petróleo. El fin de la au
- Page 131 and 132:
Canadá), aunque el coste y las dif
- Page 133 and 134:
La demanda de China y el incremento
- Page 135 and 136:
como Royal Dutch/Shell o Repsol YPF
- Page 137 and 138:
RESERvAS PROBADAS DE PETRÓLEO, 200
- Page 139 and 140:
PRODUCCIÓN DE PETRÓLEO, 1980-2005
- Page 141 and 142:
El ratio Reservas/Producción refle
- Page 143 and 144:
Finalmente, son de destacar las cap
- Page 145 and 146:
ALEMANIA 2586 3,2% GRECIA 429 0,5%
- Page 147 and 148:
Una de las alternativas exportadora
- Page 149 and 150:
COMERCIO MUNDIAL DE PETRÓLEO, 2005
- Page 151 and 152:
del gas natural de Rusia se eleva a
- Page 153 and 154:
CARBÓN DE LA REvOLUCIÓN INDUSTRIA
- Page 155 and 156:
ENERGíA NUCLEAR En el ámbito de l
- Page 157 and 158:
MODELO ENERGéTICO UNA CUESTIÓN DE
- Page 159 and 160:
72 [04] NOVIEMBRE 2006 INFORME ECON
- Page 161 and 162:
ENERGíA: HORIzONTE 2030 ■ La dem
- Page 163 and 164:
BIBLIOGRAFíA BP (2006), BP Statist
- Page 165 and 166:
164
- Page 167 and 168:
las concesiones de exploración de
- Page 169 and 170:
2.2.2. CANADÁ 3 La Constitución d
- Page 171 and 172:
-Las industrias del petróleo y gas
- Page 173 and 174:
1995 El Gobierno de Canadá vende e
- Page 175 and 176:
2.2.3. NORUEGA 6 En el sector de pe
- Page 177 and 178:
El Parlamento ha puesto un límite
- Page 179 and 180:
y para acciones directas para el Es
- Page 181 and 182:
180
- Page 183 and 184:
Disclaimer This paper was prepared
- Page 185 and 186:
the national oil company Petrobras,
- Page 187 and 188:
demand continued to grow rapidly, a
- Page 189 and 190:
dollars and indexed to a basket of
- Page 191 and 192:
expansion in supply capacity to be
- Page 193 and 194:
Africa and Brazil are in the proces
- Page 195 and 196:
1 2 3 4 5 6 7 8 9 10 11 A B C TABLE
- Page 197 and 198:
Protocol, the carbon price to Large
- Page 199 and 200:
investigating. Further development
- Page 201 and 202:
◗ Investigate the possibility of
- Page 203 and 204:
Nuclear ◗ Explore barriers for th
- Page 205 and 206:
Mtoe 400 300 200 100 1975 1980 1985
- Page 207 and 208:
Mtoe 600 500 400 300 200 100 32 Tab
- Page 209 and 210:
For most provinces, the share of ex
- Page 211 and 212:
Indian and Northern Affairs Canada
- Page 213 and 214:
On 16 December 2002, Canada ratifie
- Page 215 and 216:
All uranium production occurs in re
- Page 217 and 218:
Figure 6 OECD Automotive Diesel Pri
- Page 219 and 220:
As is the case for most of Canada
- Page 221 and 222:
areas, such as northern Canada and
- Page 223 and 224:
222
- Page 225 and 226:
ECONOMÍA INFORMA estable de invers
- Page 227 and 228:
ECONOMÍA INFORMA gresos petroleros
- Page 229 and 230:
ECONOMÍA INFORMA Los principios po
- Page 231 and 232:
ECONOMÍA INFORMA Responsabilidades
- Page 233 and 234:
ECONOMÍA INFORMA 4. Empresas en el
- Page 235 and 236:
ECONOMÍA INFORMA el sistema de tra
- Page 237 and 238:
ECONOMÍA INFORMA centros calificad
- Page 239 and 240:
6. Los retos por venir ECONOMÍA IN
- Page 241 and 242:
ECONOMÍA INFORMA • Criterios pú
- Page 243 and 244:
ECONOMÍA INFORMA • Bajas tasas d
- Page 245 and 246:
244
- Page 247 and 248:
246
- Page 249 and 250:
248
- Page 251 and 252:
2 250
- Page 253 and 254:
4 252
- Page 255 and 256:
6 254
- Page 257 and 258:
8 256
- Page 259 and 260:
10 258
- Page 261 and 262:
Las transferencias a dicho organism
- Page 263 and 264:
14 262
- Page 265 and 266:
4.4 Mercado Eléctrico Nacional 199
- Page 267 and 268:
18 266
- Page 269 and 270:
20 268
- Page 271 and 272:
22 270
- Page 273 and 274:
24 272
- Page 275 and 276:
26 274
- Page 277 and 278:
4.5 Prospectiva del Sector Eléctri
- Page 279 and 280:
30 278
- Page 281 and 282:
32 280
- Page 283 and 284:
34 282
- Page 285 and 286:
36 284
- Page 287 and 288:
38 286
- Page 289 and 290:
En el régimen del presidente Porfi
- Page 291 and 292:
“Es propósito firme de mi gobier
- Page 293 and 294:
fuentes de energía básicos, han d
- Page 295 and 296:
El 22 de diciembre de 1975 se emiti
- Page 297 and 298:
• Reformas a la Ley del Servicio
- Page 299 and 300:
VI. REGLAMENTOS REGLAMENTO DE LA LE
- Page 301 and 302:
Artículo 602. Alcance y cobertura
- Page 303 and 304:
Restricciones a la importación o a
- Page 305 and 306:
56 304
- Page 307 and 308:
• Mejorar la calidad del servicio
- Page 309 and 310:
De tal forma, se integraron dos mer
- Page 311 and 312:
mercado de venta de energía al may
- Page 313 and 314:
Estado da Bahía (COELBA) y la Comp
- Page 315 and 316:
operacionales del sistema eléctric
- Page 317 and 318:
El estudio “El Debate sobre la Re
- Page 319 and 320:
cometido es gestionar los programas
- Page 321 and 322:
eléctricas que, en términos reale
- Page 323 and 324:
todos los consumidores del territor
- Page 325 and 326:
3. Una estructura regional para la
- Page 327 and 328:
6.3 REFORMAS AL SECTOR ELÉCTRICO E
- Page 329 and 330:
servicios eléctricos del Estado. E
- Page 331 and 332:
82 330
- Page 333 and 334:
84 332
- Page 335 and 336:
86 334
- Page 337 and 338:
88 336
- Page 339 and 340:
90 338
- Page 341 and 342:
92 340
- Page 343 and 344:
94 342
- Page 345 and 346:
96 344
- Page 347 and 348:
98 346
- Page 349 and 350:
7.3 Memoria “Seminario de políti
- Page 351 and 352:
102 350
- Page 353 and 354:
104 352
- Page 355 and 356:
106 354
- Page 357 and 358:
108 356
- Page 359 and 360:
110 358
- Page 361 and 362:
112 360
- Page 363 and 364:
114 362
- Page 365 and 366:
116 364
- Page 367 and 368:
118 366
- Page 369 and 370:
120 368
- Page 371 and 372:
122 370
- Page 373 and 374:
124 372
- Page 375 and 376:
126 374
- Page 377 and 378:
128 376
- Page 379 and 380:
378
- Page 381 and 382:
380
- Page 383 and 384:
382
- Page 385 and 386:
2 Este reporte incluye los resultad
- Page 387 and 388:
4 Encuesta Telefónica Nacional GEA
- Page 389 and 390:
6 B. Características técnicas de
- Page 391 and 392:
REFORMA ENERGÉTICA (PEMEX) ¿Usted
- Page 393 and 394:
REFORMA ENERGÉTICA (PEMEX) Para us
- Page 395 and 396:
Febrero, 2008 ESCENARIOS POLÍTICOS
- Page 397 and 398:
25 Según lo que usted sabe, ¿de q
- Page 399 and 400:
27 En su opinión, ¿el hecho de qu
- Page 401 and 402:
29 Actualmente, muchos de los ingre
- Page 403 and 404:
31 En su opinión, ¿es conveniente
- Page 405 and 406:
33 ¿Está usted de acuerdo o en de
- Page 407 and 408:
35 ¿Está usted de acuerdo o en de
- Page 409 and 410:
37 El reto que enfrenta PEMEX para
- Page 411 and 412:
39 Tomando en cuenta lo anterior,
- Page 413 and 414:
41 B. Características técnicas de
- Page 415 and 416:
43 4b. Pregunta sobre aprobación:
- Page 417 and 418:
45 Control de calidad: Para el cont
- Page 419 and 420:
418
- Page 421 and 422:
420
- Page 423 and 424:
422
- Page 425 and 426:
424
- Page 427 and 428:
426
- Page 429 and 430:
candidatos registrados van a votar
- Page 431 and 432:
modernización de la flota petroler
- Page 433 and 434:
Años después, Álvaro Obregón fi
- Page 435 and 436:
desinformación que se repite sin c
- Page 437 and 438:
capital privado, hoy reservadas al
- Page 439 and 440:
con su característica de mercado d
- Page 441 and 442:
Uno de esos componentes es haber lo
- Page 443 and 444:
PEMEX, a pesar de la corrupción y
- Page 445 and 446:
de la explotación del gas y del pe
- Page 447 and 448:
Calderón y sus aliados no dicen qu
- Page 449 and 450:
El sector petrolero requiere de una
- Page 451 and 452:
constitucional "para no resucitar a
- Page 453 and 454:
¿Dónde quedó, dónde queda el re
- Page 455 and 456:
La apertura de la economía, sin un
- Page 457 and 458:
costo de la campaña, podría ocurr
- Page 459 and 460:
siniestra permisos para los product
- Page 461 and 462:
La factibilidad de explotar comerci
- Page 463 and 464:
En rigor, el problema público que
- Page 465 and 466:
Cuatro de los últimos cinco gobier
- Page 467 and 468:
eciben 3.9 millones de pesos anuale
- Page 469:
468