NÃQUEL - Instituto Geológico y Minero de España
NÃQUEL - Instituto Geológico y Minero de España
NÃQUEL - Instituto Geológico y Minero de España

You also want an ePaper? Increase the reach of your titles
YUMPU automatically turns print PDFs into web optimized ePapers that Google loves.
metal bruto aleado el 3 y 4,2% y el no aleado el 2,5 y 3,2%, repartiéndose el 4,2 y 3,6% restantes entre<br />
los <strong>de</strong>más productos. Los concentrados se dirigieron mayoritariamente a China (83 516,6 t) y Canadá<br />
(10 000 t), más 19,8 t a Francia, Portugal y Polonia, y las chatarras <strong>de</strong> acero inoxidable, a Francia<br />
(33,4%), China (23,4%), Países Bajos (18,5%), Italia (10,5%), Alemania (5,6%) y otros 15 países<br />
(8,6%).<br />
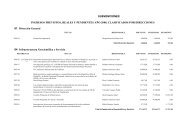
CUADRO Ni-I.- COMERCIO EXTERIOR DE MATERIAS PRIMAS MINERALES DE NIQUEL (t y 103 €)<br />
IMPORTACIONES<br />
2008 2009 2010 (p)<br />
I.- Minerales Cantidad Valor Cantidad Valor Cantidad Valor<br />
- Concentrados <strong>de</strong> Ni 1,2 30,9 5,4 42,6 4,9 43,7<br />
II.-Óxidos y sales<br />
- Óxidos e hidróxidos 150,6 1 115,7 49,8 458,0 328,8 4 159,0<br />
- Cloruros 166,9 765,9 121,8 400,4 168,4 773,9<br />
- Sulfatos 594,1 4 028,8 664,6 1 978,7 405,5 2 297,7<br />
Total 5 910,4 2 837,1 7 230,6<br />
III.- Matas y ferraleac.<br />
- Matas y speiss 22,0 434,8 – – < 0,1 0,4<br />
- Oxido sinterizado 13,3 147,1 10,8 88,7 ─ ─<br />
- Ferroníquel 68 322,1 304 911,8 43 935,7 120 199,3 47 389,0 188 023,7<br />
Total 305 493,7 120 288,0 188 024,1<br />
IV.- Metal bruto<br />
- Níquel sin alear 22 718,1 372 741,6 12 290,0 136 743,5 16 468,0 279 349,8<br />
- Níquel aleado 2 077,9 20 009,5 1 345,3 7 889,6 2 032,9 13 155,1<br />
Total 392 751,1 144 633,1 292 504,9<br />
V.- Recuperación<br />
- Chatarras <strong>de</strong> níquel 120,3 931,3 236,0 1 363,5 151,2 1 075,0<br />
- Chat. acero inoxid. * 564 596,8 399 918,1 186 144,4 114 816,9 253 848,1 288 206,8<br />
- Cenizas – – – – 5,9 0,3<br />
Total 400 849,4 116 180,4 289 282,1<br />
VI.- Metal trabajado<br />
- Polvo y partículas 101,4 2 013,8 86,1 1 478,5 115,5 2 541,2<br />
- Barras, etc, sin alear 274,9 4 375,0 25,5 528,3 14,1 197,2<br />
- Barras, etc, aleadas 1 231,7 37 671,5 1 089,3 43 441,4 1 310,3 31 466,1<br />
- Manuft. <strong>de</strong> Cu-Ni/Zn* 3 520,7 12 546,4 2 291,1 7 742,3 2 977,8 9 204,3<br />
Total 56 606,7 53 190,5 43 408,8<br />
TOTAL 1 161 642,2 437 171,7 820 494,2<br />
EXPORTACIONES<br />
2008 2009 2010 (p)<br />
I.- Minerales Cantidad Valor Cantidad Valor Cantidad Valor<br />
- Concentrados <strong>de</strong> Ni 103 682,5 61 081,7 102 105,3 55 203,8 93 536,4 78 578,4<br />
II.-Óxidos y sales<br />
- Óxidos e hidróxidos 0,9 26,5 1,3 34,0 11,3 214,2<br />
- Cloruros 478,2 456,2 186,6 196,1 41,7 229,1<br />
4