NÃQUEL - Instituto Geológico y Minero de España
NÃQUEL - Instituto Geológico y Minero de España
NÃQUEL - Instituto Geológico y Minero de España

Create successful ePaper yourself
Turn your PDF publications into a flip-book with our unique Google optimized e-Paper software.
NÍQUEL<br />
2010<br />
1.- PANORAMA NACIONAL<br />
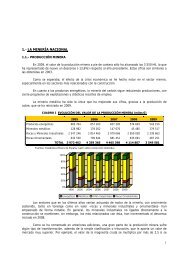
1.1- PRODUCCIÓN MINERA. PERSPECTIVAS<br />
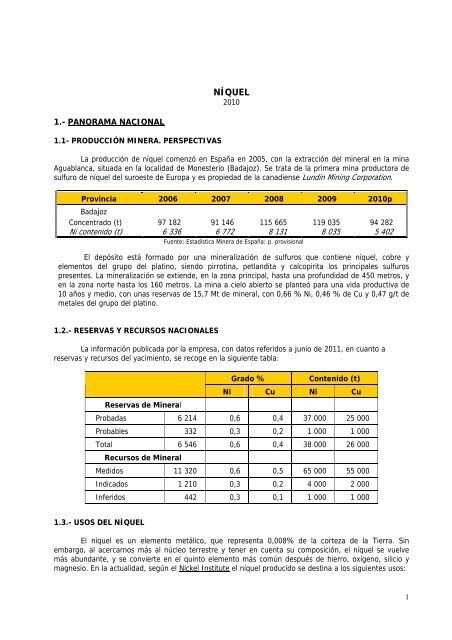
La producción <strong>de</strong> níquel comenzó en España en 2005, con la extracción <strong>de</strong>l mineral en la mina<br />
Aguablanca, situada en la localidad <strong>de</strong> Monesterio (Badajoz). Se trata <strong>de</strong> la primera mina productora <strong>de</strong><br />
sulfuro <strong>de</strong> níquel <strong>de</strong>l suroeste <strong>de</strong> Europa y es propiedad <strong>de</strong> la canadiense Lundin Mining Corporation.<br />
Provincia 2006 2007 2008 2009 2010p<br />
Badajoz<br />
Concentrado (t) 97 182 91 146 115 665 119 035 94 282<br />
Ni contenido (t) 6 336 6 772 8 131 8 035 5 402<br />
Fuente: Estadística Minera <strong>de</strong> España: p. provisional<br />
El <strong>de</strong>pósito está formado por una mineralización <strong>de</strong> sulfuros que contiene níquel, cobre y<br />
elementos <strong>de</strong>l grupo <strong>de</strong>l platino, siendo pirrotina, petlandita y calcopirita los principales sulfuros<br />
presentes. La mineralización se extien<strong>de</strong>, en la zona principal, hasta una profundidad <strong>de</strong> 450 metros, y<br />
en la zona norte hasta los 160 metros. La mina a cielo abierto se planteó para una vida productiva <strong>de</strong><br />
10 años y medio, con unas reservas <strong>de</strong> 15,7 Mt <strong>de</strong> mineral, con 0,66 % Ni, 0,46 % <strong>de</strong> Cu y 0,47 g/t <strong>de</strong><br />
metales <strong>de</strong>l grupo <strong>de</strong>l platino.<br />
1.2.- RESERVAS Y RECURSOS NACIONALES<br />
La información publicada por la empresa, con datos referidos a junio <strong>de</strong> 2011, en cuanto a<br />
reservas y recursos <strong>de</strong>l yacimiento, se recoge en la siguiente tabla:<br />
Grado %<br />
Contenido (t)<br />
Ni Cu Ni Cu<br />
Reservas <strong>de</strong> Mineral<br />
Probadas 6 214 0,6 0,4 37 000 25 000<br />
Probables 332 0,3 0,2 1 000 1 000<br />
Total 6 546 0,6 0,4 38 000 26 000<br />
Recursos <strong>de</strong> Mineral<br />
Medidos 11 320 0,6 0,5 65 000 55 000<br />
Indicados 1 210 0,3 0,2 4 000 2 000<br />
Inferidos 442 0,3 0,1 1 000 1 000<br />
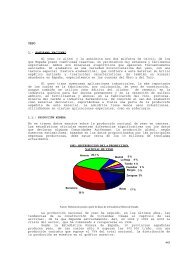
1.3.- USOS DEL NÍQUEL<br />
El níquel es un elemento metálico, que representa 0,008% <strong>de</strong> la corteza <strong>de</strong> la Tierra. Sin<br />
embargo, al acercarnos más al núcleo terrestre y tener en cuenta su composición, el níquel se vuelve<br />
más abundante, y se convierte en el quinto elemento más común <strong>de</strong>spués <strong>de</strong> hierro, oxígeno, silicio y<br />
magnesio. En la actualidad, según el Nickel Institute el níquel producido se <strong>de</strong>stina a los siguientes usos:<br />
1
Otros usos<br />
(incluidos<br />
químicos);<br />
6%;<br />
USOS FINALES DEL NÍQUEL<br />
Productos<br />
electrónicos;<br />
11%;<br />
Otras<br />
aleaciones <strong>de</strong><br />
acero; 10%;<br />
Acero<br />
inoxidable;<br />
61%;<br />
Aleaciones no<br />
férricas; 12%;<br />
La mayoría <strong>de</strong> los <strong>de</strong>pósitos económicos <strong>de</strong> níquel se dan en dos tipos <strong>de</strong> entornos geológicos:<br />
<strong>de</strong>pósitos <strong>de</strong> sulfuros magmáticos y <strong>de</strong>pósitos <strong>de</strong> lateritas. En la actualidad, las minas en explotación<br />
correspon<strong>de</strong>n por igual a ambos tipos <strong>de</strong> <strong>de</strong>pósitos, sin embargo, los <strong>de</strong> lateritas suponen alre<strong>de</strong>dor <strong>de</strong>l<br />
70 % <strong>de</strong> los recursos <strong>de</strong> níquel conocidos.<br />
Los minerales más comunes que se emplean como mena <strong>de</strong> níquel son la pentlandita (Ni,Fe) 9 S 8 y<br />
la garnierita (Ni,Mg) 6 [(OH) 8/ /Si 4 O 10 ]. La pentlandita, que contiene diferentes porcentajes <strong>de</strong> níquel y<br />
hierro, es la principal mena <strong>de</strong> níquel.<br />
1.4.- COMERCIO EXTERIOR DE MATERIAS PRIMAS MINERALES<br />
La importación <strong>de</strong> materias primas minerales <strong>de</strong> níquel aumentó en 2010 un 21,3% en metal<br />
contenido y 87,7% en valor respecto al año anterior, acusando la fuerte subida en el año <strong>de</strong> la cotización<br />
<strong>de</strong>l metal (64,2% en promedio anual). De las partidas más significativas, registraron incrementos<br />
importantes en metal contenido las compras <strong>de</strong> níquel bruto sin alear (34%), chatarras <strong>de</strong> acero<br />
inoxidable (36,4%) y semielaborados <strong>de</strong> metal aleado (73,5%), y <strong>de</strong>scenso en las <strong>de</strong> ferroníquel (–<br />
7,2%). En cuanto a la exportación, aumentó un 0,8% en metal contenido y 35,3% en valor,<br />
constatándose alzas en chatarras <strong>de</strong> acero inoxidable (21,9%), metal bruto aleado (88,2%) y<br />
semielaborados <strong>de</strong> Ni aleado (88,2%), y recortes en concentrados (–8,4%) y níquel bruto sin alear (–<br />
18,9%) (cuadros Ni-I y Ni-II). El saldo negativo <strong>de</strong> la balanza comercial <strong>de</strong> esta sustancia se duplicó<br />
(+103,5%), ascendiendo a 683,401 M€ (cuadro Ni-III), con un superávit <strong>de</strong> 78,535 M€ en concentrados<br />
y un déficit <strong>de</strong> 761,936 M€ en otras materias primas minerales.<br />
ESTRUCTURA DE LAS IMPORTACIONES (2010)<br />
Cu contenido<br />
Valor<br />
Chatarras <strong>de</strong> acero inoxidable 38,6 35,1<br />
Níquel bruto sin alear 31,3 34,0<br />
Ferroníquel 24,4 22,9<br />
Semielaborados <strong>de</strong> Ni aleado 1,7 3,8<br />
Otros 4,0 4,2<br />
Total 100,0 100,0<br />
La estructura <strong>de</strong> las importaciones, en porcentaje tanto <strong>de</strong>l metal contenido total como <strong>de</strong>l valor<br />
conjunto, ha quedado recogida en el cuadro anterior. La distribución porcentual por países <strong>de</strong> origen <strong>de</strong>l<br />
valor <strong>de</strong>l metal bruto sin alear, <strong>de</strong>l ferroníquel y <strong>de</strong> las chatarras <strong>de</strong> acero inoxidable ha quedado<br />
recogida en los gráficos siguientes. Los concentrados procedieron <strong>de</strong> Portugal (4,9 t), más unos kg <strong>de</strong><br />
2
otros tres países, y los semielaborados <strong>de</strong> níquel aleado (sin CuNi ni alpaca) se adquirieron en Japón<br />
(4%), EEUU (34,1%), Alemania (18,3%), Francia (15,8%), Reino Unido (10,3%), Italia (8%), Japón<br />
(4%) y otros (9,5%).<br />
2010 - IMPORTACION DE Ni BRUTO SIN ALEAR<br />
Australia<br />
22,7 %<br />
P. Bajos<br />
20,2 %<br />
Noruega<br />
10,5 %<br />
Canadá<br />
6,5 %<br />
Otros<br />
5,2 %<br />
Rusia<br />
44,1 %<br />
2010 - IMPORTACION DE FERRONÍQUEL<br />
27,5 % Colombia<br />
Macedonia 19,3 %<br />
Grecia<br />
10,8 %<br />
Otros<br />
1,9 %<br />
N. Caledonia<br />
40,5 %<br />
2010 - IMPORTACION DE CHATARRAS DE ACERO<br />
INOXIDABLE<br />
Alemania 10,3 %<br />
EEUU 6 %<br />
Portugal<br />
Italia<br />
P. Bajos Francia<br />
50 %<br />
4,6 %<br />
4,5 %<br />
4,4 %<br />
Otros<br />
20,2 %<br />
La posición exportadora más valiosa continuó siendo la correspondiente a los concentrados, con<br />
el 50,2% <strong>de</strong>l níquel contenido y 57,3% <strong>de</strong>l valor totales, representando las chatarras <strong>de</strong> acero inoxidable<br />
el 32,6 y 26,9%, respectivamente; los semielaborados <strong>de</strong> níquel aleado significaron el 7,5 y 4,8%, el<br />
3
metal bruto aleado el 3 y 4,2% y el no aleado el 2,5 y 3,2%, repartiéndose el 4,2 y 3,6% restantes entre<br />
los <strong>de</strong>más productos. Los concentrados se dirigieron mayoritariamente a China (83 516,6 t) y Canadá<br />
(10 000 t), más 19,8 t a Francia, Portugal y Polonia, y las chatarras <strong>de</strong> acero inoxidable, a Francia<br />
(33,4%), China (23,4%), Países Bajos (18,5%), Italia (10,5%), Alemania (5,6%) y otros 15 países<br />
(8,6%).<br />
CUADRO Ni-I.- COMERCIO EXTERIOR DE MATERIAS PRIMAS MINERALES DE NIQUEL (t y 103 €)<br />
IMPORTACIONES<br />
2008 2009 2010 (p)<br />
I.- Minerales Cantidad Valor Cantidad Valor Cantidad Valor<br />
- Concentrados <strong>de</strong> Ni 1,2 30,9 5,4 42,6 4,9 43,7<br />
II.-Óxidos y sales<br />
- Óxidos e hidróxidos 150,6 1 115,7 49,8 458,0 328,8 4 159,0<br />
- Cloruros 166,9 765,9 121,8 400,4 168,4 773,9<br />
- Sulfatos 594,1 4 028,8 664,6 1 978,7 405,5 2 297,7<br />
Total 5 910,4 2 837,1 7 230,6<br />
III.- Matas y ferraleac.<br />
- Matas y speiss 22,0 434,8 – – < 0,1 0,4<br />
- Oxido sinterizado 13,3 147,1 10,8 88,7 ─ ─<br />
- Ferroníquel 68 322,1 304 911,8 43 935,7 120 199,3 47 389,0 188 023,7<br />
Total 305 493,7 120 288,0 188 024,1<br />
IV.- Metal bruto<br />
- Níquel sin alear 22 718,1 372 741,6 12 290,0 136 743,5 16 468,0 279 349,8<br />
- Níquel aleado 2 077,9 20 009,5 1 345,3 7 889,6 2 032,9 13 155,1<br />
Total 392 751,1 144 633,1 292 504,9<br />
V.- Recuperación<br />
- Chatarras <strong>de</strong> níquel 120,3 931,3 236,0 1 363,5 151,2 1 075,0<br />
- Chat. acero inoxid. * 564 596,8 399 918,1 186 144,4 114 816,9 253 848,1 288 206,8<br />
- Cenizas – – – – 5,9 0,3<br />
Total 400 849,4 116 180,4 289 282,1<br />
VI.- Metal trabajado<br />
- Polvo y partículas 101,4 2 013,8 86,1 1 478,5 115,5 2 541,2<br />
- Barras, etc, sin alear 274,9 4 375,0 25,5 528,3 14,1 197,2<br />
- Barras, etc, aleadas 1 231,7 37 671,5 1 089,3 43 441,4 1 310,3 31 466,1<br />
- Manuft. <strong>de</strong> Cu-Ni/Zn* 3 520,7 12 546,4 2 291,1 7 742,3 2 977,8 9 204,3<br />
Total 56 606,7 53 190,5 43 408,8<br />
TOTAL 1 161 642,2 437 171,7 820 494,2<br />
EXPORTACIONES<br />
2008 2009 2010 (p)<br />
I.- Minerales Cantidad Valor Cantidad Valor Cantidad Valor<br />
- Concentrados <strong>de</strong> Ni 103 682,5 61 081,7 102 105,3 55 203,8 93 536,4 78 578,4<br />
II.-Óxidos y sales<br />
- Óxidos e hidróxidos 0,9 26,5 1,3 34,0 11,3 214,2<br />
- Cloruros 478,2 456,2 186,6 196,1 41,7 229,1<br />
4
- Sulfatos 117,1 563,3 78,0 219,4 192,5 777,0<br />
Total 1 046,0 449,5 1 220,3<br />
III.- Matas y ferraleac.<br />
- Matas y speiss 0,3 15,6 – – – –<br />
- Oxido sinterizado – – < 0,1 0,3 – –<br />
- Ferroníquel 23,8 43,8 5,2 15,4 3,6 17,4<br />
Total 59,4 15,7 17,4<br />
IV.- Metal bruto<br />
- Níquel sin alear 342,9 5 566,7 318,1 3 606,7 258,0 4 326,9<br />
- Níquel aleado 523,7 438,4 349,3 445,0 591,1 5 787,6<br />
Total 6 005,1 4 051,7 10 114,5<br />
V.- Recuperación<br />
- Chatarras <strong>de</strong> níquel 226,3 1 764,7 875,3 8 983,1 366,0 2 449,5<br />
- Chat. acero inoxid. * 36 817,3 35 957,6 34 852,1 27 335,9 42 504,1 36 904,1<br />
- Cenizas 140,0 98,4 2,8 7,7 29,1 159,9<br />
Total 37 820,7 36 326,7 39 513,5<br />
VI.- Metal trabajado<br />
- Polvo y partículas 8,6 93,0 11,8 108,5 10,1 86,9<br />
- Barras, etc, sin alear 3,3 27,8 5,3 60,2 110,2 171,3<br />
- Barras, etc, aleadas 412,4 4 456,7 891,7 4 763,8 1 124,5 6 572,2<br />
- Manuft. <strong>de</strong> Cu-Ni/Zn* 695,2 2 334,4 58,8 318,7 205,3 818,4<br />
Total 6 911,9 5 251,2 7 648,8<br />
TOTAL 112 924,8 101 298,6 137 092,9<br />
Fuente: Estadística <strong>de</strong>l Comercio Exterior <strong>de</strong> España, Agencia Tributaria, Departamento <strong>de</strong> Aduanas e Impuestos Especiales<br />
* El valor consignado es proporcional al <strong>de</strong>l níquel contenido p = provisional<br />
CUADRO Ni-II.- COMERCIO EXTERIOR DE MATERIAS PRIMAS MINERALES DE NIQUEL<br />
(t Ni contenido)<br />
IMPORTACIONES<br />
PRODUCTOS 2006 2007 2008 2009 2010 (p)<br />
I.- Minerales<br />
- Concentrados <strong>de</strong> Ni 8,8 211 0,8 4,0 3<br />
II.- Oxidos y sales<br />
- Óxidos e hidróxidos 109,4 66,1 105,4 34,8 230<br />
- Cloruros y sulfatos 339,1 360,9 248,4 259,2 189<br />
Total 448,5 427 353,8 294,0 419<br />
III.- Matas y ferraleac.<br />
- Matas y speiss – < 0,1 7,7 – < 0,1<br />
- Oxido sinterizado 20,4 9,4 10,0 8,1 –<br />
- Ferroníquel 25 935,9 23 795,6 21 521,2 13 839,9 12 845<br />
Total 25 956,3 23 805 21 538,9 13 848,0 12 845<br />
IV.- Metal bruto<br />
- Níquel sin alear 28 654,2 22 167,8 22 718,3 12 290,0 16 468<br />
- Níquel aleado 824,6 970,2 1 058,7 586,3 822<br />
5
V.- Recuperación<br />
Total 29 478,8 23 138 23 777,0 12 876,3 17 290<br />
- Chatarras <strong>de</strong> níquel 59,4 72,0 61,0 133,2 84<br />
- Chat. acero inox. 31 147,0 36 989,0 45 168,0 14 891,0 20 308<br />
- Cenizas – – – – < 0,1<br />
Total 31 206,4 37 061 45 229,0 15 024,2 20 392<br />
VI.- Metal trabajado<br />
- Polvo y partículas 124,0 319,5 101,4 86,1 115<br />
- Barras, etc, sin alear 452,0 315,0 274,9 25,5 14<br />
- Barras, etc, aleadas 1 567,0 1 659,0 853,2 754,9 908<br />
- Manuf. <strong>de</strong> Cu-Ni / Zn 758,2 964,5 788,0 528,0 692<br />
Total 2 901,2 3 258 2 017,5 1 394,5 1 729<br />
TOTAL 90 000 87 900 92 917 43 441 52 678<br />
EXPORTACIONES<br />
PRODUCTOS 2006 2007 2008 2009 2010 (p)<br />
I.- Minerales<br />
- Concentrados <strong>de</strong> Ni 3 951,1 6 113,0 5 806,0 5 717,9 5 238<br />
II.- Oxidos y sales<br />
- Óxidos e hidróxidos 35,7 0,8 0,6 0,9 8<br />
- Cloruros y sulfatos 29,1 134,2 204,8 90,3 76<br />
Total 64,8 135,0 205,4 91,2 84<br />
III.- Matas y ferraleac.<br />
- Matas y speiss – 0,4 0,1 – –<br />
- Oxido sinterizado – – – < 0,1 –<br />
- Ferroníquel – – 7,5 1,6 2<br />
Total – 0,4 7,6 1,6 2<br />
IV.- Metal bruto<br />
- Níquel sin alear 745,8 459,1 342,9 318,1 258<br />
- Níquel aleado 223,7 160,9 223,1 175,2 323<br />
Total 969,5 620,0 566,0 493,3 581<br />
V.- Recuperación<br />
- Chatarras <strong>de</strong> níquel 335,4 76,8 126,1 602,8 176<br />
- Chat. acero inox. 1 530,0 2 884,0 2 945,2 2 788,4 3 400<br />
- Cenizas 15,2 7,2 7,0 0,8 10<br />
Total 1 880,6 2 968,0 3 078,3 3 392,0 3 586<br />
VI.- Metal trabajado<br />
- Polvo y partículas 9,2 9,9 8,6 11,8 5<br />
- Barras, etc, sin alear 3,1 10,7 3,3 5,3 110<br />
- Barras, etc, aleadas 271,9 392,8 285,8 617,9 779<br />
- Manuf. <strong>de</strong> Cu-Ni / Zn 164,3 172,6 167,0 11,0 41<br />
Total 448,5 586,0 464,7 646,0 935<br />
Fuente: Elaboración propia<br />
TOTAL 7 314,5 10 422,4 10 128 10 342 10 426<br />
6
Año<br />
CUADRO Ni-III.- BALANCE DE MATERIAS PRIMAS MINERALES<br />
SUSTANCIA: NÍQUEL (t Ni contenido)<br />
PRODUCCIÓN (t) COMERCIO EXTERIOR (t) CONSUMO<br />
Minera Recuperación Importación Exportación APARENTE (t)<br />
(P I ) (P V ) * (I)<br />
(E) (C = P I +P V +I−E)<br />
1999 − 16 400 80 403 9 479 87 324<br />
2000 − 17 000 69 734 7 678 79 056<br />
2001 − 24 300 80 844 3 587 101 557<br />
2002 − sd 79 820 2 098 sd<br />
2003 – sd 80 782 1 958 sd<br />
2004 – 29 121 78 433 2 161 105 393<br />
2005 5 320 25 435 75 287 8 885 97 157<br />
2006 6 336 31 206 90 000 7 314 120 228<br />
2007 6 772 37 061 87 900 10 422 121 311<br />
2008 8 131 45 229 92 917 10 128 136 149<br />
2009 8 035 15 024 43 441 10 342 56 158<br />
2010p 5 402 20 000 52 678 10 426 67 654<br />
* Níquel contenido en las chatarras importadas <strong>de</strong> acero inoxidable. Fuente: elaboración propia<br />
VALOR DEL Autosuficien- Autosuficien- Depen<strong>de</strong>ncia Depen<strong>de</strong>ncia<br />
Año SALDO **<br />
(10 3 €)<br />
cia primaria<br />
P I /C<br />
cia prm.+sec.<br />
(P I +P V )/C<br />
técnica<br />
(I−E)/C<br />
económica<br />
I/(C+E)<br />
1999 – 354 479,391 − 18,8 % 81,2 % 83,0 %<br />
2000 – 462 718,089 − 21,5 % 78,5 % 80,4 %<br />
2001 – 438 148,000 − 23,9 % 76,1 % 76,9 %<br />
2002 – 544 527,697 − sd sd sd<br />
2003 – 630 231,751 − sd sd sd<br />
2004 – 798 509,000 − 27,6 % 72,4 % 72,9 %<br />
2005 – 784 833,300 5,47 % 31,6 % 68,4 % 71,0 %<br />
2006 – 1 312 577,100 5,27 % 31,2 % 68,8 % 70,7 %<br />
2007 – 1 791 423,800 5,58 % 36,1 % 63,9 % 66,7 %<br />
2008 – 1 048 717,400 5,97 % 39,0 % 60,8 % 63,0%<br />
2009 – 335 873,100 14,31 % 41,0 % 58,9 % 65,0 %<br />
2010p – 683 401,300 8,0 % 37,5 % 62,5 % 67,5 %<br />
** Hasta 2000, contravalor en € <strong>de</strong>l valor en PTA corrientes al cambio fijo <strong>de</strong> 166,386 PTA/€<br />
2.- PANORAMA MUNDIAL<br />
La producción minera mundial <strong>de</strong> níquel ha <strong>de</strong>scendido <strong>de</strong> nuevo en 2009, (-10,7%), para<br />
situarse en poco más <strong>de</strong> 1,4 millones <strong>de</strong> toneladas <strong>de</strong> níquel contenido. En cuanto al obtenido en planta<br />
7
–fundido, refinado, etc.- la producción, en <strong>de</strong>scenso <strong>de</strong>s<strong>de</strong> 2007, disminuyó un 3,4 % durante 2009,<br />
situándose en 1 347kt.<br />
2.1.- PRODUCCIÓN MINERA<br />
Entre los mayores productores a nivel mundial, Rusia (19 %) se mantiene como lí<strong>de</strong>r, seguido<br />
por Indonesia (14 %), Australia (12 %), Filipinas (9%) y Canadá (9%).<br />
En la tabla adjunta se <strong>de</strong>sglosa, por países, la producción minera mundial <strong>de</strong> níquel en el periodo<br />
2005-2009.<br />
PRODUCCIÓN MINERA DE NÍQUEL (t <strong>de</strong> Ni contenido)<br />
2005 2006 2007 2008 2009<br />
Grecia 20 400 21 700 21 200 18 600 9 600<br />
España 5 320 6 400 6 630 8 131 8 035<br />
Finlandia 3 400 3 000 3 600 6 200 1 600<br />
Subtotal UE 29 120 31 100 31 430 32 931 19 235<br />
Cuba 73 800 73 400 73 900 67 300 65 000<br />
Colombia 89 000 94 100 100 500 77 000 72 000<br />
Brasil 74 198 82 492 58 317 67 116 67 000<br />
Rep. Dominicana 28 298 29 675 29 100 18 800 --<br />
Venezuela 18 500 18 200 17 200 11 900 11 400<br />
Subt. Iberoamérica 299 698 297 867 279 017 233 500 215 400<br />
Rusia 315 000 320 000 279 800 266 800 261 900<br />
Australia 189 000 185 000 184 000 200 000 166 000<br />
Canadá 198 369 233 461 254 915 259 651 136 594<br />
Nueva Caledonia 111 939 102 986 125 364 102 583 92 570<br />
Indonesia 150 000 150 000 201 400 219 300 202 800<br />
China 72 700 82 100 66 400 79 500 81 100<br />
Sudáfrica 42 497 41 599 37 877 31 700 34 610<br />
Filipinas 22 560 64 705 91 367 80 645 137 350<br />
Botswana 28 212 26 762 22 844 28 940 29 616<br />
Zimbabwe 7 799 8 825 8 582 6 364 4 858<br />
Turquía 700 1 900 1 700 -- 11 300<br />
Noruega 342 320 378 377 336<br />
TOTAL (redond.) 1 430 000 1 530 000 1 600 000 1 581 000 1 412 000<br />
Fuentes: World Mineral Statistics 2005 – 2009 BGS; e = estimado, -- = cero.<br />
La producción europea, que apenas supone el 1,4 % <strong>de</strong>l total mundial, se ha reducido un 42 %<br />
en el último año, por las consi<strong>de</strong>rables caídas en la producción <strong>de</strong> Grecia y Finlandia.<br />
La cída <strong>de</strong> la producción ha sido generalizada, <strong>de</strong>bido en parte a la crisis económica global y al<br />
<strong>de</strong>scenso generalizado <strong>de</strong>l uso <strong>de</strong> níquel primario, lo que llevó a una bajada improtante <strong>de</strong> los precios. La<br />
disminución más <strong>de</strong>stacada ha correspondido a Canadá. Por el contrario, Filipinas incrementó un 71 % su<br />
8
producción al alcanzar las 137 kt y posicionarse notablemente por encima <strong>de</strong> China, que se mantiene en<br />
torno a las 80 kt/año. Otro país que ha visto aumentar su producción <strong>de</strong> forma notable ha sido Turquía.<br />
European Nickel PLC. con se<strong>de</strong> en Reino Unido, a través <strong>de</strong> sus explotaciones <strong>de</strong> níquel en The<br />
Çaldag Mine en Turquía, The Devolli-Koko en Albania y en The Acoje Deposit y The Berong Mine en<br />
Filipinas, produce 50 000 t/año.<br />
Durante el año 2009, el grupo francés ERAMET continuó posicionado como uno <strong>de</strong> los principales<br />
productores <strong>de</strong> níquel <strong>de</strong> sus <strong>de</strong>pósitos <strong>de</strong> Nueva Caledonia.<br />
Por otra parte, Xstrata Plc (Zug, Suiza) es otra <strong>de</strong> las principales empresas productoras <strong>de</strong> níquel;<br />
es propietaria <strong>de</strong> las reservas <strong>de</strong> las australianas Cosmos y Sinclair, las canadienses Raglan, Faser<br />
Morgan y Sudbury, Araguaia (Brasil), así como el 85,3 % <strong>de</strong> Falcondo (Bonao, República Dominicana),<br />
50% <strong>de</strong> Kabanga (Tanzania) y el 49% <strong>de</strong> Koniambo (Nueva Caledonia).<br />
En Finlandia, durante 2009, en el yacimiento Hitura Nickel Mine, que explota Belve<strong>de</strong>re<br />
Resources Limited (Canadá), se estimaron unas reservas totales <strong>de</strong> mineral <strong>de</strong> 1 322 kt, con una ley<br />
media <strong>de</strong> 0,67 % <strong>de</strong> níquel y 0,24 % <strong>de</strong> cobre.<br />
La griega General Mining and Metallurgical Company (LARCO) que produce níquel en las<br />
explotaciones <strong>de</strong> Kastoria, Neo Kokkino y Euobea, posee una planta en Larymna capaz <strong>de</strong> procesar 2 500<br />
kt/año <strong>de</strong> lateritas, cuyo equivalente final es <strong>de</strong> 19 000 t/año <strong>de</strong> ferroníquel.<br />
El lí<strong>de</strong>r mundial en la producción <strong>de</strong> níquel, MMC Norilsk Nickel (Moscú, Rusia) estimó, a<br />
principios <strong>de</strong> 2010, que las reservas probadas y probables <strong>de</strong> las penínsulas <strong>de</strong> Taimyr y Kola contienen<br />
aproximadamente 5,8 millones <strong>de</strong> toneladas <strong>de</strong> níquel y 8,7 millones <strong>de</strong> toneladas <strong>de</strong> cobre. La compañía<br />
rusa, <strong>de</strong>cidió, <strong>de</strong>bido a las bajadas en el precio <strong>de</strong>l níquel, cancelar la explotación <strong>de</strong> los <strong>de</strong>pósitos Emily<br />
Ann y Maggie Hays (Lake Johnston, Australia) que habían estado en operación <strong>de</strong>s<strong>de</strong> 2001.<br />
BHP Billiton (Melbourne, Australia), que produce níquel en las explotaciones <strong>de</strong> Cerro Matoso<br />
(México) y en Nickel West Mt Keith (Australia), en 2009 se vio obligada a cerrar su mina Ravensthorpe<br />
Nickel Mine (Ravensthorpe, Australia). La también australiana Minara Resources Limited (Perth, Australia)<br />
incrementó su producción en la mina Murrin Murrin (Laverton, Australia) un 7,5% alcanzando las<br />
32 977t.<br />
PRODUCCIÓN DE NÍQUEL FUNDIDO/REFINADO (t)<br />
2005 2006 2007 2008 2009<br />
Finlandia 39 159 47 469 55 000 51 963 40 800<br />
Reino Unido 37 100 36 800 34 050 40 800 17 800<br />
Grecia 19 235 17 700 18 668 16 640 8 269<br />
Francia 12 684 13 700 14 800 13 700 13 900<br />
Austria 400 1 000 900 500 700<br />
Subtotal UE 108 578 116 669 123 418 123 603 81 469<br />
Cuba 39 100 42 000 41 500 35 600 33 000<br />
Colombia 52 749 51 137 49 312 41 638 51 802<br />
Brasil 36 315 36 569 34 954 36 000 32 800<br />
Rep. Dominicana 28 668 29 675 29 130 18 782 --<br />
Venezuela 18 500 18 200 17 200 11 900 11 400<br />
Subt. Iberoamérica 168 378 174 681 172 096 143 920 129 002<br />
9
Rusia 273 700 278 600 269 800 261 500 255 500<br />
Japón 163 243 149 954 161 200 156 500 143 500<br />
Canadá 139 683 146 899 153 647 167 732 116 909<br />
Australia 121 000 116 000 114 000 108 000 150 000<br />
Noruega 84 886 82 257 87 600 88 700 88 577<br />
China 97 800 136 600 199 300 200 300 253 800<br />
Nueva Caledonia 46 738 48 723 44 954 37 467 38 230<br />
Sudáfrica 42 392 41 600 37 900 31 700 34 400<br />
Zimbabwe 15 900 13 200 14 000 11 300 9 200<br />
Ucrania 13 000 15 900 20 600 24 700 15 800<br />
Indonesia 7 300 14 474 18 532 17 566 12 550<br />
Macedonia 8 141 10 942 15 000 15 000 12 000<br />
Kosovo -- -- -- 5 777 6 365<br />
TOTAL (redond.) 1 295 000 1 346 000 1 432 000 1 394 000 1 347 000<br />
Fuentes: World Mineral Statistics 2005 – 2009 BGS<br />
Se incluye el níquel refinado, el contenido en las aleaciones <strong>de</strong> ferro-níquel, los óxidos y las sales<br />
La producción <strong>de</strong> níquel fundido/refinado se encuentra en la actualidad en constante <strong>de</strong>sarrollo<br />
puesto que si bien se <strong>de</strong>be tratar el mineral una vez explotado, se contempla, <strong>de</strong> una manera cada vez<br />
más habitual la opción <strong>de</strong>l reciclaje. Empresas expertas en esta actividad son la estadouni<strong>de</strong>nse THE<br />
INTERNATIONAL METALS RECLAMATION COMPANY, INC. (INMETCO), filial <strong>de</strong> Horsehead Holding Corp.<br />
y ELG Haniel Metals Ltd filial <strong>de</strong> ELG Haniel Group (Reino Unido), que aunque se <strong>de</strong>dican unicamente al<br />
reciclaje <strong>de</strong> diversos materiales forman parte <strong>de</strong>l Nickel Institute.<br />
Otros organismos u organizaciones que también están presentes en el Nickel Institute son,<br />
Automotive Recyclers Association, Bureau of International Recycling, Global Recycling Network, Institute<br />
of Scrap Recycling Industries Inc. (ISRI), Metal World, Rechargeable Battery Recycling Corporation<br />
(RBRC), Recycler's World y American Steel Recycling Institute, lo que permite apreciar la importancia <strong>de</strong><br />
este sector.<br />
En diciembre <strong>de</strong> 2009 First Quantum Minerals Ltd. (Vancouver, Canadá) compró Ravensthorpe<br />
Nickel Mine por 340 millones <strong>de</strong> dólares a BHP Billiton.<br />
Gladstone Pacific Nickel Limited (GPNL) consiguió, en 2009, los permisos necesarios para<br />
continuar avanzando en el proyecto Gladstone State Development Area (GSDA), en Central Queesland<br />
(Australia), lo que supone la construcción <strong>de</strong> la mayor refinería mundial <strong>de</strong> níquel, capaz <strong>de</strong> refinar 5 000<br />
t <strong>de</strong> cobalto y 63 000t <strong>de</strong> níquel al año.<br />
2.4.- LOS PRECIOS<br />
El primer cuatrimestre <strong>de</strong> 2010 registró una tímida recuperación en su primera mitad y más<br />
enérgica en la segunda (26 014,75 $/t <strong>de</strong> media mensual en abril), siguiendo un nuevo bimestre <strong>de</strong><br />
recortes (19 377,73 $/t en junio), tras el que se implantó un nuevo ciclo alcista, que perduró hasta<br />
febrero <strong>de</strong> 2011 (28 246,75 $/t). La ganancia diciembre <strong>de</strong> 2009-diciembre <strong>de</strong> 2010 supuso 7 048,33 $/t,<br />
con un valor medio en el último año <strong>de</strong> 21 789,34 $/t, superior en un 48,5% al valor medio anual<br />
conseguido en 2009.<br />
10
COTIZACION MENSUAL DEL NÍQUEL $/t cash (LME)<br />
30.000<br />
28.000<br />
26.000<br />
24.000<br />
22.000<br />
20.000<br />
$<br />
18.000<br />
16.000<br />
14.000<br />
12.000<br />
10.000<br />
8.000<br />
My Db En Jn<br />
DbEn<br />
My<br />
Sep<br />
2009 2010<br />
2011<br />
COTIZACION DEL NÍQUEL (LME)<br />
40000<br />
35000<br />
30000<br />
25000<br />
$ 20000<br />
15000<br />
10000<br />
5000<br />
0<br />
2001 2002 2003 2004 2005 2006 2007 2008 2009 2010 2011<br />
$/t, cash<br />
2004 2005 2006 2007 2008 2009 2010 2011*<br />
$/t, cash 13 823,24 14 733,06 24 233,31 37 183,83 20 946,61 14 674,21 21 789,34 23 776,55<br />
* Ocho primeros meses<br />
11
Como se citó anteriormente, el níquel producido, está mayoritariamente <strong>de</strong>stinado a la<br />
producción <strong>de</strong> acero inoxidable. Según International Stainless Steel Forum (ISSF) la evolución <strong>de</strong> la<br />
producción mundial <strong>de</strong> acero inoxidable en los últimos años ha sido la siguiente:<br />
2003 2004 2005 2006 2007 2008 2009 2010<br />
Oeste <strong>de</strong> Europa y<br />
África 9 043 9 422 8 823 9 972 8 669 8 272 6 449 7 871<br />
Europa <strong>de</strong>l Central<br />
y <strong>de</strong>l Este 322 318 310 363 364 333 237 340<br />
América 2 830 2 933 2 688 2 951 2 604 2 315 1 958 2 609<br />
Asia 10 645 11 897 12 498 15 074 16 200 8 068 7 130 8 611<br />
China sd sd sd sd sd 6 943 8 805 11 256<br />
Total mundial (kt) 22 840 24 570 24 319 28 359 27 836 25 930 24 578 30 687<br />
Durante los últimos años, en la cotización <strong>de</strong>l níquel se han producido oscilaciones similares a las<br />
sufridas en la fabricación <strong>de</strong>l acero inoxidable, <strong>de</strong>bidas principalmente a la incertidumbre por la situación<br />
económica mundial. A continuación se muestra una comparativa entre el precio <strong>de</strong>l níquel y la producción<br />
<strong>de</strong> esta aleación.<br />
35.000<br />
40.000<br />
30.000<br />
35.000<br />
25.000<br />
20.000<br />
kt<br />
15.000<br />
10.000<br />
5.000<br />
30.000<br />
25.000<br />
20.000 $<br />
15.000<br />
10.000<br />
5.000<br />
0<br />
2002 2003 2004 2005 2006 2007 2008 2009 2010<br />
0<br />
Producción mundial <strong>de</strong> acero inoxidable (kt)<br />
Ni $/t cash<br />
Si se tiene en cuenta que los datos <strong>de</strong> ISSF reflejan la producción <strong>de</strong> China <strong>de</strong> forma<br />
in<strong>de</strong>pendiente a partir <strong>de</strong>l año 2007 y los meses <strong>de</strong> diferencia entre el proceso <strong>de</strong> explotación y <strong>de</strong> uso<br />
<strong>de</strong>l níquel para la fabricación <strong>de</strong> acero, se observa como ambos indicadores se han comportado <strong>de</strong> forma<br />
paralela.<br />
12