Documento de Registro de Unicaja Banco
Documento de Registro de Unicaja Banco
Documento de Registro de Unicaja Banco

You also want an ePaper? Increase the reach of your titles
YUMPU automatically turns print PDFs into web optimized ePapers that Google loves.
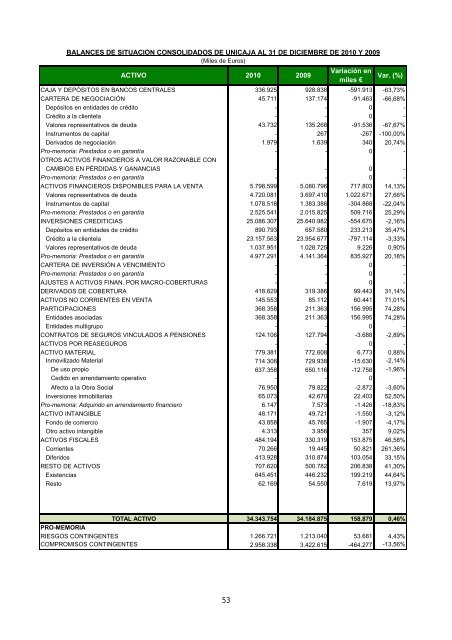
BALANCES DE SITUACIÓN CONSOLIDADOS DE UNICAJA AL 31 DE DICIEMBRE DE 2010 Y 2009<br />
(Miles <strong>de</strong> Euros)<br />
ACTIVO 2010 2009<br />
Variación en<br />
miles €<br />
Var. (%)<br />
CAJA Y DEPÓSITOS EN BANCOS CENTRALES 336.925 928.838 -591.913 -63,73%<br />
CARTERA DE NEGOCIACIÓN 45.711 137.174 -91.463 -66,68%<br />
Depósitos en entida<strong>de</strong>s <strong>de</strong> crédito - - 0 -<br />
Crédito a la clientela - - 0 -<br />
Valores representativos <strong>de</strong> <strong>de</strong>uda 43.732 135.268 -91.536 -67,67%<br />
Instrumentos <strong>de</strong> capital - 267 -267 -100,00%<br />
Derivados <strong>de</strong> negociación 1.979 1.639 340 20,74%<br />
Pro-memoria: Prestados o en garantía - - 0 -<br />
OTROS ACTIVOS FINANCIEROS A VALOR RAZONABLE CON<br />
CAMBIOS EN PÉRDIDAS Y GANANCIAS - - 0 -<br />
Pro-memoria: Prestados o en garantía - - 0 -<br />
ACTIVOS FINANCIEROS DISPONIBLES PARA LA VENTA 5.798.599 5.080.796 717.803 14,13%<br />
Valores representativos <strong>de</strong> <strong>de</strong>uda 4.720.081 3.697.410 1.022.671 27,66%<br />
Instrumentos <strong>de</strong> capital 1.078.518 1.383.386 -304.868 -22,04%<br />
Pro-memoria: Prestados o en garantía 2.525.541 2.015.825 509.716 25,29%<br />
INVERSIONES CREDITICIAS 25.086.307 25.640.982 -554.675 -2,16%<br />
Depósitos en entida<strong>de</strong>s <strong>de</strong> crédito 890.793 657.580 233.213 35,47%<br />
Crédito a la clientela 23.157.563 23.954.677 -797.114 -3,33%<br />
Valores representativos <strong>de</strong> <strong>de</strong>uda 1.037.951 1.028.725 9.226 0,90%<br />
Pro-memoria: Prestados o en garantía 4.977.291 4.141.364 835.927 20,18%<br />
CARTERA DE INVERSIÓN A VENCIMIENTO - - 0 -<br />
Pro-memoria: Prestados o en garantía - - 0 -<br />
AJUSTES A ACTIVOS FINAN. POR MACRO-COBERTURAS - - 0 -<br />
DERIVADOS DE COBERTURA 418.829 319.386 99.443 31,14%<br />
ACTIVOS NO CORRIENTES EN VENTA 145.553 85.112 60.441 71,01%<br />
PARTICIPACIONES 368.358 211.363 156.995 74,28%<br />
Entida<strong>de</strong>s asociadas 368.358 211.363 156.995 74,28%<br />
Entida<strong>de</strong>s multigrupo - - 0 -<br />
CONTRATOS DE SEGUROS VINCULADOS A PENSIONES 124.106 127.794 -3.688 -2,89%<br />
ACTIVOS POR REASEGUROS - - 0 -<br />
ACTIVO MATERIAL 779.381 772.608 6.773 0,88%<br />
Inmovilizado Material 714.308 729.938 -15.630 -2,14%<br />
De uso propio 637.358 650.116 -12.758 -1,96%<br />
Cedido en arrendamiento operativo - - 0 -<br />
Afecto a la Obra Social 76.950 79.822 -2.872 -3,60%<br />
Inversiones inmobiliarias 65.073 42.670 22.403 52,50%<br />
Pro-memoria: Adquirido en arrendamiento financiero 6.147 7.573 -1.426 -18,83%<br />
ACTIVO INTANGIBLE 48.171 49.721 -1.550 -3,12%<br />
Fondo <strong>de</strong> comercio 43.858 45.765 -1.907 -4,17%<br />
Otro activo intangible 4.313 3.956 357 9,02%<br />
ACTIVOS FISCALES 484.194 330.319 153.875 46,58%<br />
Corrientes 70.266 19.445 50.821 261,36%<br />
Diferidos 413.928 310.874 103.054 33,15%<br />
RESTO DE ACTIVOS 707.620 500.782 206.838 41,30%<br />
Existencias 645.451 446.232 199.219 44,64%<br />
Resto 62.169 54.550 7.619 13,97%<br />
TOTAL ACTIVO 34.343.754 34.184.875 158.879 0,46%<br />
PRO-MEMORIA<br />
RIESGOS CONTINGENTES 1.266.721 1.213.040 53.681 4,43%<br />
COMPROMISOS CONTINGENTES 2.958.338 3.422.615 -464.277 -13,56%<br />
53