metodologÃa del análisis de la situación de salud - Instituto Nacional ...
metodologÃa del análisis de la situación de salud - Instituto Nacional ...
metodologÃa del análisis de la situación de salud - Instituto Nacional ...

You also want an ePaper? Increase the reach of your titles
YUMPU automatically turns print PDFs into web optimized ePapers that Google loves.
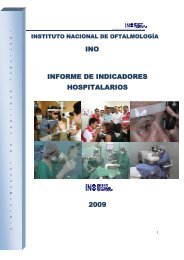
Análisis <strong>de</strong> situación <strong>de</strong> Salud ASIS 2011<br />
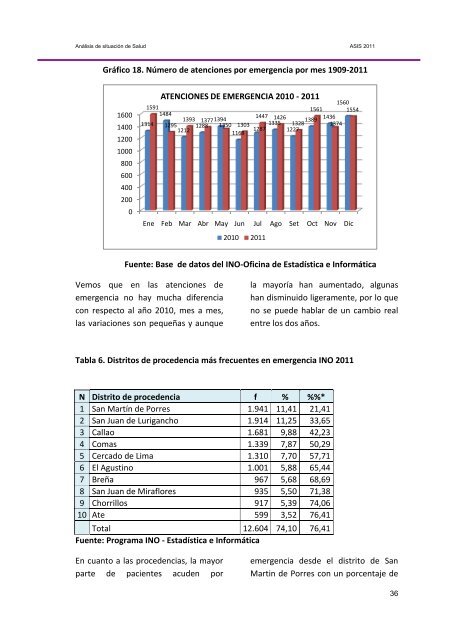
Gráfico 18. Número <strong>de</strong> atenciones por emergencia por mes 1909-2011<br />
1600<br />
1400<br />
1200<br />
1000<br />
800<br />
600<br />
400<br />
200<br />
0<br />
ATENCIONES DE EMERGENCIA 2010 - 2011<br />
1560<br />
1591<br />
1561 1554<br />
1484<br />
1394<br />
1314<br />
1212 1288 1287 1335 1389 1436<br />
1295 1393 1447<br />
1377<br />
1426<br />
1350 1303 1328 1374<br />
1227<br />
1168<br />
Ene Feb Mar Abr May Jun Jul Ago Set Oct Nov Dic<br />
2010 2011<br />
Fuente: Base <strong>de</strong> datos <strong><strong>de</strong>l</strong> INO-Oficina <strong>de</strong> Estadística e Informática<br />
Vemos que en <strong>la</strong>s atenciones <strong>de</strong><br />
emergencia no hay mucha diferencia<br />
con respecto al año 2010, mes a mes,<br />
<strong>la</strong>s variaciones son pequeñas y aunque<br />
<strong>la</strong> mayoría han aumentado, algunas<br />
han disminuido ligeramente, por lo que<br />
no se pue<strong>de</strong> hab<strong>la</strong>r <strong>de</strong> un cambio real<br />
entre los dos años.<br />
Tab<strong>la</strong> 6. Distritos <strong>de</strong> proce<strong>de</strong>ncia más frecuentes en emergencia INO 2011<br />
N Distrito <strong>de</strong> proce<strong>de</strong>ncia f % %%*<br />
1 San Martín <strong>de</strong> Porres 1.941 11,41 21,41<br />
2 San Juan <strong>de</strong> Lurigancho 1.914 11,25 33,65<br />
3 Cal<strong>la</strong>o 1.681 9,88 42,23<br />
4 Comas 1.339 7,87 50,29<br />
5 Cercado <strong>de</strong> Lima 1.310 7,70 57,71<br />
6 El Agustino 1.001 5,88 65,44<br />
7 Breña 967 5,68 68,69<br />
8 San Juan <strong>de</strong> Miraflores 935 5,50 71,38<br />
9 Chorrillos 917 5,39 74,06<br />
10 Ate 599 3,52 76,41<br />
Total 12.604 74,10 76,41<br />
Fuente: Programa INO - Estadística e Informática<br />
En cuanto a <strong>la</strong>s proce<strong>de</strong>ncias, <strong>la</strong> mayor<br />
parte <strong>de</strong> pacientes acu<strong>de</strong>n por<br />
emergencia <strong>de</strong>s<strong>de</strong> el distrito <strong>de</strong> San<br />
Martin <strong>de</strong> Porres con un porcentaje <strong>de</strong><br />
36