0.0 Portada tesis_mayo - Instituto de Ecología - UNAM
0.0 Portada tesis_mayo - Instituto de Ecología - UNAM
0.0 Portada tesis_mayo - Instituto de Ecología - UNAM

Create successful ePaper yourself
Turn your PDF publications into a flip-book with our unique Google optimized e-Paper software.
UNIVERSIDAD NACIONAL AUTÓNOMA DE MÉXICO<br />
DOCTORADO EN CIENCIAS BIOMÉDICAS<br />
INSTITUTO DE ECOLOGÍA<br />
Papel <strong>de</strong> la transferencia horizontal, recombinación y<br />
selección natural en la dinámica evolutiva <strong>de</strong>l genoma <strong>de</strong><br />
bacterias entéricas silvestres y patógenas<br />
TESIS<br />
QUE PARA OBTENER EL GRADO DE:<br />
DOCTORA EN CIENCIAS<br />
P R E S E N T A:<br />
ANDREA GONZÁLEZ GONZÁLEZ<br />
DIRECTORA DE TESIS:<br />
DRA. VALERIA SOUZA SALDÍVAR, <strong>Instituto</strong> <strong>de</strong> <strong>Ecología</strong><br />
MIEMBROS DEL COMITÉ TUTOR:<br />
DR. LUIS ENRIQUE EGUIARTE FRUNS, <strong>Instituto</strong> <strong>de</strong> <strong>Ecología</strong><br />
DR. JOSÉ LUIS PUENTE GARCÍA, <strong>Instituto</strong> <strong>de</strong> Biotecnología<br />
México, D.F. Mayo 2013
Agra<strong>de</strong>cimientos y reconocimientos académicos<br />
Esta <strong>tesis</strong> <strong>de</strong> doctorado se realizó bajo la dirección <strong>de</strong> la Dra. Valeria Souza Saldívar en<br />
el <strong>de</strong>partamento <strong>de</strong> <strong>Ecología</strong> Evolutiva <strong>de</strong>l <strong>Instituto</strong> <strong>de</strong> <strong>Ecología</strong> en la Universidad<br />
Nacional Autónoma <strong>de</strong> México.<br />
Agra<strong>de</strong>zco a los miembros <strong>de</strong>l comité Tutor conformado por<br />
Dra. Valeria Souza Saldívar, <strong>Instituto</strong> <strong>de</strong> <strong>Ecología</strong>, <strong>UNAM</strong>.<br />
Dr. Luis Enrique Eguiarte Fruns, <strong>Instituto</strong> <strong>de</strong> <strong>Ecología</strong>, <strong>UNAM</strong><br />
Dr. José Luis Puente García, <strong>Instituto</strong> <strong>de</strong> Biotecnología, <strong>UNAM</strong><br />
quienes siguieron y asesoraron el <strong>de</strong>sarrollo <strong>de</strong> este proyecto <strong>de</strong> doctorado.<br />
Del <strong>Instituto</strong> <strong>de</strong> <strong>Ecología</strong>, se reconoce y agra<strong>de</strong>ce la asesoría técnica <strong>de</strong> la M. En IBB.<br />
Laura Espinosa Asuar y la Dra. Erika Aguirre Planter durante el <strong>de</strong>sarrollo <strong>de</strong> esta <strong>tesis</strong>.<br />
Asimismo se reconoce la asistencia <strong>de</strong> Silvia Barrientos por su trabajo <strong>de</strong> laboratorista.<br />
Se agra<strong>de</strong>ce y reconoce la disposición y el préstamo <strong>de</strong> las instalaciones <strong>de</strong>l Laboratorio<br />
<strong>de</strong> Genómica Bacteriana <strong>de</strong>l Departamento <strong>de</strong> Microbiología y Parasitología <strong>de</strong> la<br />
Facultad <strong>de</strong> Medicina, en la Universidad Nacional Autónoma <strong>de</strong> México por parte <strong>de</strong> la<br />
Dra. Rosario Morales para realizar los experimentos mediante los cuales se obtuvieron<br />
los datos <strong>de</strong> esta <strong>tesis</strong>. Asimismo, se agra<strong>de</strong>ce y reconoce la asesoría teórica y técnica <strong>de</strong><br />
la Maestra en Ciencias Gabriela Delgado, así como la asesoría técnica <strong>de</strong>l Biólogo José<br />
Luis Mén<strong>de</strong>z, y el apoyo <strong>de</strong> Laura Molina González por su <strong>de</strong>sempeño como<br />
laboratorista, <strong>de</strong>l Laboratorio <strong>de</strong> Genómica Bacteriana <strong>de</strong>l Departamento <strong>de</strong><br />
Microbiología y Parasitología <strong>de</strong> la Facultad <strong>de</strong> Medicina, en la Universidad Nacional<br />
Autónoma <strong>de</strong> México durante la estandarización y realización <strong>de</strong> las diversas técnicas<br />
realizadas en este proyecto. Se reconoce el apoyo experimental <strong>de</strong> la Maestra en<br />
Ciencias, Luisa Sandner Miranda también <strong>de</strong>l Laboratorio <strong>de</strong> Genómica Bacteriana <strong>de</strong>l<br />
Departamento <strong>de</strong> Microbiología y Parasitología <strong>de</strong> la Facultad <strong>de</strong> Medicina, en la<br />
Universidad Nacional Autónoma <strong>de</strong> México. Al mismo tiempo, se agra<strong>de</strong>ce y reconoce<br />
la serotipificación <strong>de</strong> algunas <strong>de</strong> las cepas analizadas en este trabajo por parte <strong>de</strong>l
Maestro en Ciencias Armando Navarro <strong>de</strong>l Departamento <strong>de</strong> Salud Pública <strong>de</strong> la<br />
Facultad <strong>de</strong> Medicina, en la Universidad Nacional Autónoma <strong>de</strong> México.<br />
De manera muy especial, se agra<strong>de</strong>ce y reconoce el constante y esmerado apoyo tanto<br />
teórico como experimental ambos brindados por Luna Sánchez Reyes a lo largo <strong>de</strong>l<br />
<strong>de</strong>sarrollo <strong>de</strong> ésta <strong>tesis</strong>.<br />
Se agra<strong>de</strong>ce y reconoce el apoyo brindado por todos los integrantes <strong>de</strong>l Laboratorio <strong>de</strong><br />
Evolución Molecular y Experimental <strong>de</strong>l <strong>Instituto</strong> <strong>de</strong> <strong>Ecología</strong>, <strong>UNAM</strong>. En particular a<br />
Jaime Gasca y Enrique Scheinvar por el apoyo en cómputo. A Eria Rebollar, Morena<br />
Avitia, Santiago Ramírez y Jorge Valdivia por las discusiones <strong>de</strong> teóricas suscitadas a lo<br />
largo <strong>de</strong>l <strong>de</strong>sarrollo <strong>de</strong> esta <strong>tesis</strong>. Asimismo, se reconoce y agra<strong>de</strong>ce la asesoría teórica<br />
<strong>de</strong> René Cerritos, Pablo Vinuesa, Olivier Tenaillon, Xavier Di<strong>de</strong>lot y Rebeca<br />
Hernán<strong>de</strong>z.<br />
Este proyecto fue apoyado por el proyecto “Evaluación <strong>de</strong> marcadores genéticos para<br />
un microarreglo diagnóstico <strong>de</strong> enfermeda<strong>de</strong>s diarréicas en el Pacífico Mexicano<br />
utilizando metagenómica”, DGPA-<strong>UNAM</strong> PAPIIT (Programa <strong>de</strong> Apoyo a Proyectos <strong>de</strong><br />
Investigación e Innovación tecnológica) IN219109. Durante mis estudios <strong>de</strong> doctorado<br />
gocé <strong>de</strong> una beca otorgada por CONACYT para la realización <strong>de</strong> esta <strong>tesis</strong>. Finalmente,<br />
agra<strong>de</strong>zco al Programa <strong>de</strong> Doctorado en Ciencias Biomédicas <strong>de</strong> la <strong>UNAM</strong> por el apoyo<br />
y oportunidad brindada para la realización <strong>de</strong> esta <strong>tesis</strong>.<br />
Esta <strong>tesis</strong> fue <strong>de</strong>fendida el 14 <strong>de</strong> <strong>mayo</strong> <strong>de</strong> 2013 ante el jurado <strong>de</strong>l examen doctoral<br />
conformado por:<br />
Presi<strong>de</strong>nte:<br />
Secretario:<br />
Vocal:<br />
Vocal:<br />
Vocal:<br />
Dr. David Romero Camarena<br />
Dra. Valeria Souza Saldívar<br />
Dr. Luis David Alcaraz Peraza<br />
Dr. Edmundo Calva Mercado<br />
Dr. Alexan<strong>de</strong>r <strong>de</strong> Luna Fors<br />
Agra<strong>de</strong>zco las sugerencias y comentarios <strong>de</strong>l jurado encargado <strong>de</strong> revisar esta <strong>tesis</strong> los<br />
cuales contribuyeron al enriquecimiento teórico <strong>de</strong> esta investigación.
Agra<strong>de</strong>cimientos personales<br />
Mi más profundo agra<strong>de</strong>cimiento a mis padres María Luisa y Santiago, a mis hermanos<br />
Abelardo y Emilio y a mi prima Cruz por acompañarme y apoyarme a lo largo <strong>de</strong> todo<br />
el tiempo que duró esta travesía.<br />
A las diferentes generaciones que han conformado al laboratorio: Martha, René, Arturo,<br />
Amanda, Aldo, Jaime, Enrique, Richard, Germán, Esmeralda, Laura, Ana, Laura,<br />
Sandra, Nuri, Luna, Eria, Morena, Santiago, Jorge, Erika, Jonás, Gaby, Christine,<br />
Silvia, Natalia. Gracias por las discusiones y la compañía, las cuales hicieron agradable<br />
y fructífera mi estancia en el laboratorio. Gracias a Valeria y a Luis por la oportunidad y<br />
la formación brindadas.<br />
A los que han compartido conmigo las diferentes etapas <strong>de</strong> este recorrido: Xitlali, Tania,<br />
Magali, Mariana, Luis Enrique, Luna, René, Alejandra, Ana, Brian, León, Rodolfo,<br />
Carlos, Alexan<strong>de</strong>r, Luis, Arturo, Gaby, José David, Mayte y las chicas <strong>de</strong> contrología,<br />
la Fundación, los chicos <strong>de</strong>l grupo. Gracias.<br />
In memoriam<br />
Irene y Francisco<br />
Y hay también el tiempo que rueda interminable…<br />
Alvaro Mutis
Indice<br />
0. Resumen/Abstract<br />
1. Introducción<br />
1.1. <strong>Ecología</strong> bacteriana ……………………………………………………….. 1<br />
1.2. Evolución bacteriana ……………………………………………………… 2<br />
1.2.1. Diversidad genética <strong>de</strong> las especies bacterianas ………………………. 3<br />
1.2.2. Mecanismos <strong>de</strong> diversificación <strong>de</strong> los genomas bacterianos ………….. 3<br />
1.2.3. Mecanismos evolutivos que actúan en las poblaciones bacterianas …... 6<br />
1.2.4. La naturaleza <strong>de</strong> las poblaciones bacterianas ………………………….. 7<br />
1.2.5. Estructura poblacional y divergencia genética ………………………… 8<br />
1.2.6. Dinámica evolutiva <strong>de</strong> especies clonales …………………………….. 12<br />
1.2.7. Dinámica evolutiva <strong>de</strong> especies recombinantes ……………………….13<br />
1.2.8. Procesos históricos y contemporáneos que actúan en las poblaciones<br />
bacterianas ……………………………………………………………………14<br />
2. Mo<strong>de</strong>lo <strong>de</strong> estudio: Escherichia coli<br />
2.1. Historia natural <strong>de</strong> E. coli ………………………………………………... 15<br />
2.2. Dinámica evolutiva <strong>de</strong> E. coli ……………………………………………. 18<br />
3. Justificación y Objetivos <strong>de</strong>l proyecto ………………………………………… 20<br />
4. Artículo 1<br />
“Agrupamiento jerárquico <strong>de</strong> la diversidad genética asociado a diferentes niveles <strong>de</strong><br />
mutación y recombinación en Escherichia coli: un estudio basado en aislados<br />
mexicanos”<br />
4.1. Resumen ……………………………………………………………………... 23<br />
4.2. Artículo en inglés ……………………………………………………………. 24
5. Artículo 2<br />
“El tamaño <strong>de</strong>l genoma en Escherichia coli no se encuentra <strong>de</strong>terminado por su<br />
historia filogenética ni por su nicho ecológico”<br />
5.1. Resumen ……………………………………………………………………....51<br />
5.2. Artículo en inglés ……………………………………………………………. 52<br />
6. Artículo 3<br />
“Dinámica evolutiva <strong>de</strong>l pangenoma <strong>de</strong> Escherichia coli y adaptación a diferentes<br />
nichos ecológicos”<br />
6.1. Resumen ………………………………………………………………………89<br />
6.2 Artículo en español …………………………………………………………….90<br />
7. Discusión y Conclusiones …………………………………………………….. 135<br />
8. Perspectivas ………………………………………………………………….. 147<br />
9. Referencias …………………………………………………………………… 149
0. Resumen<br />
Estudiar los mecanismos que diversifican y estructuran a las especies bacterianas es un<br />
tema fascinante tanto por la forma en que pue<strong>de</strong> contribuir al entendimiento <strong>de</strong> la<br />
evolución <strong>de</strong> la vida en la Tierra, como por sus implicaciones <strong>de</strong> tipo médico y<br />
biotecnológico. Debido a que E. coli es una especie que habita diferentes nichos<br />
ecológicos y presenta diversos estilos <strong>de</strong> vida, resulta ser un mo<strong>de</strong>lo apropiado para<br />
estudiar los mecanismos genéticos y ecológicos que promueven la divergencia<br />
poblacional en bacterias. En mi trabajo <strong>de</strong> <strong>tesis</strong> doctoral analicé una muestra compuesta<br />
por 128 aislados <strong>de</strong> E. coli provenientes <strong>de</strong> un amplio rango <strong>de</strong> hospe<strong>de</strong>ros tanto<br />
patógenos como comensales. Aplicando análisis clásicos <strong>de</strong> genética y genómica <strong>de</strong><br />
poblaciones, encontramos que E. coli mantiene una estructura filogenética clara a pesar<br />
<strong>de</strong> los altos niveles <strong>de</strong> recombinación homóloga encontrados. Una <strong>de</strong> las aportaciones<br />
más importantes <strong>de</strong> esta <strong>tesis</strong> es la explicación alternativa <strong>de</strong> tipo poblacional a este<br />
paradigma clonal previamente planteado. Esta propuesta poblacional sugiere que los<br />
mecanismos <strong>de</strong> diversificación (mutación puntual y recombinación homóloga) se dan <strong>de</strong><br />
manera diferencial <strong>de</strong> acuerdo a los diferentes niveles <strong>de</strong> organización en los que se<br />
agrupa la diversidad genética <strong>de</strong> esta especie. Asimismo, propongo que para E. coli, la<br />
unidad mínima <strong>de</strong> evolución son los ecotipos, los cuales al tener una asociación con un<br />
nicho ecológico <strong>de</strong>finido, promueven diferenciación <strong>de</strong> tipo simpátrica en esta especie,<br />
sin la necesidad <strong>de</strong> barreras geográficas. Es así, que gracias a esta dinámica poblacional,<br />
E. coli mantiene su estructura clonal a pesar <strong>de</strong> que ciertas unida<strong>de</strong>s evolutivas<br />
presenten niveles <strong>de</strong> recombinación altos. Por otro lado, estimaciones <strong>de</strong>l tamaño <strong>de</strong>l<br />
cromosoma <strong>de</strong> los aislados analizados en esta <strong>tesis</strong>, arrojan una gran variación en el<br />
tamaño <strong>de</strong>l cromosoma <strong>de</strong> la muestra la cual no se encuentra estructurada ni ecológica y<br />
ni filogenéticamente. Lo anterior sugiere un gran dinamismo en términos <strong>de</strong>l<br />
componente <strong>de</strong>l genoma que promueve la adaptación a nuevos nichos y estilos <strong>de</strong> vida.<br />
Finalmente, en esta <strong>tesis</strong> propongo que la evolución <strong>de</strong> un estilo <strong>de</strong> vida, en particular la<br />
patogénesis, no consiste solamente en adquirir los genes apropiados para explotar<br />
nuevos nichos por medio <strong>de</strong> transferencia horizontal, sino que la evolución <strong>de</strong>l genoma<br />
central y la regulación <strong>de</strong> la expresión génica juegan un papel importante.
0. Abstract<br />
Exploring the mechanisms driving diversification and structure in bacterial species is an<br />
outstanding topic because its health and biotechnological implications. Escherichia coli<br />
is consi<strong>de</strong>red a suitable mo<strong>de</strong>l to study the genetic and ecological mechanisms<br />
un<strong>de</strong>rlying the divergence among populations because inhabit a wi<strong>de</strong> range of<br />
ecological niches and life styles. To study the above-mentioned topics, in this thesis I<br />
analyzed a non-outbreak related host-wi<strong>de</strong> E. coli sample. Classical population genetics<br />
analysis, chromosome size estimation and population genomics analysis suggest a clear<br />
phylogenetic structure for this enteric species in spite of the high homologous<br />
recombination levels recovered. In this thesis, I propose an alternative explanation to<br />
this clonal paradigm refered as “the population explanation” consisting in the presence<br />
of differential genetic diversification mechanisms (homologous recombination and<br />
point mutation) associated to the different clustering levels of the genetic diversity<br />
harboured for this species. Thus, ecotypes are proposed as the minimum evolutionary<br />
unit because its ecological coherence promoting sympatric differentiation which occurs<br />
without the geographical separation of diverging populations. Due this population<br />
dynamics, E. coli maintains its clonal structure in spite of some evolutionary units<br />
un<strong>de</strong>rgo high homologous recombination rates. Furthermore, a wi<strong>de</strong> range variation in<br />
chromosome size was found suggesting adaptation to new ecological niches and life<br />
styles. Interestingly, this size variation is not phylogenetically nor ecologically<br />
structured. Finally, in this thesis I propose the evolution of a new life style, in particular<br />
pathogenesis, consisting in the diversification of core genome and genetic expression<br />
besi<strong>de</strong>s the acquisition of virulence genes by horizontal gene transfer.
Mecanismos <strong>de</strong> diversificación y diferenciación genética en Escherichia coli:<br />
historia filogenética y ecología.<br />
1. Introducción<br />
1.1. <strong>Ecología</strong> bacteriana<br />
La extraordinaria diversidad en las formas <strong>de</strong> vida actual y pasada es resultado <strong>de</strong> la<br />
evolución, entendida ésta como <strong>de</strong>scen<strong>de</strong>ncia con modificación a partir <strong>de</strong> un ancestro<br />
común (Futuyma, 2005). Una <strong>de</strong> estas formas <strong>de</strong> vida son las bacterias, las cuales han<br />
<strong>de</strong>sempañado un papel fundamental en la evolución climática, geológica, geoquímica y<br />
biológica <strong>de</strong> la Tierra (Xu, 2006). Una <strong>de</strong> las razones <strong>de</strong> tal importancia es su gran<br />
abundancia. Por ejemplo, se ha estimado el número <strong>de</strong> bacterias existentes sobre la<br />
Tierra en alre<strong>de</strong>dor <strong>de</strong> 5 x 10 33 (Whitman et al., 1998; Balloux, 2010), un trillón <strong>de</strong><br />
veces más que el número <strong>de</strong> estrellas en el universo o 10 trillones veces más que el<br />
número <strong>de</strong> granos <strong>de</strong> arena presentes en nuestro planeta (Balloux 2010).<br />
Otra característica sobresaliente <strong>de</strong> las bacterias es que las po<strong>de</strong>mos encontrar en<br />
cualquier nicho ecológico imaginable ya sea asociadas a un hospe<strong>de</strong>ro o en vida libre<br />
habitando los mares, <strong>de</strong>siertos, el hielo y la atmósfera (Hughes et al., 2006; Hanson et<br />
al., 2012). También se sabe que al encontrarse asociadas a otras forma <strong>de</strong> vida,<br />
establecen relaciones mutualistas (Buchnera aphidicola) o antagónicas con sus<br />
hospe<strong>de</strong>ros (como especies patógenas causantes <strong>de</strong> alguna enfermedad, por ejemplo<br />
Yersinia pestis) (Moran y Wernegreen, 2000).<br />
Actualmente es aceptado que las bacterias <strong>de</strong> vida libre al igual que los<br />
macroorganismos presentan una amplia gama <strong>de</strong> distribución o patrones biogeográficos.<br />
Así, existen bacterias que se distribuyen ampliamente (cosmopolitas) como<br />
Pseudomonas o Nitrosococcus (Cho y Tiedje, 2000; Ward y O’Mullan, 2002) o que son<br />
endémicas y altamente restringidas a <strong>de</strong>terminados hábitats como Sulfolobus y<br />
Synechococcus (Whitaker et al., 2003; Papke et al., 2003). Qué tanto se distribuyan las<br />
especies, <strong>de</strong>pen<strong>de</strong>rá tanto <strong>de</strong> contingencias históricas como <strong>de</strong> factores ambientales tales<br />
como pH, temperatura, nutrientes orgánicos e inorgánicos y barreras geográficas<br />
(Hughes et al., 2006).
2<br />
A<strong>de</strong>más <strong>de</strong> ser abundantes y tener una distribución variada, las bacterias llevan a<br />
cabo una gran diversidad <strong>de</strong> rutas metabólicas gracias a lo cual juegan un papel<br />
fundamental en los ciclos biogeoquímicos que mantienen a todos los ecosistemas <strong>de</strong>l<br />
planeta (Pace, 1997; Whitman et al., 1998; Falkowski et al., 2008). Es <strong>de</strong>cir, las<br />
reacciones químicas que llevan a la asimilación <strong>de</strong> los elementos básicos en todas las<br />
macromoléculas biológicas (H, C, N, O, S y P) se encuentran mediadas por bacterias.<br />
Asimismo, se han <strong>de</strong>scrito al momento 21 phyla bacterianos (Wu et al., 2009),<br />
más <strong>de</strong> los presentes en plantas (Margulis y Schwartz, 1988). Algunos <strong>de</strong> estos phyla y<br />
los diferentes taxa que los conforman, muestran una coherencia ecológica, es <strong>de</strong>cir, que<br />
los miembros que conforman a un taxón en particular comparten estrategias <strong>de</strong> vida<br />
generales ó rasgos que los distinguen <strong>de</strong> los miembros <strong>de</strong> otros taxa (Fierer et al., 2007;<br />
Philippot et al., 2010). Por ejemplo, el phylum α-proteobacteria es uno <strong>de</strong> los más<br />
diversos ecológicamente (Ettema y An<strong>de</strong>rsson, 2009) y se ha <strong>de</strong>tectado diferenciación <strong>de</strong><br />
nicho entre el or<strong>de</strong>n <strong>de</strong> las Rickettsiales cuyos miembros se encuentran principalmente<br />
en sistemas acuáticos y el or<strong>de</strong>n <strong>de</strong> las Rhizobiales y Burkhol<strong>de</strong>riales los que son en su<br />
<strong>mayo</strong>ría terrestres. Asimismo, esta consistencia ecológica o especialización pue<strong>de</strong><br />
encontrarse también a nivel <strong>de</strong> género (Philippot et al., 2010). Y más aún, miembros <strong>de</strong>l<br />
género Prochlorococcus (bacterias <strong>de</strong> vida libre) muestran una gran diferenciación<br />
genética entre los que habitan la superficie marina y los que habitan aguas más profundas<br />
(Rocap et al., 2003; Johnson et al., 2006).<br />
1.2. Evolución bacteriana<br />
Ahora bien, ¿cómo se explica la existencia <strong>de</strong> tantos phyla bacterianos<br />
Una <strong>de</strong> las consecuencias <strong>de</strong>l proceso evolutivo es la gran diversidad <strong>de</strong> especies<br />
y <strong>de</strong> formas <strong>de</strong> vida existentes. Este proceso se <strong>de</strong>fine como el cambio en las<br />
propieda<strong>de</strong>s <strong>de</strong> los grupos <strong>de</strong> organismos a través <strong>de</strong> las generaciones a partir <strong>de</strong> un<br />
ancestro común. Y para que llegue a darse tal cambio, es necesaria la existencia <strong>de</strong><br />
variación genética al interior <strong>de</strong> los grupos <strong>de</strong> organismos, ya que sin variación genética
3<br />
no hay evolución, no hay diversificación <strong>de</strong> los linajes ni respuesta a las diferentes<br />
condiciones ambientales (Eguiarte, 1999; Futuyma, 2005).<br />
En la siguiente sección <strong>de</strong>scribiré los mecanismos por los cuales se genera la<br />
variación genética en las especies bacterianas.<br />
1.2.1. Diversidad genética <strong>de</strong> las especies bacterianas<br />
A la fecha se sabe que la información genética <strong>de</strong> cualquier especie bacteriana se<br />
encuentra codificada en su pangenoma (Tettelin et al., 2005; Medini et al., 2005). Al<br />
comparar diferentes aislados <strong>de</strong> una misma especie se han i<strong>de</strong>ntificado tanto al genoma<br />
central como al genoma flexible. El primero, consistente <strong>de</strong> los genes comunes a todas<br />
las cepas y el segundo, conformado por los genes accesorios o específicos a cada<br />
aislado. En general, el genoma central codifica las funciones celulares esenciales y el<br />
genoma flexible, funciones que pue<strong>de</strong>n reflejar la adaptación a un nicho específico<br />
como por ejemplo, los genes <strong>de</strong> virulencia los cuales permiten explotar diversos nichos<br />
ecológicos (Figura 1) (Medini et al., 2005; Dobrindt et al., 2010; Mira et al., 2010).<br />
Estos dos componentes <strong>de</strong>l pangenoma se diversifican por medio <strong>de</strong> mutaciones<br />
puntuales, recombinación homóloga y transferencia horizontal <strong>de</strong> genes. La frecuencia<br />
<strong>de</strong> tales mecanismos genéticos en cada especie bacteriana <strong>de</strong>fine si <strong>de</strong>terminada especie<br />
presenta una poza génica muy gran<strong>de</strong> o pequeña (si presenta un pangenoma abierto o<br />
cerrado respectivamente). Esto es importante ya que en la medida en la que la poza<br />
génica sea <strong>mayo</strong>r, <strong>mayo</strong>r respuesta al cambio habrá y por en<strong>de</strong> una probabilidad más<br />
alta <strong>de</strong> cambio evolutivo. En contraste, cuando la poza génica es menor como en el caso<br />
<strong>de</strong> especies endosimbiontes (las cuales presentan genomas reducidos), la probabilidad<br />
<strong>de</strong> adquirir nuevos estilos <strong>de</strong> vida es sumamente bajo (Wernegreen, 2002).<br />
1.2.2. Mecanismos <strong>de</strong> diversificación <strong>de</strong> los genomas bacterianos<br />
Se sabe que la mutación puntual es en <strong>de</strong>finitiva la principal fuente <strong>de</strong> variación<br />
genética <strong>de</strong>bido a su naturaleza azarosa la cual origina alelos <strong>de</strong> novo (Levin, 1981;<br />
Futuyma, 2005; Hedrick, 2000). Debido a que las bacterias se reproducen asexualmente,<br />
por mucho tiempo se consi<strong>de</strong>ró a la mutación puntual como la única fuente <strong>de</strong> variación
4<br />
(Levin, 1981). Sin embargo, la <strong>de</strong>scripción <strong>de</strong> mecanismos <strong>de</strong> intercambio <strong>de</strong><br />
información genética entre bacterias <strong>de</strong> la misma o diferentes especies como la<br />
conjugación, la transducción y la transformación sugieren una fuente alternativa <strong>de</strong><br />
diversificación, la recombinación (Thomas y Nielsen, 2005; Narra y Ochman, 2006).<br />
En su modalidad <strong>de</strong> recombinación homóloga, ésta promueve la diversificación <strong>de</strong>l<br />
genoma central al favorecer la formación <strong>de</strong> nuevos haplotipos o alelos a partir <strong>de</strong> los ya<br />
existentes <strong>de</strong>bido al re-emplazamiento <strong>de</strong> pequeños segmentos <strong>de</strong>l cromosoma<br />
bacteriano por las regiones homólogas <strong>de</strong> otro aislado <strong>de</strong> la misma especie o especies<br />
muy cercanas (Figura 2a) (Spratt et al., 2001; Dobrindt et al., 2010).<br />
Por otra parte, la recombinación no homóloga o ilegítima, responsable principal<br />
<strong>de</strong> la llamada transferencia horizontal <strong>de</strong> genes (THG), es la que se encarga <strong>de</strong> la<br />
diversificación <strong>de</strong>l genoma flexible en cuanto que se adquieren genes <strong>de</strong> novo <strong>de</strong>bido a<br />
que promueve el intercambio <strong>de</strong> información genética entre individuos <strong>de</strong> diferentes<br />
especies (Figura 2b) (Gogarten et al., 2002; Lawrence y Hendrickson, 2003; Nakamura<br />
et al., 2004; Ochman y Davalos 2006).<br />
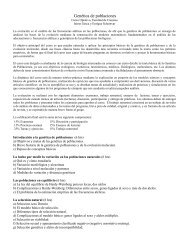
Figura 1. El pangenoma<br />
El pangenoma <strong>de</strong> una especie consiste en el conjunto total <strong>de</strong> genes presentes en una especie<br />
bacteriana. Se encuentra compuesto por el genoma central el cual consiste en los genes<br />
compartidos por todos los miembros <strong>de</strong> la especie y por el genoma flexible, el cual hace<br />
referencia a los genes presentes solamente en ciertos subgrupos o miembros <strong>de</strong> la especie. Se ha<br />
propuesto que estos genes específicos a una cepa pue<strong>de</strong>n reflejar adaptación a <strong>de</strong>terminados<br />
nichos (Garrigues et al., 2013; Polz et al., 2013).
5<br />
Asimismo, la diversificación <strong>de</strong> los genomas bacterianos pue<strong>de</strong> ser vista como el<br />
resultado <strong>de</strong> los procesos genéticos mediante los cuales se adquiere y pier<strong>de</strong><br />
información genética. Es <strong>de</strong>cir, por un lado nuevos genes son incorporados por la<br />
transferencia y duplicación <strong>de</strong> genes y por el otro, son eliminados mediante la <strong>de</strong>leción<br />
<strong>de</strong> fragmentos <strong>de</strong>l genoma y la erosión genética (Hughes, 1999; Mira et al., 2001;<br />
Di<strong>de</strong>lot et al., 2007). Estos mecanismos junto con los re-arreglos cromosómicos,<br />
promueven la evolución <strong>de</strong>l tamaño (Gevers et al., 2004; Gregory y DeSalle, 2005) y la<br />
arquitectura <strong>de</strong>l genoma en bacterias <strong>de</strong> diferentes especies (Rocha 2008; Koonin, 2009)<br />
así como la existencia <strong>de</strong> gran<strong>de</strong>s diferencias en el tamaño <strong>de</strong>l genoma aún entre<br />
aislados <strong>de</strong> la misma especie (Mira et al. 2001; Polz et al., 2013). Por ejemplo,<br />
Prochlorococcus marinus la cianobacteria marina más abundante en los océanos <strong>de</strong><br />
latitu<strong>de</strong>s medias tiene un rango en el tamaño <strong>de</strong> sus genomas que va <strong>de</strong> los 1.69 a los<br />
2.68 Mb (Kettler et al., 2007). Igualmente, el rango <strong>de</strong>l tamaño <strong>de</strong>l genoma <strong>de</strong> Yersinia<br />
pestis, enterobacteria facultativa causante <strong>de</strong> la peste bubónica es <strong>de</strong> 4.2 a 5.32 Mb<br />
(Morelli et al., 2010; Cui et al., 2013). Asimismo, mecanismos como los nombrados<br />
anteriormente, dan cuenta <strong>de</strong> la diferencia en el tamaño <strong>de</strong>l genoma que existe entre<br />
bacterias con diferentes estilos <strong>de</strong> vida (Ochman y Dávalos, 2006). En general, la<br />
ten<strong>de</strong>ncia sugiere tamaños <strong>de</strong> genoma gran<strong>de</strong>s (5-10 Mb) para las bacterias <strong>de</strong> vida<br />
libre, intermedios (2-5 Mb) para los patógenos facultativos y pequeños (0.5-1.5 Mb)<br />
para los patógenos obligados o simbiontes (Ochman y Dávalos, 2006).<br />
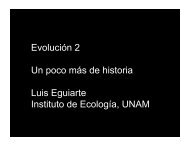
a<br />
b<br />
Figura 2. Recombinación homóloga y no homóloga<br />
a. La recombinación homóloga promueve la diversificación <strong>de</strong>l genoma central al generar<br />
nuevos alelos mosaico gracias al re-emplazamiento <strong>de</strong> pequeños segmentos entre cromosoma<br />
bacteriano homólogos. b. La recombinación no homóloga o transferencia horizontal, promueve<br />
la diversificación <strong>de</strong>l genoma flexible y se da mediante la llegada a los genomas <strong>de</strong> genes o<br />
conjunto <strong>de</strong> genes los cuales permiten la adaptación a nuevos nichos.
6<br />
1.2.3. Mecanismos evolutivos que actúan en las poblaciones bacterianas<br />
A gran<strong>de</strong>s rasgos la evolución biológica consta <strong>de</strong> dos pasos. El primero consiste en la<br />
generación <strong>de</strong> la variación genética que como, ya vimos, en el caso <strong>de</strong> las bacterias se<br />
da mediante la mutación puntual y la recombinación tanto homóloga como no<br />
homóloga. En el segundo paso, tanto la <strong>de</strong>riva génica como la selección natural se<br />
encargarán <strong>de</strong> <strong>de</strong>finir el curso <strong>de</strong> esta variación. Ambas fases <strong>de</strong>l proceso evolutivo se<br />
llevan a cabo a nivel poblacional, es <strong>de</strong>cir, los mecanismos <strong>de</strong> diversificación genética<br />
se llevan a cabo tanto al interior como entre poblaciones (Futuyma, 2005). Asimismo,<br />
tanto la <strong>de</strong>riva génica como la selección natural pue<strong>de</strong>n actuar diferencialmente al<br />
interior <strong>de</strong> las poblaciones, en unos casos fijando <strong>de</strong>terminados alelos, y en otros,<br />
eliminando o manteniendo la diversidad genética lo que a la larga promueve la<br />
divergencia <strong>de</strong> las poblaciones.<br />
El componente azaroso <strong>de</strong> la evolución correspon<strong>de</strong> a la acción <strong>de</strong> la <strong>de</strong>riva<br />
génica, la cual cambia las frecuencias alélicas en el tiempo como resultado <strong>de</strong>l muestreo<br />
(ó supervivencia) aleatorio <strong>de</strong> la variación genética que se da <strong>de</strong> generación en<br />
generación. Este proceso estocástico <strong>de</strong>pen<strong>de</strong> <strong>de</strong>l tamaño efectivo poblacional, siendo<br />
las poblaciones pequeñas las más fuertemente mol<strong>de</strong>adas por la <strong>de</strong>riva génica en<br />
comparación con las poblaciones gran<strong>de</strong>s (Hedrick, 2000).<br />
Por otro lado, se encuentra la selección natural, que a diferencia <strong>de</strong> la <strong>de</strong>riva<br />
génica, es un proceso <strong>de</strong>terminista (en términos <strong>de</strong> aumentar o al menos mantener la<br />
a<strong>de</strong>cuación <strong>de</strong> las poblaciones) el cual <strong>de</strong>scribe la supervivencia diferencial y<br />
propagación <strong>de</strong> las variantes génicas <strong>de</strong>ntro <strong>de</strong> una población.<br />
Es así que el <strong>de</strong>venir evolutivo <strong>de</strong> la variación genética <strong>de</strong> las poblaciones<br />
naturales se encuentra modulado por un componente azaroso y otro <strong>de</strong>terminista. Por<br />
ejemplo, la variación existente en genes que codifican proteínas y ARNs los cuales<br />
llevan a cabo funciones celulares básicas como metabolismo, transcripción y<br />
traducción, tien<strong>de</strong> a ser variación sinónima y generalmente neutral por lo que cualquier<br />
cambio en sus frecuencias alélicas es producto <strong>de</strong> la acción <strong>de</strong> la <strong>de</strong>riva génica<br />
(Guttman y Stavrini<strong>de</strong>s, 2010). En cambio las variantes no sinónimas generalmente<br />
resultan en formas <strong>de</strong>letéreas por lo que la probabilidad <strong>de</strong> ser eliminadas <strong>de</strong> la
7<br />
población por selección negativa o purificadora es <strong>mayo</strong>r. En contraste, es común<br />
encontrar variantes no sinónimas en genes asociados con la adaptación a algún nicho<br />
(como factores <strong>de</strong> virulencia, <strong>de</strong> colonización, <strong>de</strong> asimilación, etc.) (Chattopadhyay et<br />
al., 2009; Guttman y Stavrini<strong>de</strong>s, 2010) cuya frecuencia aumenta en las poblaciones<br />
gracias a la selección positiva. Finalmente, también es posible que la selección natural<br />
favorezca el mantenimiento <strong>de</strong> múltiples alelos al interior <strong>de</strong> las poblaciones mediante<br />
selección balanceadora o diversificadora.<br />
1.2.4. La naturaleza <strong>de</strong> las poblaciones bacterianas<br />
Consi<strong>de</strong>rando la <strong>de</strong>finición <strong>de</strong> evolución aquí expuesta, resulta relevante la siguiente<br />
pregunta: ¿Qué es una población bacteriana y más aún, ¿cómo <strong>de</strong>finimos a una<br />
población bacteriana Es bien sabido que las poblaciones bacterianas tienen la<br />
capacidad <strong>de</strong> cambiar muy rápido <strong>de</strong> tamaño, las encontramos compuestas por pocas<br />
células bacterianas o constituidas por billones <strong>de</strong> bacterias. Asimismo pue<strong>de</strong>n sufrir<br />
dramáticos cuellos <strong>de</strong> botella <strong>de</strong>bido al suministro <strong>de</strong> antibióticos o al cambio <strong>de</strong> un<br />
hospe<strong>de</strong>ro (Achtman et al., 1999; Balloux, 2010; Schierup y Wiuf, 2010).<br />
El tipo <strong>de</strong> relación que guardan las bacterias con un hospe<strong>de</strong>ro también es un<br />
factor importante que <strong>de</strong>fine al tamaño poblacional en bacterias. Por ejemplo, resulta<br />
extraordinario que el cuerpo humano sano albergue 10 14 bacterias principalmente en el<br />
tracto digestivo, cantidad que sobrepasa el número <strong>de</strong> células <strong>de</strong>l cuerpo (Berg, 1996).<br />
Tales tamaños poblacionales son gigantes aún <strong>de</strong>spués <strong>de</strong> consi<strong>de</strong>rar el hecho <strong>de</strong> que<br />
estas bacterias comensales o simbiontes pertenecen a múltiples especies diferentes.<br />
Con respecto a los patógenos oportunistas, también se esperan tamaños<br />
poblacionales inmensos al menos en especies en don<strong>de</strong> una fracción importante <strong>de</strong> las<br />
cepas son potencialmente patogénicas. Parece ser este el caso <strong>de</strong> Staphylococcus<br />
aureus, Neisseria meningitidis y Streptococcus mutans, las cuales se encuentran<br />
presentes en gran proporción en la población humana y en don<strong>de</strong> muchas cepas se<br />
vuelven patógenas por mero acci<strong>de</strong>nte (Herczegh et al., 2008; van Belkum et al., 2009).<br />
En algunos patógenos facultativos (por ejemplo, Escherichia coli) solamente una<br />
pequeña proporción <strong>de</strong> las cepas son dañinas por lo que el tamaño <strong>de</strong> la población
8<br />
infectiva se espera sea mucho más reducida comparado con la población bacteriana<br />
global. Finalmente, los tamaños poblacionales <strong>de</strong> los patógenos obligados se encuentran<br />
directamente restringidos por el número <strong>de</strong> portadores infectados y se espera sean<br />
pequeños, excepto para aquellas especies que causan enfermeda<strong>de</strong>s ampliamente<br />
diseminadas como por ejemplo, la tuberculosis (OMS, 2008).<br />
Asimismo, es importante mencionar que las bacterias son capaces <strong>de</strong> llevar a<br />
cabo activida<strong>de</strong>s coordinadas como la patogénesis o la simbiosis <strong>de</strong>bido a la<br />
comunicación intercelular que existe entre ellas lo que les permite censar la cantidad <strong>de</strong><br />
bacterias suficiente para colonizar e invadir un nuevo nicho. El lenguaje utilizado en<br />
esta comunicación intercelular también llamada “quorum sensing” se realiza mediante<br />
auto-inductores o moléculas <strong>de</strong> señalización auto-generadas las cuales permiten a las<br />
bacterias regular su comportamiento <strong>de</strong> acuerdo al número <strong>de</strong> bacterias presentes en la<br />
población (<strong>de</strong> Kievit y Iglewski, 2000).<br />
Pero una cosa es el número total <strong>de</strong> células bacterianas que se estima existen<br />
físicamente y otra, el número <strong>de</strong> células en las que realmente se llevan a cabo los<br />
procesos evolutivos, es <strong>de</strong>cir, el tamaño efectivo poblacional. Así, para que haya un<br />
cambio evolutivo se requiere <strong>de</strong> variantes genéticas “raras” que en un principio se<br />
dispersen entre los miembros “efectivos” <strong>de</strong> una población, aumentando su frecuencia<br />
<strong>de</strong> tal manera que la población llega a ser genéticamente diferente a su condición<br />
ancestral en algún momento.<br />
1.2.5. Estructura poblacional y divergencia genética<br />
Así como las especies <strong>de</strong> macroorganismos, las especies bacterianas se encuentran<br />
formadas por diferentes poblaciones, las cuales pue<strong>de</strong>n encontrarse divididas o<br />
separadas unas <strong>de</strong> las otras por barreras geográficas, ecológicas y/o temporales. Cuando<br />
esto suce<strong>de</strong>, cada una <strong>de</strong> las poblaciones pue<strong>de</strong> presentar diferentes niveles <strong>de</strong> variación<br />
genética así como diferentes proporciones <strong>de</strong> dichas variantes (diferencias en las<br />
frecuencias alélicas y genotípicas) (Hartl y Clark, 1989; Hedrick, 2000), lo que implica<br />
que las poblaciones que conforman a <strong>de</strong>terminada especie presenten cierto grado <strong>de</strong><br />
estructuración genética. Si esta estructuración poblacional es alta, con el tiempo las<br />
poblaciones divergen a tal grado que se originan nuevas especies. Sin embargo, no nada
9<br />
más la <strong>de</strong>riva génica y la selección natural mol<strong>de</strong>an la diferenciación genética <strong>de</strong> las<br />
especies, también la recombinación tanto homóloga como no homóloga mantienen<br />
cohesivos a los linajes al promover el flujo génico entre las diferentes poblaciones, al<br />
mismo tiempo que las diferencian en la medida en la que actúa la recombinación<br />
homóloga al interior <strong>de</strong> las mismas (Doolittle, 2008; Shapiro et al., 2012).<br />
No obstante, durante mucho tiempo prevaleció la i<strong>de</strong>a <strong>de</strong> que las poblaciones<br />
bacterianas eran principalmente clonales, conclusión a la que se llegó <strong>de</strong>spués <strong>de</strong> haber<br />
analizado mediante la técnica <strong>de</strong> enzimas multilocus (MLEE), muestras representativas<br />
<strong>de</strong> diferentes especies provenientes <strong>de</strong> varios continentes y periodos <strong>de</strong> tiempo largos<br />
(15 años en promedio y en su <strong>mayo</strong>ría bacterias patógenas) (Selan<strong>de</strong>r et al., 1986;<br />
Caugant et al., 1987). Bajo esta metodología se observó la distribución global <strong>de</strong><br />
<strong>de</strong>terminados genotipos multilocus para cada especie, lo que sugirió la clonalidad <strong>de</strong> las<br />
poblaciones bacterianas a pesar <strong>de</strong> los altos niveles <strong>de</strong> variación genética encontrados<br />
(Whittam et al., 1983; Caugant et al., 1987; Selan<strong>de</strong>r et al., 1987; Maynard-Smith,<br />
1993; Souza et al., 1994; Souza et al. 1999; Maynard-Smith, 2000). Asimismo, otro<br />
indicio <strong>de</strong> clonalidad fueron las observaciones que se tenían sobre la asociación <strong>de</strong><br />
<strong>de</strong>terminados serotipos con enfermeda<strong>de</strong>s particulares (Orskov y Orskov, 1983).<br />
No fue sino hasta la obtención <strong>de</strong> las primeras secuencias <strong>de</strong> nucleótidos que la<br />
recombinación entró en el escenario evolutivo <strong>de</strong> las bacterias (O’Rourke et al., 1993).<br />
Estos estudios sugirieron que las genealogías <strong>de</strong> diferentes genes <strong>de</strong> la misma especie<br />
no eran congruentes y que algunos alelos <strong>de</strong> dichos genes tenían una estructura en<br />
mosaico, lo que indica que diferentes regiones <strong>de</strong> un gen en particular, pue<strong>de</strong>n ser el<br />
resultado <strong>de</strong> historias evolutivas diferentes <strong>de</strong>bido a la recombinación homóloga (Feil y<br />
Spratt, 2001) (Figura 3). Asimismo, estos datos <strong>de</strong>mostraron que la recombinación<br />
homóloga es la causante <strong>de</strong> la asociación aleatoria <strong>de</strong> los alelos, fenómeno también<br />
llamado equilibrio <strong>de</strong> ligamiento en don<strong>de</strong> la presencia <strong>de</strong> un alelo en un locus<br />
<strong>de</strong>terminado, es in<strong>de</strong>pendiente <strong>de</strong> la presencia o ausencia <strong>de</strong> los alelos <strong>de</strong> otros loci<br />
(Maynard-Smith, 2000).
10<br />
Figura 3. Consecuencias <strong>de</strong> la recombinación homóloga<br />
La recombinación homóloga pue<strong>de</strong> generar topologías ambiguas. Arriba, topologías esperadas<br />
bajo los efectos <strong>de</strong> la recombinación. Abajo, linajes con eventos recombinatiorios marcados con<br />
flechas horizontales. a. Topología resuelta <strong>de</strong> un linaje clonal. b. Un evento recombinatorio<br />
causa ambigüedad en una <strong>de</strong> las ramas. c. Dos eventos <strong>de</strong> recombinación son suficientes para<br />
nublar la historia <strong>de</strong>l linaje (Figura tomada <strong>de</strong> Salas, 2007).<br />
Años más tar<strong>de</strong>, se sistematizó el uso <strong>de</strong> las secuencias <strong>de</strong> genes conservados<br />
para el estudio <strong>de</strong> la diversidad y evolución bacterianas (Mai<strong>de</strong>n et al., 1998). Este<br />
secuenciamiento <strong>de</strong> genes multilocus (MLST, por sus siglas en inglés), a<strong>de</strong>más <strong>de</strong><br />
arrojar niveles <strong>de</strong> variación genética reales, reforzó el papel diferencial que juega la<br />
recombinación homóloga en el origen <strong>de</strong> la diversidad genética y estructuración<br />
poblacional asociada a diferentes especies bacterianas (Figura 4) (Feil y Spratt, 2001;<br />
Feil, 2004, Hanage, et al., 2006; Vos y Di<strong>de</strong>lot, 2009; Di<strong>de</strong>lot y Mai<strong>de</strong>n, 2010). Así, en<br />
la naturaleza po<strong>de</strong>mos encontrar un continuo en la frecuencia <strong>de</strong> la recombinación (Vos<br />
y Di<strong>de</strong>lot, 2009) partiendo <strong>de</strong> especies altamente clonales en don<strong>de</strong> dicha frecuencia es<br />
sumamente rara como en el caso <strong>de</strong> Yersinia pestis y el complejo <strong>de</strong> Mycobacterium<br />
(Achtman et al., 1999; Smith et al., 2003) hasta llegar a especies panmícticas como<br />
Helicobacter pylori en don<strong>de</strong> la recombinación es muy frecuente (Suerbaum et al.,<br />
1998).
11<br />
Figura 4. Poblaciones clonales y poblaciones panmícticas<br />
Las poblaciones clonales conservan el mismo genotipo a lo largo <strong>de</strong>l tiempo mientras que las<br />
poblaciones panmíticas o recombinantes generan nuevos genotipos por combinación <strong>de</strong><br />
diferentes alelos presentes en la población (Figura tomada <strong>de</strong> Salas, 2007).<br />
Asimismo, diversos trabajos en don<strong>de</strong> utilizan ésta misma técnica (MLST), han<br />
arrojado indicios relacionados con los mecanismos que promueven los patrones <strong>de</strong><br />
estructuración <strong>de</strong> la diversidad genética. Estos estudios sugieren que la variación<br />
genética en bacterias se encuentra organizada mediante mecanismos análogos a los <strong>de</strong> la<br />
especiacion alopátrica (Whitaker et al., 2003), ecológica (Palys et al., 2000; Cohan,<br />
2001) y biológica (Dykhuizen y Green, 1991; Whitaker et al., 2005) propios <strong>de</strong> los<br />
macroorganismos. Por ejemplo, se ha <strong>de</strong>tectado aislamiento geográfico el cual<br />
promueve especiación alopátrica, en poblaciones <strong>de</strong> arqueas (Sulfolobus islandicus) y<br />
cianobacterias hipertermófilas (Synechococcus) a escala intercontinental (Whitaker et<br />
al., 2003; Papke et al., 2003).<br />
Asimismo, poblaciones bacterianas pertenecientes a una misma especie que<br />
presenta la misma distribución geográfica, pue<strong>de</strong>n divergir gracias a la presencia <strong>de</strong><br />
barreras ecológicas (tanto bióticas como abióticas) lo que promueve una especiación<br />
simpátrica o ecológica como en el caso <strong>de</strong> Vibrio vulnificus, especie acuática que<br />
muestra una marcada diferenciación genética entre las cepas provenientes <strong>de</strong> humanos<br />
infectados con respecto a los aislados <strong>de</strong> animales marinos y ambientes acuáticos<br />
salados (Bisharat et al., 2007).
12<br />
Igualmente, se ha <strong>de</strong>tectado aislamiento sexual el cual promueve especiación<br />
biológica análoga a la <strong>de</strong> eucariontes, en especies tan diferentes como Ferroplasma tipo<br />
II y Salmonella enterica en don<strong>de</strong> la frecuencia <strong>de</strong> recombinación al interior <strong>de</strong> las<br />
poblaciones es <strong>mayo</strong>r que entre ellas <strong>de</strong>bido a barreras mecanicistas propias <strong>de</strong> la<br />
recombinación homóloga como las impuestas por el sistema <strong>de</strong> reparación <strong>de</strong> malos<br />
apareamientos <strong>de</strong>l ADN (Tyson et al., 2004 y Di<strong>de</strong>lot et al., 2011 respectivamente).<br />
1.2.6. Dinámica evolutiva <strong>de</strong> especies clonales<br />
¿Qué suce<strong>de</strong> cuando la principal fuente <strong>de</strong> variación genética es la mutación puntual<br />
Las poblaciones bacterianas evolucionan principalmente por “selección periódica<br />
(Levin, 1981). En este proceso, surge una mutante la cual si es benéfica aumentará su<br />
frecuencia entre las células bacterianas <strong>de</strong>bido a que confiere una <strong>mayo</strong>r supervivencia<br />
y éxito reproductivo a la población. Pero al mismo tiempo, la selección natural<br />
eliminará a las <strong>de</strong>más variantes o a aquellas que confieran una a<strong>de</strong>cuación menor a la<br />
población por medio <strong>de</strong> un “barrido selectivo” lo que a la larga disminuye la variación<br />
genética. Visto a largo plazo, este mo<strong>de</strong>lo sugiere que los linajes bacterianos clonales se<br />
originan episódicamente o a pasos periódicos, en don<strong>de</strong> cada paso correspon<strong>de</strong> a la<br />
aparición y fijación por un nuevo barrido selectivo <strong>de</strong> alguna mutación la cual confiere<br />
una novedad evolutiva (Figura 5). No obstante, en poblaciones gran<strong>de</strong>s, múltiples<br />
mutaciones benéficas pue<strong>de</strong>n originarse al mismo tiempo dando pie a que éstas<br />
compitan entre ellas (<strong>de</strong> Visser y Rozen, 2006). Este fenómeno llamado interferencia<br />
clonal sugiere que la evolución <strong>de</strong> estas poblaciones está dada por la ventaja selectiva y<br />
los tiempos <strong>de</strong> aparición <strong>de</strong> solamente una pequeña minoría <strong>de</strong> estas mutaciones<br />
favorables (Hegreness et al., 2006).<br />
Existe otro mo<strong>de</strong>lo llamado “La matraca <strong>de</strong> Muller” el cual sugiere que es la<br />
<strong>de</strong>riva génica junto con la mutación puntual, los principales mecanismos que explican el<br />
<strong>de</strong>venir evolutivo <strong>de</strong> los organismos asexuales. En este caso, las poblaciones bacterianas<br />
acumulan mutaciones ligeramente <strong>de</strong>letéreas a lo largo <strong>de</strong> las generaciones. Debido a<br />
que el mo<strong>de</strong>lo propone que las poblaciones son pequeñas, que no existe rastro alguno <strong>de</strong><br />
recombinación, que las mutaciones <strong>de</strong> “regreso” no ocurren y que la selección<br />
purificadora es muy débil como para remover todas las mutaciones <strong>de</strong>letéreas que van<br />
surgiendo, al paso <strong>de</strong>l tiempo las poblaciones asexuales se extinguen (Muller, 1964;
13<br />
Felsenstein, 1974). Es así que gracias a este mo<strong>de</strong>lo se pue<strong>de</strong> explicar por qué las<br />
especies totalmente asexuales son muy raras.<br />
Figura 5. Evolución bacteriana <strong>de</strong> especies clonales por selección periódica<br />
Una población bacteriana (en color azul) diversifica por mutación puntual promoviendo la<br />
aparición <strong>de</strong> mutantes que confieren una a<strong>de</strong>cuación (éxito y supervivencia). Aquella que<br />
confiera la <strong>mayo</strong>r a<strong>de</strong>cuación, será fijada (población roja) eliminándose así toda la variación<br />
neutral acumulada mediante un barrido selectivo, esto <strong>de</strong>bido a la ausencia <strong>de</strong> recombinación en<br />
las poblaciones. De nuevo, una población monomórfica diversifica y vuelve a fijarse la mutante<br />
adaptativa más exitosa (población ver<strong>de</strong>). Así, la acción <strong>de</strong> la selección periódica resulta en una<br />
disminución dramática <strong>de</strong> la diversidad genética (Figura modificada <strong>de</strong> Feil, 2010).<br />
1.2.7. Dinámica evolutiva <strong>de</strong> especies recombinantes<br />
En cambio, cuando la frecuencia en la recombinación homóloga es alta, la probabilidad<br />
<strong>de</strong> que múltiples mutaciones potencialmente benéficas se dispersen entre las<br />
poblaciones aumenta, promoviendo así la diversificación y cohesión <strong>de</strong> una sola y gran<br />
poza génica. A<strong>de</strong>más, <strong>de</strong>bido a que la recombinación suscita la aparición <strong>de</strong> genes y<br />
genomas mosaico, se genera cierta in<strong>de</strong>pen<strong>de</strong>ncia entre las diferentes regiones <strong>de</strong>l<br />
genoma por lo que tanto la selección natural como la <strong>de</strong>riva génica actuarán <strong>de</strong> manera<br />
in<strong>de</strong>pendiente sobre los diferentes alelos y regiones <strong>de</strong>l genoma (Salas, 2007). Pero
14<br />
conforme se van adquiriendo alelos <strong>de</strong>l genoma central y/o genes “flexibles” asociados<br />
a diferentes nichos ecológicos y/o historias <strong>de</strong> vida, las poblaciones que conforman a<br />
una especie van diferenciándose una <strong>de</strong> la otra. Aunado a esto, si la recombinación al<br />
interior <strong>de</strong> cada población que conforma a una especie es <strong>mayo</strong>r con respecto a la que se<br />
da entre las poblaciones, la diferenciación entre las mismas aumenta ya que el flujo<br />
génico disminuye, promoviendo aún más su divergencia y a la larga, el origen <strong>de</strong><br />
nuevas especies (Figura 6) (Dykhuizen y Green, 1991; Shapiro et al., 2012).<br />
Figura 6. Evolución bacteriana <strong>de</strong> especies recombinantes<br />
Mo<strong>de</strong>lo evolutivo que <strong>de</strong>scribe la coherencia genómica al interior <strong>de</strong> las poblaciones<br />
recombinantes así como la divergencia (dimensión horizontal) entre ellas. Las flechas negras<br />
indican organismos o aislados. Las líneas rojas indican recombinación entre los genomas. La<br />
línea morada indica un evento <strong>de</strong> especiación. Las cruces negras indican múltiples mutaciones<br />
favorables que se fijan en las poblaciones <strong>de</strong>bido a que la recombinación homóloga actúa <strong>de</strong><br />
manera in<strong>de</strong>pendiente sobre las diferentes regiones <strong>de</strong>l genoma. Los círculos azules y ver<strong>de</strong>s<br />
indican elementos genéticos adquiridos vía transferencia horizontal los cuales son importantes<br />
en el proceso <strong>de</strong> adaptación <strong>de</strong> las poblaciones divergentes. El bloque gris indica una barrera a<br />
la recombinación (Figura modificada <strong>de</strong> Doolittle y Papke, 2006, con información <strong>de</strong> Salas,<br />
2007; Shapiro et al., 2012).<br />
1.2.8. Procesos históricos y contemporáneos en las poblaciones bacterianas<br />
Gracias a la disponibilidad <strong>de</strong> los genomas completos <strong>de</strong> varios aislados <strong>de</strong> una misma<br />
especie bacteriana es que se ha logrado estudiar a fondo el papel que juegan tanto la<br />
selección natural como la <strong>de</strong>riva génica en la estructuración poblacional. Así, la
15<br />
genómica <strong>de</strong> poblaciones permite i<strong>de</strong>ntificar y separar los efectos que tienen en la<br />
divergencia <strong>de</strong> las poblaciones bacterianas, los procesos histórico promovidos por la<br />
<strong>de</strong>riva génica, <strong>de</strong> los contemporáneos o ecológicos, mol<strong>de</strong>ados por la selección natural<br />
(Luikart et al., 2003). Por lo que los efectos que se dan a nivel <strong>de</strong> todo el genoma, nos<br />
informan a cerca <strong>de</strong> la <strong>de</strong>mografía <strong>de</strong> las poblaciones así como <strong>de</strong> su historia<br />
filogenética, mientras que los efectos que se dan a nivel <strong>de</strong> loci específicos, nos<br />
permiten i<strong>de</strong>ntificar genes importantes para la a<strong>de</strong>cuación y adaptación a nuevos nichos<br />
(Black et al, 2001; Luikart et al., 2003; Na<strong>de</strong>au y Jiggins, 2010).<br />
2. Mo<strong>de</strong>lo <strong>de</strong> estudio: Escherichia coli<br />
Consi<strong>de</strong>rando lo anteriormente expuesto, aquella especie bacteriana que ocupe un<br />
amplio rango <strong>de</strong> nichos así como diferentes estilos <strong>de</strong> vida es un mo<strong>de</strong>lo <strong>de</strong> estudio<br />
apropiado que nos permita respon<strong>de</strong>r preguntas concernientes a los mecanismos<br />
evolutivos y ecológicos que promueven la diversificación, estructuración y divergencia<br />
<strong>de</strong> las poblaciones naturales. Es así que elegimos a Escherichia coli como mo<strong>de</strong>lo <strong>de</strong><br />
estudio para contestar a las interrogantes planteadas en este trabajo.<br />
2.1. Historia natural <strong>de</strong> E. coli<br />
E. coli es una bacteria Gram negativa perteneciente a la clase <strong>de</strong> las Proteobacterias,<br />
subclase Gamma-proteobacterias, familia Enterobacteriacea. Esta familia se caracteriza<br />
por tener organismos facultativos lo que significa que pue<strong>de</strong>n vivir tanto asociados a un<br />
hospe<strong>de</strong>ro o en ambientes externos como agua, suelo, aire (Logan, 1994).<br />
E. coli se aísla típicamente <strong>de</strong> heces fecales <strong>de</strong> animales homeotermos como<br />
mamíferos con diferentes tipos <strong>de</strong> dietas y aves (Rosebury, 1962; Souza et al., 1999;<br />
Gordon y Cowling, 2003) así como también <strong>de</strong> animales poiquilotermos como reptiles<br />
(Selan<strong>de</strong>r y Levin, 1980; Souza et al., 1999; Gordon y Cowling, 2003). Sin embargo,<br />
también se le ha aislado <strong>de</strong> ambientes acuáticos y terrestres (Ksoll et al., 2007) y a pesar<br />
<strong>de</strong> que se dice que estos ambientes son secundarios y transitorios (Savageau, 1983),<br />
estudios recientes han <strong>de</strong>mostrado que genotipos provenientes <strong>de</strong> estos ambientes<br />
pue<strong>de</strong>n estar adaptados y bajo la influencia <strong>de</strong> la selección natural (Power et al., 2005;<br />
Walk et al., 2007; Alm et al., 2011).
16<br />
En general, la <strong>mayo</strong>ría <strong>de</strong> las cepas <strong>de</strong> E. coli provenientes <strong>de</strong>l tracto intestinal<br />
son consi<strong>de</strong>radas comensales. Asimismo, en el sistema urinario también se pue<strong>de</strong>n<br />
encontrar cepas comensales, a las que se les conoce como E. coli causantes <strong>de</strong><br />
bacteriuria a-sintomática (Dobrindt y Hacker, 2008). Sin embargo, existen cepas<br />
patógenas capaces <strong>de</strong> causar enfermedad tanto a nivel <strong>de</strong>l sistema gastrointestinal así<br />
como a nivel extra-intestinal, el cual incluye al sistema urinario, las meninges, el<br />
peritoneo, los pulmones y la región intra-abdominal (Kaper et al., 2004).<br />
Des<strong>de</strong> el punto <strong>de</strong> vista médico y epi<strong>de</strong>miológico se han clasificado a las cepas<br />
<strong>de</strong> E. coli en diferentes categorías o patotipos los cuales agrupan aislados que<br />
comparten un proceso <strong>de</strong> patogénesis similar, así como la generación <strong>de</strong> un cuadro<br />
clínico característico y un conjunto <strong>de</strong> factores genéticos también llamados factores <strong>de</strong><br />
virulencia (Nataro y Kaper, 1998). Al momento, se han <strong>de</strong>scrito principalmente 6<br />
patotipos <strong>de</strong> E. coli patógenas intestinales (Tabla 1) (Kaper et al., 2004) y 4 extraintestinales<br />
(Johnson, 2011). Sin embargo, estudios sobre la distribución <strong>de</strong> los factores<br />
<strong>de</strong> virulencia en aislados que causan diferentes cuadros clínicos, sugieren que la frontera<br />
que <strong>de</strong>fine a cada uno <strong>de</strong> los patotipos es difusa ya que se han reportado aislados que<br />
presentan genes característicos a diferentes patotipos (Kaper et al., 2004; Johnson et al.,<br />
2008). A<strong>de</strong>más, se ha visto que cepas comensales pue<strong>de</strong>n albergar algunos <strong>de</strong> estos<br />
factores <strong>de</strong> virulencia (Fricke, 2008; Rasko et al., 2008). Por lo anterior, la presencia <strong>de</strong><br />
los factores <strong>de</strong> virulencia no implica forzosamente que <strong>de</strong>terminada cepa sea un aislado<br />
patogénico. Así, cabe preguntarse, ¿qué otros factores promueven la evolución <strong>de</strong> la<br />
patogénesis en E. coli<br />
Tabla 1. Factores <strong>de</strong> virulencia asociados a los principales patotipos <strong>de</strong> Escherichia coli<br />
Medio Microambiente Patotipo Principales factores <strong>de</strong> virulencia Referencias<br />
Intestinal<br />
Intestino <strong>de</strong>lgado<br />
EPEC E.coli<br />
enteropatogénica<br />
Factores <strong>de</strong> colonización:<br />
Plásmido <strong>de</strong>l factor <strong>de</strong> adherencia y<br />
esfacelamiento (EAF).<br />
• Adhesinas: eae, Paa, LPB (Long<br />
Polar Bundle)<br />
• Pili: BFP<br />
(Bundle Forming Pilus)<br />
Eslava et al. 1994; Nataro<br />
• LifA/Efa<br />
y Kaper 1998; Kaper et<br />
Toxinas y efectores:<br />
al., 2004.<br />
Isla <strong>de</strong>l locus <strong>de</strong> esfacelamiento <strong>de</strong><br />
enterocitos (LEE).<br />
• Autotransportador: EspC •<br />
Efectores tipo III: CifC<br />
(Cycle-Inhibiting factor), EspF,<br />
EspG, EspH, Map, Tir<br />
(Translocated Intimin Efector)
17<br />
Intestino <strong>de</strong>lgado<br />
ETEC E.coli<br />
enterotoxigénica<br />
Factores <strong>de</strong> colonización:<br />
• Adhesinas: CFA( Colonization<br />
factor antigen)<br />
Eslava et al. 1994; Nataro<br />
Toxinas y efectores:<br />
y Kaper 1998; Kaper et<br />
• Toxinas termoestable (STa y STb) al., 2004.<br />
y Termolábil (LT)<br />
Extra-intestinal<br />
Colon<br />
Intestino <strong>de</strong>lgado y<br />
colon<br />
Colon<br />
Sistema urinario<br />
Meninges, sangre<br />
EHEC E.coli<br />
enterohemorrágica<br />
EAEC E.coli<br />
enteroagregativa<br />
DAEC E.coli <strong>de</strong><br />
adherencia difusa<br />
EIEC E.coli<br />
enteroinvasiva<br />
UPEC E.coli<br />
uropatogénica<br />
MNEC E.coli<br />
asociada a sepsismeningitis<br />
Factores <strong>de</strong> colonización:<br />
• Adhesinas: eae, Paa, ToxB,<br />
LifA/Efa, Saa, OmpA<br />
• Fimbria:<br />
LPF (Long Polar Fimbrial)<br />
Toxinas y efectores:<br />
Toxina tipo shiga (STx), ureasas<br />
Isla <strong>de</strong>l locus <strong>de</strong> esfacelamiento <strong>de</strong><br />
enterocitos (LEE).<br />
• Autotransportador: EspP •<br />
Efectores tipo III: CifC<br />
(Cycle-Inhibiting factor), EspF,<br />
EspH, Map, Tir (Translocated<br />
Intimin Efector), StcE<br />
Eslava et al. 1994; Nataro<br />
y Kaper 1998.<br />
Factores <strong>de</strong> colonización:<br />
• Adhesinas fimbriales agregativas:<br />
AAFs, agg, aaf, aaf3, hdc, aap, Nataro y Kaper 1998;<br />
shf<br />
Kaper et al., 2004; Dudley<br />
Toxinas y efectores:<br />
y Rasko, 2011.<br />
• Toxina termoestable (EASTI)<br />
astA, pet, pic<br />
Factores <strong>de</strong> colonización:<br />
• Adhesina fimbrial (F1845).<br />
Efectores:<br />
• Proteína <strong>de</strong> membrana externa<br />
(AIDA1).<br />
Factores <strong>de</strong> colonización:<br />
• virG: nucleación <strong>de</strong> los filamentos<br />
<strong>de</strong> actina<br />
Factores <strong>de</strong> a<strong>de</strong>cuación:<br />
• Si<strong>de</strong>róforo: aerobactina<br />
Toxinas y efectores:<br />
• Shigella enterotoxina 1 (ShET1),<br />
sepA, sigA, ipaA, ipaB, IPAC,<br />
ipaH, ipgD, virA<br />
Factores <strong>de</strong> colonización:<br />
• Fimbrias: papA, F1C, S, fimH<br />
• Adhesinas:<br />
Dr<br />
Toxinas y efectores:<br />
• Sat, HlyA, CNF-1,-2 (Cytotoxic<br />
necrotizing factor), kpsMT<br />
(Polisacárido capsular <strong>de</strong>l grupo<br />
II).<br />
Factores <strong>de</strong> a<strong>de</strong>cuación:<br />
• Si<strong>de</strong>róforos: IreA, IroN<br />
• Transporte<br />
Heme: Shu<br />
Factores <strong>de</strong> colonización:<br />
• Fimbrias: S, ompA, Ibe A, B, C,<br />
AslA.<br />
• Cápsula K<br />
Factores <strong>de</strong> a<strong>de</strong>cuación:<br />
• Shu (Transporte grupo Heme).<br />
Toxinas:<br />
• CNF-1,-2 (Cytotoxic necrotizing<br />
factor)<br />
Eslava et al. 1994; Nataro<br />
y Kaper 1998; Kaper et<br />
al., 2004.<br />
Nataro y Kaper 1998;<br />
Kaper et al., 2004;<br />
Bumbaugh y Lacher,<br />
2011.<br />
Kaper et al., 2004;<br />
Dobrindt y Hacker 2008;<br />
Johnson, 2011.<br />
Kaper et al., 2004;<br />
Dobrindt y Hacker 2008.
18<br />
2.2. Dinámica evolutiva <strong>de</strong> E. coli<br />
Durante mucho tiempo, se consi<strong>de</strong>ró a E. coli como una especie totalmente clonal<br />
(Whittam et al., 1983; Maynard-Smith et al., 1993). Trabajos recientes utilizando el<br />
genoma central completo, sugieren que a pesar <strong>de</strong> los niveles <strong>de</strong> recombinación<br />
homóloga <strong>de</strong>tectados, ésta especie permanece aparentemente clonal (Wirth et al., 2006;<br />
Touchon et al., 2009; Tenaillon et al., 2010; Denamur et al., 2010). En <strong>de</strong>talle, la tasa <strong>de</strong><br />
recombinación es similar a lo largo <strong>de</strong> todo el genoma a excepción <strong>de</strong> tres regiones<br />
localizadas o “hotspots” (dos regiones alre<strong>de</strong>dor <strong>de</strong>l operon rfb involucrado en la<br />
sín<strong>tesis</strong> <strong>de</strong>l antígeno O y la otra región alre<strong>de</strong>dor <strong>de</strong>l gen fimA codificante <strong>de</strong>l factor <strong>de</strong><br />
adherencia fimbria A) en don<strong>de</strong> los niveles <strong>de</strong> recombinación son muy altos (Di<strong>de</strong>lot et<br />
al., 2012).<br />
Esta dinámica en la recombinación favorece la existencia <strong>de</strong> una estructura<br />
filogenética que siempre se recupera in<strong>de</strong>pendientemente <strong>de</strong>l tipo <strong>de</strong> muestra analizada.<br />
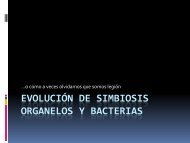
Esta señal filogenética organiza a los miembros <strong>de</strong> E. coli en cuatro gran<strong>de</strong>s grupos:<br />
A+B1, B2, D y E (Selan<strong>de</strong>r et al., 1987; Goullet y Picard, 1989; Herzer et al., 1990;<br />
Escobar-Páramo et al., 2004; Gordon et al., 2008). No obstante, estudios recientes han<br />
<strong>de</strong>scrito la presencia <strong>de</strong> nuevos grupos menores quedando así los siguientes grupos E.<br />
coli sensu stricto: A+B1, B2, C, D, E y F y un grupo correspondiente al clado I <strong>de</strong><br />
Escherichia (Figura 7) (Clermont et al., 2013). Este clado I es consi<strong>de</strong>rado como un<br />
grupo <strong>de</strong> E. coli en términos <strong>de</strong> la recombinación existente entre las cepas<br />
pertenecientes a este linaje críptico y otros miembros pertenecientes a los clados<br />
<strong>mayo</strong>res <strong>de</strong> E. coli (Luo et al., 2011).<br />
Asimismo, se ha sugiriendo un componente ecológico en la evolución <strong>de</strong> esta<br />
especie entérica <strong>de</strong>bido a que se ha establecido que los principales grupos filogenéticos<br />
difieren en sus nichos ecológicos, rasgos <strong>de</strong> historia <strong>de</strong> vida así como en la habilidad<br />
para causar <strong>de</strong>terminadas enfermeda<strong>de</strong>s (Gordon, 2010; Tenaillon et al., 2010, Alm et<br />
al., 2011). Así, cepas responsables <strong>de</strong> infecciones extra-intestinales es más probable que<br />
sean miembros <strong>de</strong>l grupo B2 ó D en lugar <strong>de</strong>l grupo A ó B1 (Picard et al., 1999;<br />
Johnson y Stell, 2000). En cambio, cepas clasificadas como A ó B1 generalmente son<br />
aislados comensales provenientes <strong>de</strong>l intestino <strong>de</strong> mamíferos (Escobar-Páramo et al.,<br />
2006), peces, ranas y reptiles, así como <strong>de</strong> ambientes externos (Gordon y Cowling,
19<br />
2003). Igualmente, aislados provenientes <strong>de</strong> animales <strong>de</strong> granja es más probable que<br />
pertenezcan a los grupos A y B1 que los aislados <strong>de</strong> animales silvestres (Picard et al.,<br />
1999).<br />
Figura 7. Estructura filogenética <strong>de</strong> Escherichia coli<br />
Reconstrucción arrojada por el método <strong>de</strong> Máxima Verosimilitud utilizando el mo<strong>de</strong>lo<br />
evolutivo (GTR+G+I) y basado en la secuencia parcial <strong>de</strong> 13 genes <strong>de</strong> mantenimiento (9819 pb)<br />
(Figura tomada <strong>de</strong> Clermont et al., 2013).<br />
Por otro lado, se ha visto que la capacidad <strong>de</strong> E. coli <strong>de</strong> habitar diferentes nichos<br />
y estilos <strong>de</strong> vida se <strong>de</strong>be a la alta plasticidad genómica que presenta esta especie. Esta<br />
plasticidad está dada tanto por la recombinación homóloga la cual promueve la<br />
formación <strong>de</strong> nuevos genotipos, como por la inserción <strong>de</strong> ADN adquirido<br />
horizontalmente (Touchon et al., 2009; Schubert et al., 2009; Di<strong>de</strong>lot et al., 2012,<br />
Leimbach y Dobrindt, 2013). Así, esta dinámica <strong>de</strong>l genoma da lugar a un reservorio
20<br />
genético gran<strong>de</strong> lo que a su vez implica la presencia <strong>de</strong> un pangenoma abierto para esta<br />
enterobacteria como se ha sugerido al comparar diversos genomas provenientes <strong>de</strong><br />
diferentes nichos ecológicos. En estos trabajos se sugiere que el reservorio <strong>de</strong> E. coli<br />
cuenta con más <strong>de</strong> 18,000 genes, cantidad sorpren<strong>de</strong>nte si se toma en cuenta que un<br />
genoma típico <strong>de</strong> esta especie consta <strong>de</strong> alre<strong>de</strong>dor 5,000 genes (Chaudhuri y Hen<strong>de</strong>rson,<br />
2012; Touchon et al., 2009; Rasko et al., 2008). Asimismo, el tamaño <strong>de</strong>l genoma varía<br />
en un rango que va <strong>de</strong> los 4.6 a los 5.6 Mb (Bergthorsson y Ochman, 1998) diferencia<br />
que se explica gracias a la adquisición <strong>de</strong> genes por transferencia horizontal y<br />
recombinación homóloga así como por eventos <strong>de</strong> reducción <strong>de</strong>l genoma (Mira et al.,<br />
2001; Gregory y DeSalle, 2005). Finalmente, se ha sugerido una correlación entre el<br />
tamaño <strong>de</strong>l genoma y el grupo filogenético al cual pertenece <strong>de</strong>terminada cepa. Así,<br />
genomas más pequeños se encuentran en los grupos A y B1 y los más gran<strong>de</strong>s en los<br />
grupos B2, D y E (Bergthorsson y Ochman, 1998).<br />
3. Justificación y Objetivos<br />
A la fecha, los estudios que se han realizado sobre la diversificación y estructuración<br />
genética <strong>de</strong> E. coli se han realizado utilizando muestras exclusivamente <strong>de</strong> aislados<br />
patógenos, o <strong>de</strong> cepas ambientales, o <strong>de</strong> cepas comensales <strong>de</strong> humanos (Escobar-<br />
Páramo et al., 2006; Walk et al., 2007; Jaureguy et al., 2008; Okeke et al., 2010).<br />
Asimismo, se han llevado a cabo diversos trabajos con un enfoque filogenético en<br />
don<strong>de</strong> se analiza el genoma completo <strong>de</strong> una muestra limitada a las cepas<br />
representativas <strong>de</strong> los diferentes patotipos y una cepa comensal (Touchon et al., 2009;<br />
Leopold et al., 2011) para estudiar el paradigma clonal propuesto para E. coli. Por otro<br />
lado, el estudio <strong>de</strong> la evolución <strong>de</strong> la patogénesis y comensalismo en esta especie<br />
entérica, se ha basado principalmente en la <strong>de</strong>scripción <strong>de</strong>l flujo <strong>de</strong> información<br />
genética entre aislados <strong>de</strong> diferentes patotipos y con otras especies entéricas al<br />
<strong>de</strong>terminar la presencia ó ausencia <strong>de</strong> factores <strong>de</strong> virulencia y colonización (Reid et al.,<br />
2000; Bumbaugh y Lacher, 2011; Lloyd y Mobley, 2011). Por lo que la información<br />
que alberga la gran gama <strong>de</strong> aislados provenientes <strong>de</strong> diferentes hospe<strong>de</strong>ros y estilos <strong>de</strong><br />
vida en los que habita esta especie no se ha consi<strong>de</strong>rado aún en su totalidad.<br />
El <strong>Instituto</strong> <strong>de</strong> <strong>Ecología</strong> cuenta con una diversa colección <strong>de</strong> cepas <strong>de</strong> E. coli<br />
provenientes <strong>de</strong> hospe<strong>de</strong>ros tan diversos como mamíferos, reptiles, aves, marsupiales,<br />
tanto silvestres como domesticados, con diferentes tipos <strong>de</strong> dieta y estilos <strong>de</strong> vida, así
21<br />
como también aislados provenientes <strong>de</strong> ambientes externos como agua, aire y lodo<br />
(Souza et al., 1999; 2002).<br />
De esta muestra sabemos a nivel <strong>de</strong> genoma central, que los niveles <strong>de</strong> variación<br />
genética son altos (Souza et al., 1999). Asimismo sabemos, que aislados <strong>de</strong> animales<br />
silvestres provenientes <strong>de</strong> hospe<strong>de</strong>ros sanos en algunas ocasiones, cuentan con un<br />
genoma flexible dinámico, (correspondiente a la patogénesis) (Sandner et al., 2001).<br />
Pero ahora, ¿cómo es que se genera y mantiene ésta gran poza génica al mismo tiempo<br />
que se promueve la presencia <strong>de</strong> diferentes estilos <strong>de</strong> vida en la especie<br />
Es así que el objetivo general <strong>de</strong> este proyecto fue <strong>de</strong>terminar los mecanismos<br />
<strong>de</strong> diversificación genética y los patrones <strong>de</strong> diferenciación poblacional en Escherichia<br />
coli.<br />
Y los objetivos particulares:<br />
1.- Estimar el impacto <strong>de</strong> la recombinación homóloga y mutación puntual en la<br />
diversificación <strong>de</strong>l genoma central <strong>de</strong> E. coli así como <strong>de</strong>terminar su papel en la<br />
diferenciación genética <strong>de</strong> las poblaciones que conforman a esta especie con el fin <strong>de</strong><br />
dar una explicación alternativa al paradigma clonal propuesto previamente para esta<br />
especie.<br />
2.- Analizar el papel <strong>de</strong>l nicho ecológico en la estructuración <strong>de</strong> la diversidad genética<br />
<strong>de</strong> esta especie.<br />
3.- Evaluar la influencia <strong>de</strong> la historia filogenética y el nicho ecológico en la<br />
diversificación <strong>de</strong>l genoma flexible <strong>de</strong> E. coli.<br />
4.- Determinar la contribución <strong>de</strong>l genoma central en la evolución <strong>de</strong> la patogénesis en<br />
E. coli.<br />
Los resultados y conclusiones <strong>de</strong>rivados <strong>de</strong> los dos primeros objetivos se<br />
encuentran plasmados en un primer artículo titulado “Hierarchical clustering of<br />
genetic diversity associated to different levels of mutation and recombination in<br />
Escherichia coli: A study based on Mexican isolates” y se obtuvieron mediante un<br />
análisis <strong>de</strong> genética <strong>de</strong> poblaciones llevado a cabo en una muestra compuesta <strong>de</strong> 128<br />
aislados intestinales <strong>de</strong> E. coli. El tercer objetivo se resolvió <strong>de</strong>terminando el tamaño <strong>de</strong>l<br />
cromosoma <strong>de</strong> esta misma muestra en estudio mediante la técnica <strong>de</strong> campos pulsados y
22<br />
los resultados se encuentran plasmados en un segundo artículo titulado “Chromosome<br />
size variation in Escherichia coli is not linked either to phylogeny nor ecological<br />
niche”. Para llevar a cabo el cuarto objetivo se realizó un análisis <strong>de</strong> genómica <strong>de</strong><br />
poblaciones utilizando genomas completos disponibles en las bases <strong>de</strong> datos y<br />
constituye la <strong>tesis</strong> <strong>de</strong> licenciatura <strong>de</strong> la Bióloga Luna Luisa Sánchez Reyes titulada<br />
“Genómica <strong>de</strong> poblaciones asociada a los nichos ecológicos <strong>de</strong> Escherichia coli”.<br />
Los hallazgos <strong>de</strong> esta <strong>tesis</strong> contribuyen <strong>de</strong> manera significativa al entendimiento<br />
<strong>de</strong> los mecanismos evolutivos y genéticos que promueven la divergencia poblacional y<br />
evolución <strong>de</strong> la patogénesis en E. coli. En <strong>de</strong>talle, la poza génica correspondiente al<br />
genoma central <strong>de</strong> esta especie, diversifica principalmente por recombinación<br />
homóloga. Sin embargo, la frecuencia a la que suce<strong>de</strong>n estos mecanismos genéticos es<br />
diferente <strong>de</strong> acuerdo al nivel <strong>de</strong> organización <strong>de</strong> la diversidad genética y su asociación a<br />
un nicho ecológico y estilo <strong>de</strong> vida. Así, en esta <strong>tesis</strong> propongo una explicación<br />
alternativa al paradigma clonal reportado para E. coli. Asimismo, los resultados <strong>de</strong> esta<br />
investigación sugieren que el tamaño <strong>de</strong>l genoma en E. coli no está <strong>de</strong>terminado por su<br />
historia filogenética como se ha propuesto hasta ahora. Y finalmente, los análisis <strong>de</strong><br />
genómica <strong>de</strong> poblaciones arrojan indicios <strong>de</strong> que la adaptación <strong>de</strong> E. coli a diferentes<br />
nichos no se da solamente por la adquisición horizontal <strong>de</strong> genes sino que la evolución<br />
adaptativa <strong>de</strong> diversas funciones codificadas en el genoma central tales como la<br />
regulación <strong>de</strong> la expresión génica, juegan un papel importante en la evolución <strong>de</strong> la<br />
patogénesis en esta especie.
23<br />
4. Artículo 1<br />
“Agrupamiento jerárquico <strong>de</strong> la diversidad genética, asociado a diferentes niveles <strong>de</strong><br />
mutación y recombinación en Escherichia coli: un estudio basado en aislados<br />
mexicanos.<br />
4.1. Resumen<br />
Escherichia coli es un microorganismo tanto <strong>de</strong> vida libre como asociado al colon <strong>de</strong><br />
mamíferos y aves ya sea como patógeno o comensal. A pesar <strong>de</strong> que la población<br />
mexicana <strong>de</strong> E. coli intestinal mantiene altos niveles <strong>de</strong> diversidad genética, se<br />
<strong>de</strong>sconocen al momento los mecanismos mediante los cuales se origina dicha variación.<br />
En este trabajo investigamos el papel <strong>de</strong> la recombinación homóloga y la mutación<br />
puntual en la diversificación genética y estructura poblacional <strong>de</strong> aislados <strong>de</strong> E. coli<br />
provenientes <strong>de</strong> México. Para lo cual obtuvimos la secuencia parcial <strong>de</strong> siete genes<br />
constitutivos (adk, fumC, gyrB, icd, mdh, purA, recA) <strong>de</strong> una muestra compuesta por<br />
128 aislados provenientes <strong>de</strong> un amplio rango <strong>de</strong> hospe<strong>de</strong>ros no asociados a brotes<br />
epidémicos. En general encontramos que la diversificación <strong>de</strong> ésta muestra se lleva a<br />
cabo principalmente por recombinación homóloga y en menor medida por mutación<br />
puntual. Y <strong>de</strong>bido a que la diversidad genética se encuentra organizada genéticamente<br />
<strong>de</strong> acuerdo a la genealogía inferida utilizando los marcadores moleculares previamente<br />
<strong>de</strong>scritos, observamos que no existe una tasa <strong>de</strong> recombinación homogénea sino más<br />
bien, que diferentes tasas emergen <strong>de</strong> acuerdo con los diferentes niveles <strong>de</strong> agrupación<br />
tales como grupo filogenético, linaje y complejo clonal. A<strong>de</strong>más, <strong>de</strong>tectamos una clara<br />
señal <strong>de</strong> subestructura al interior <strong>de</strong>l grupo filogenético A+B1, en don<strong>de</strong> los aislados<br />
que lo componen se diferenciaron en cuatro linajes discretos. El patrón <strong>de</strong> subestructura<br />
se explica por la presencia <strong>de</strong> varios complejos clonales asociados a un estilo <strong>de</strong> vida y<br />
hospe<strong>de</strong>ro particular así como a los diferentes mecanismos <strong>de</strong> diversificación genética<br />
asociados. Por lo que proponemos estos hallazgos como una explicación alternativa al<br />
mantenimiento <strong>de</strong> la señal filogenética <strong>de</strong> esta especie a pesar <strong>de</strong> la prevalencia <strong>de</strong> la<br />
recombinación homóloga. Finalmente corroboramos que el utilizar tanto la<br />
aproximación filogenética como la <strong>de</strong> la genética <strong>de</strong> poblaciones se convierte en una<br />
herramienta efectiva para el establecimiento <strong>de</strong> una vigilancia epi<strong>de</strong>miológica a la<br />
medida <strong>de</strong> las especificida<strong>de</strong>s ecológicas <strong>de</strong> cada región geográfica.
Infection, Genetics and Evolution 13 (2013) 187–197<br />
Contents lists available at SciVerse ScienceDirect<br />
Infection, Genetics and Evolution<br />
journal homepage: www.elsevier.com/locate/meegid<br />
Hierarchical clustering of genetic diversity associated to different levels of<br />
mutation and recombination in Escherichia coli: A study based on Mexican isolates<br />
Andrea González-González a , Luna L. Sánchez-Reyes a,1 , Gabriela Delgado Sapien b , Luis E. Eguiarte a ,<br />
Valeria Souza a,⇑<br />
a Departamento <strong>de</strong> <strong>Ecología</strong> Evolutiva, <strong>Instituto</strong> <strong>de</strong> <strong>Ecología</strong>, Universidad Nacional Autónoma <strong>de</strong> México, México D.F., Mexico<br />
b Departamente <strong>de</strong> Microbiología y Parasitología, Facultad <strong>de</strong> Medicina, Universidad Nacional Autónoma <strong>de</strong> México, México D.F., Mexico<br />
article<br />
info<br />
abstract<br />
Article history:<br />
Received 30 May 2012<br />
Received in revised form 4 September 2012<br />
Accepted 5 September 2012<br />
Available online 18 September 2012<br />
Keywords:<br />
Escherichia coli<br />
Population structure<br />
Clonal complex<br />
Homologous recombination<br />
Point mutation<br />
Epi<strong>de</strong>miological surveillance<br />
Escherichia coli occur as either free-living microorganisms, or within the colons of mammals and birds as<br />
pathogenic or commensal bacteria. Although the Mexican population of intestinal E. coli maintains high<br />
levels of genetic diversity, the exact mechanisms by which this occurs remain unknown. We therefore<br />
investigated the role of homologous recombination and point mutation in the genetic diversification<br />
and population structure of Mexican strains of E. coli. This was explored using a multi locus sequence typing<br />
(MLST) approach in a non-outbreak related, host-wi<strong>de</strong> sample of 128 isolates. Overall, genetic diversification<br />
in this sample appears to be driven primarily by homologous recombination, and to a lesser<br />
extent, by point mutation. Since genetic diversity is hierarchically organized according to the MLST genealogy,<br />
we observed that there is not a homogeneous recombination rate, but that different rates emerge<br />
at different clustering levels such as phylogenetic group, lineage and clonal complex (CC). Moreover, we<br />
<strong>de</strong>tected clear signature of substructure among the A + B1 phylogenetic group, where the majority of isolates<br />
were differentiated into four discrete lineages. Substructure pattern is revealed by the presence of<br />
several CCs associated to a particular life style and host as well as to different genetic diversification<br />
mechanisms. We propose these findings as an alternative explanation for the maintenance of the clear<br />
phylogenetic signal of this species <strong>de</strong>spite the prevalence of homologous recombination. Finally, we corroborate<br />
using both phylogenetic and genetic population approaches as an effective mean to establish<br />
epi<strong>de</strong>miological surveillance tailored to the ecological specificities of each geographic region.<br />
Ó 2012 Elsevier B.V. All rights reserved.<br />
1. Introduction<br />
⇑ Corresponding author. Address: Departamento <strong>de</strong> <strong>Ecología</strong> Evolutiva, <strong>Instituto</strong><br />
<strong>de</strong> <strong>Ecología</strong>, Universidad Nacional Autónoma <strong>de</strong> México, Apartado Postal 70-275,<br />
México D.F. 04510, Mexico. Tel.: +52 55 56 22 90 06; fax: +52 55 56 22 89 95.<br />
E-mail address: souza@servidor.unam.mx (V. Souza).<br />
1 Present address: Departamento <strong>de</strong> Botánica, <strong>Instituto</strong> <strong>de</strong> Biología, Universidad<br />
Nacional Autónoma <strong>de</strong> México, México D.F., Mexico.<br />
It has long been assumed that mutation is the primary mechanism<br />
by which prokaryotic populations diversify (Levin, 1981). Given<br />
that homologous recombination is fundamental to bacterial<br />
evolution (Spratt et al., 2001), it is now wi<strong>de</strong>ly accepted that most<br />
bacterial species do not conform to the clonal mo<strong>de</strong>l of evolution<br />
(Fraser et al., 2007; Vos and Di<strong>de</strong>lot, 2009).<br />
Homologous recombination involves the replacement of small<br />
segments of the bacterial chromosome with the homologous region<br />
from another isolate of the same, or a closely related species<br />
promoting the emergence of new haplotypes (Spratt et al., 2001).<br />
The frequency of these localized recombinational events varies<br />
broadly among bacteria of different species or genera (Vos and Di<strong>de</strong>lot,<br />
2009). Hence, this gives rise to a range of population structures<br />
spanning highly clonal populations, where recombination is<br />
extremely rare (such as Yersinia pestis and Mycobacterium species)<br />
(Achtman et al., 1999; Smith et al., 2003) to panmictic structures,<br />
where recombination is more frequent (Helicobacter pylori) (Suerbaum<br />
et al., 1998).<br />
A classical mo<strong>de</strong>l for the study of bacterial population genetics<br />
is Escherichia coli. Members of this species can be found inhabiting<br />
both water and sediment environments (Savageau, 1983) in addition<br />
to the vertebrate gut, where it occurs as either a commensal or<br />
pathogenic bacteria (Kaper et al., 2004; Tenaillon et al., 2010). For<br />
many years, a clonal population structure has been attributed to<br />
this species (Whittam et al., 1983; Maynard-Smith et al., 1993).<br />
However, recently published works suggest that the genetic structure<br />
of E. coli remains seemingly clonal in spite of the recombination<br />
levels <strong>de</strong>tected. (Touchon et al., 2009; Tenaillon et al., 2010;<br />
Denamur et al., 2010). Thus, a clear phylogenetic signal <strong>de</strong>lineates<br />
members of this species into four major phylogenetic groups<br />
(A + B1, B2, D and E) (Selan<strong>de</strong>r et al., 1987; Goullet and Picard,<br />
1989; Herzer et al., 1990; Escobar-Páramo et al., 2004; Gordon<br />
et al., 2008). It has been assumed that each one of these lineages<br />
1567-1348/$ - see front matter Ó 2012 Elsevier B.V. All rights reserved.<br />
http://dx.doi.org/10.1016/j.meegid.2012.09.003
188 A. González-González et al. / Infection, Genetics and Evolution 13 (2013) 187–197<br />
could be associated with a particular niche, suggesting an ecological<br />
component in E. coli evolution (Picard et al., 1999; Duriez et al.,<br />
2001; Gordon and Cowling, 2003; Power et al., 2005; Gordon et al.,<br />
2008). Recent studies however, have questioned the existence of<br />
such ecological specificity coupled to phylogenetic origin<br />
(Tenaillon et al., 2010; Clermont et al., 2011; Sabarly et al., 2011;<br />
White et al., 2011).<br />
One of the wi<strong>de</strong>ly used approaches into genetic population bacterial<br />
studies is MLST. This technique utilizes housekeeping gene<br />
nucleoti<strong>de</strong> sequences to account for the mechanisms (recombination<br />
and mutation) and the processes (natural selection and genetic<br />
drift) that promote bacterial diversification (Mai<strong>de</strong>n et al., 1998;<br />
Feil, 2004, 2010). Likewise, this method facilitates the <strong>de</strong>scription<br />
of bacterial populations as a number of discrete clusters of related<br />
genotypes also known as clonal complexes (CCs). Theoretically, CCs<br />
are the product of clonal expansions that can occur even within a<br />
freely recombining population when their founding genotypes<br />
have acquired some selective advantage (Feil, 2004).<br />
In Mexico, high levels of genetic diversity coupled to specific<br />
host taxonomic groups have been reported for wild E. coli (Souza<br />
et al., 1999, 2002b). However, the exact mechanisms that generate<br />
this diversity are still unknown. Furthermore, studies on humanassociated<br />
clinical isolates in this country are limited to the<br />
<strong>de</strong>scription of virulence genes and do not consi<strong>de</strong>r an evolutionary<br />
framework (López-Saucedo et al., 2003; Paniagua et al., 2007;<br />
Estrada-Garcia et al., 2009; Nicklasson et al., 2010).<br />
Hence, the objective of this study is to <strong>de</strong>termine the phylogenetic<br />
composition, as well as the dynamics of homologous<br />
recombination and point mutation, in the genetic diversification<br />
of non-outbreak strains of E. coli in Mexico. For this purpose, we<br />
analysed MLST data <strong>de</strong>rived from a host wi<strong>de</strong> range sample.<br />
2. Material and methods<br />
2.1. E. coli strains<br />
A total of 128 strains isolated between 1994 and 2003 were selected<br />
exclusively from the <strong>Instituto</strong> <strong>de</strong> <strong>Ecología</strong> Collection of<br />
E. coli (IECOL), (Souza et al., 1999, 2002a; Sandner et al., 2001)<br />
and from the Enteric Pathogen Reference Laboratory collection,<br />
Public Health Department, Facultad <strong>de</strong> Medicina both at the Universidad<br />
Nacional Autonóma <strong>de</strong> México. The strains were serotyped<br />
for antigens O and H following the protocol <strong>de</strong>scribed in<br />
Orskov and Orskov (1984), by the Enteric Pathogen Reference Laboratory,<br />
Public Health Department, Facultad <strong>de</strong> Medicina at the<br />
Universidad Nacional Autonóma <strong>de</strong> México. A pathogenic type<br />
was assigned for each strain based on serotyping (Supplementary<br />
Table S1).<br />
Three groups of E. coli strains were analyzed: (a) 39 strains isolated<br />
from healthy animals from which, 25 were isolated from wild<br />
animals [5 enteropathogenic E. coli (EPEC), 4 enterotoxigenic E. coli<br />
(ETEC) and 16 non-pathogenic strains], 4 strains from captive animals<br />
[1 ETEC and 3 non-pathogenic strains] and 10 strains from<br />
domesticated animals [2 enterohemorragic E. coli (EHEC), 2 EPEC,<br />
1 ETEC and 5 non-pathogenic strains]; (b) 67 human strains from<br />
which, 14 strains were isolated from faeces of diarrheagenic babies<br />
[12 enteroaggregative E. coli (EAEC) and 2 ETEC strains], 10 strains<br />
from the faeces of healthy babies [1 EPEC, 2 EAEC, 1 EHEC, 3 ETEC<br />
and 3 non-pathogenic isolates] and 43 strains from healthy adults<br />
[8 EHEC, 6 enteroinvasive E. coli (EIEC), 11 EPEC, 13 ETEC and 5<br />
non-pathogenic strains]; (c) 22 environmental strains, from which<br />
9 were isolated from air (2 EPEC, 7 unknown), 4 from soil (1 EIEC, 3<br />
unknown), 1 from a drainpipe, 6 from mud and 2 isolates from<br />
water (Supplementary Table S1).<br />
2.2. Culture conditions and DNA extraction<br />
E. coli strains were grown overnight at 37 °C in 5 ml of Luria<br />
Broth (LB) culture with agitation at 200 rpm. Cells were harvested<br />
by centrifugation and DNA was isolated using a DNA extraction kit<br />
(DNeasy Blood & Tissue kit, Qiagen) according to manufacturer’s<br />
instructions.<br />
2.3. Clermont group <strong>de</strong>termination<br />
A triplex-PCR method was used to assign the E. coli isolates to<br />
phylogenetic group A, B1, B2 or D using a dichotomous key approach<br />
based on the presence or absence of two genes (chuA and<br />
yjaA) and an anonymous DNA fragment (TSPE4.C2) (Clermont<br />
et al., 2000).<br />
2.4. MLST gene sequencing<br />
Gene amplification of seven housekeeping genes conforming to<br />
the MLST scheme (adk, fumC, gyrB, icd, mdh, purA, and recA) were<br />
performed using the primers and protocol specified by the E. coli<br />
MLST website (http://mlst.ucc.ie/mlst/dbs/Ecoli) (Wirth et al.,<br />
2006) with minor modifications for annealing temperatures<br />
(Supplementary Table S2). All polymerase chain reaction (PCR)<br />
products were sequenced by the High Throughput Genomics Unit<br />
at the University of Washington (http://www.htseq.org). Forward<br />
and reverse sequences of each isolate were assembled, quality assessed<br />
and edited by visual inspection with PHRED/PHRAP/Consed<br />
software (Ewing et al., 1998; Gordon et al., 1998) (http://<br />
www.phrap.com). Sequences were aligned using the ClustalW program<br />
(Thompson et al., 1994) as implemented in BioEdit software<br />
package version 7.0.9.0 (Hall, 1999) (http://www.mbio.ncsu.edu/<br />
BioEdit/bioedit.html). Sequences of MLST genes were submitted<br />
to GenBank (Accession Nos. JQ714288–JQ714385, JQ728594–<br />
JQ728623, JQ729124–JQ729251, JQ750344–JQ750471, JQ771211–<br />
JQ771296, JQ818824–JQ819249).<br />
2.5. DNA polymorphism analyses<br />
The number of alleles, haplotype diversity, numer of polymorphic<br />
sites, synonymous and non-synonymous changes, Tajima’s D<br />
statistics, and the nucleoti<strong>de</strong> diversity per site (p) were calculated<br />
using DnaSP v4.0 (Rozas et al., 2003).<br />
2.6. Determination of sequence types (STs) and i<strong>de</strong>ntification of clonal<br />
complexes (CCs)<br />
A unique number was assigned to each distinct housekeeping<br />
gene sequence variant (allele) and a specific sequence type (ST)<br />
was attributed to each unique combination of alleles. New gene<br />
sequences for each locus were submitted to the E. coli MLST site<br />
(http://mlst.ucc.ie/mlst/dbs/Ecoli/) and new allelic and ST numbers<br />
were confirmed and assigned by the curator. These are all<br />
publicly available. To localize the new Mexican STs in a global<br />
diversity context, we performed a maximum likelihood (ML) phylogenetic<br />
inference consi<strong>de</strong>ring the Mexican sample plus 1876 STs<br />
from the E. coli MLST database. This analysis was conducted using<br />
the RAxML v7.0.4 software (Stamatakis, 2006) implemented in the<br />
CIPRES web interface (http://www.phylo.org/news/RAxML). CCs<br />
were <strong>de</strong>fined using eBURST V3 (http://eburst.mlst.net) (Feil<br />
et al., 2004) as groups sharing at least six i<strong>de</strong>ntical alleles and<br />
bootstrapping with 1000 samplings using the whole MLST database<br />
as reference.
A. González-González et al. / Infection, Genetics and Evolution 13 (2013) 187–197 189<br />
2.7. Phylogenetic analysis<br />
Concatenated nucleoti<strong>de</strong> sequences of STs were used to infer<br />
the genealogy of the sample using ClonalFrame version 1.2 (Di<strong>de</strong>lot<br />
and Falush, 2007). ClonalFrame is a mo<strong>de</strong>l-based method that<br />
reconstructs genealogies consi<strong>de</strong>ring the effect of homologous<br />
recombination events that disrupt a clonal pattern of inheritance.<br />
Four in<strong>de</strong>pen<strong>de</strong>nt runs of ClonalFrame were performed each consisting<br />
of 450,000 MCMC, where the first 150,000 iterations were<br />
discar<strong>de</strong>d as burn-in. Convergence of all parameters was assessed<br />
by Gelman–Rubin method (1992). The genealogy was summarized<br />
in a 50% majority rule consensus tree using the ClonalFrame GUI<br />
(Di<strong>de</strong>lot and Falush, 2007).<br />
2.8. Genetic differentiation and host association<br />
To account for genetic differentiation levels, we calculated the<br />
average number of nucleoti<strong>de</strong> differences within and among phylogenetic<br />
groups using DnaSP v4.0 (Rozas et al., 2003). In addition,<br />
the fixation in<strong>de</strong>x (F ST ) was calculated using the Arlequin 3.1 software<br />
package (Excoffier et al., 2005). Furthermore, this software<br />
was also used to test for associations between the genetic data<br />
and host or life style (pathogenic or non-pathogenic) by performing<br />
an analysis of molecular variance (AMOVA).<br />
2.9. Recombination analyses<br />
To <strong>de</strong>tect homologous recombination within housekeeping<br />
genes we calculated two parameters: q/h (the ratio of rates at<br />
which recombination and mutation occur) and r/m (the ratio of<br />
rates that a nucleoti<strong>de</strong> is changed as the result of recombination<br />
relative to point mutation). This was achieved by extracting from<br />
the ClonalFrame output the numbers of mutation events, recombination<br />
events, and substitutions introduced by recombination for<br />
the total sample, for each phylogenetic group, for each lineage<br />
and for each CC.<br />
To assess the influence of recombination in the phylogenetic<br />
history of the Mexican sample, four individual ClonalFrame runs<br />
(150,000 burn-in iterations plus 450,000 sampling iterations) were<br />
performed ignoring the role of recombination in the estimation of<br />
the genealogy (i.e., the recombination rate q was set equal to zero).<br />
To <strong>de</strong>scribe the levels of intra-lineage recombination we obtained<br />
the number of recombination breakpoints per lineage using<br />
the genetic algorithm for recombination <strong>de</strong>tection (GARD) tool.<br />
This was implemented in the Datamonkey web interface (http://<br />
www.datamoneky.org/GARD/) (Pond and Frost, 2005) with <strong>de</strong>fault<br />
settings.<br />
To <strong>de</strong>tect the levels of inter-lineage recombination we performed<br />
an analysis using the linkage mo<strong>de</strong>l of the program STRUC-<br />
TURE (Pritchard et al., 2000). This software permitted us to infer<br />
the ancestry of the different lineages i<strong>de</strong>ntified among the Mexican<br />
sample. Four runs of 10,000 iterations of burning, and 20,000<br />
MCMC repeats after burning, were performed in<strong>de</strong>pen<strong>de</strong>ntly for<br />
each value of the number of populations K ranging from 2 to 7<br />
(20 replicates per value of K). The optimal value was K = 4 by comparing<br />
the posterior probabilities of the data given each value of K<br />
from 2 to 7 (Supplementary Fig. S1). Applying the Evanno method<br />
(Evanno et al., 2005) also resulted in the estimate K =4 (Supplementary<br />
Fig. S2). Assignment of STs to ancestral populations was<br />
performed as <strong>de</strong>scribed by Wirth et al. (2006) with some modifications<br />
regarding unassigned STs. Hybrid STs were allocated as AxB1<br />
or B2xD if the sum of A + B1 and B2 + D ancestral proportion was<br />
P0.8. Otherwise, full hybrids ABD were <strong>de</strong>signated.<br />
To <strong>de</strong>tect if recombination is sufficient to create randomassociation<br />
of alleles, the levels of linkage disequilibrium were obtained.<br />
For this, we obtained the standardized in<strong>de</strong>x of association<br />
(I S A) with 10,000 Monte Carlo simulations to confirm statistical significance.<br />
Both methods were implemented in LIAN v3.5 software<br />
(Haubold and Hudson, 2000).<br />
Table 1<br />
Summary of genetic diversity parameters for the 7 coding loci of 128 mexican E. coli strains, for each phylogenetic group and for each lineage.<br />
Gene (128 isolates)<br />
Fragment size<br />
(bp) a<br />
No. of<br />
alleles<br />
H b ±SD c<br />
No. (%) of polymorphic<br />
sites<br />
Synonymous<br />
changes<br />
Non synonymous<br />
changes<br />
Tajima’s<br />
D d<br />
adk 534 21 0.789 ± 0.270 40 (7.49) 40 3 –0.423 <strong>0.0</strong>12<br />
fumC 465 26 0.900 ± <strong>0.0</strong>15 50 (10.75) 45 6 0.360 <strong>0.0</strong>22<br />
gyrB 459 29 0.890 ± <strong>0.0</strong>19 32 (6.97) 32 3 –0.762 <strong>0.0</strong>09<br />
icd 516 26 0.920 ± <strong>0.0</strong>11 43 (8.33) 42 5 <strong>0.0</strong>22 <strong>0.0</strong>15<br />
mdh 450 18 0.890 ± <strong>0.0</strong>14 21 (4.66) 19 2 0.351 <strong>0.0</strong>09<br />
purA 474 24 0.740 ± <strong>0.0</strong>40 26 (5.48) 24 2 –1.218 <strong>0.0</strong>06<br />
recA 507 19 0.800 ± <strong>0.0</strong>20 24 (4.73) 25 0 –0.989 <strong>0.0</strong>06<br />
Phylogenetic group<br />
(3405 bp)<br />
No. of isolates<br />
A + B1 91 58 0.978 ± <strong>0.0</strong>10 132 (3.87) 124 14 0.239 <strong>0.0</strong>08<br />
B2 15 12 0.971 ± <strong>0.0</strong>30 102 (2.99) 95 8 –0.221 <strong>0.0</strong>09<br />
D 15 10 0.914 ± <strong>0.0</strong>60 82 (2.40) 81 2 0.285 <strong>0.0</strong>08<br />
E 7 2 0.476 ± 0.171 1 (<strong>0.0</strong>3) 0 1 0.559 <strong>0.0</strong>001<br />
Lineage (3405 bp) No. of isolates<br />
A 32 18 0.879 ± <strong>0.0</strong>50 55 (1.61) 49 7 –1.356 <strong>0.0</strong>02<br />
A-ST522 7 6 0.952 ± <strong>0.0</strong>96 19 (0.55) 17 2 0.727 <strong>0.0</strong>02<br />
B1 45 28 0.971 ± <strong>0.0</strong>11 67 (1.96) 66 4 0.369 <strong>0.0</strong>05<br />
B1-ST86 5 4 0.900 ± 0.161 3 (<strong>0.0</strong>1) 2 1 –0.174 <strong>0.0</strong>004<br />
Total Sample (3405 bp) No. of isolates<br />
128<br />
82 0.986 ± <strong>0.0</strong>04 236 (6.90) 227 21 –0.336 <strong>0.0</strong>11<br />
a<br />
Number of base pair of protein coding region amplified.<br />
b Haplotype (gene) diversity.<br />
c Standard Deviation.<br />
d Not significant (P > <strong>0.0</strong>5).<br />
e Average number of nucleoti<strong>de</strong> differences per site.<br />
p e
190 A. González-González et al. / Infection, Genetics and Evolution 13 (2013) 187–197<br />
a b c d<br />
A+B1<br />
B2<br />
D<br />
B1<br />
A<br />
A-ST522<br />
B1-ST86<br />
E<br />
ST335<br />
ST11<br />
ST2348<br />
ST405<br />
ST2337<br />
ST414<br />
ST130<br />
ST31<br />
ST106<br />
ST69<br />
ST394<br />
ST2361<br />
ST713<br />
ST136<br />
ST2347<br />
ST550<br />
ST2335<br />
ST2362<br />
ST2346<br />
ST2356<br />
ST2331<br />
ST28<br />
ST2360<br />
ST2359<br />
ST2336<br />
ST2332<br />
ST641<br />
ST453<br />
ST86<br />
ST2358<br />
ST746<br />
ST1303<br />
ST716<br />
ST2345<br />
ST522<br />
ST2334<br />
ST7<br />
ST10<br />
ST2339<br />
ST495<br />
ST34<br />
ST1434<br />
ST96<br />
ST2341<br />
ST218<br />
ST2343<br />
ST2342<br />
ST2344<br />
ST2355<br />
ST2353<br />
ST48<br />
ST1312<br />
ST2349<br />
ST2357<br />
ST1308<br />
ST2333<br />
ST270<br />
ST1582<br />
ST345<br />
ST410<br />
ST58<br />
ST2340<br />
ST29<br />
ST16<br />
ST2350<br />
ST120<br />
ST540<br />
ST867<br />
ST2351<br />
ST443<br />
ST295<br />
ST1248<br />
ST173<br />
ST734<br />
ST2338<br />
ST2352<br />
ST737<br />
ST3<br />
ST316<br />
ST2330<br />
ST2354<br />
ST200<br />
EPEC<br />
EHEC<br />
EHEC<br />
ETEC<br />
ETEC<br />
EAEC, EPEC<br />
NP<br />
EAEC<br />
NP<br />
NP<br />
UNKNOWN<br />
NP<br />
NP<br />
ETEC<br />
EPEC<br />
EAEC<br />
NP<br />
EHEC<br />
EHEC, ETEC<br />
EPEC<br />
EIEC, EHEC<br />
NP<br />
NP<br />
NP<br />
NP<br />
ETEC<br />
UNKNOWN<br />
EAEC<br />
EPEC<br />
UNKNOWN<br />
UNKNOWN<br />
EHEC<br />
NP<br />
UNKNOWN<br />
UNKNOWN<br />
ETEC, NP<br />
ETEC<br />
EAEC, EIEC, EPEC, NP, UNKNOWN<br />
EAEC<br />
EPEC<br />
EAEC, EIEC, NP<br />
NP, UNKNOWN<br />
ETEC<br />
NP<br />
ETEC<br />
EIEC<br />
EAEC<br />
EIEC<br />
EIEC<br />
ETEC<br />
NP, UNKNOWN<br />
ETEC<br />
UNKNOWN<br />
NP<br />
NP<br />
UNKNOWN<br />
EPEC<br />
NP<br />
NP<br />
ETEC<br />
ETEC, NP, UNKNOWN<br />
ETEC<br />
EHEC, EPEC<br />
EHEC<br />
NP<br />
ETEC<br />
NP<br />
NP<br />
UNKNOWN<br />
EIEC, ETEC<br />
ETEC<br />
NP<br />
ETEC<br />
ETEC<br />
EPEC<br />
NP<br />
NP<br />
EPEC<br />
ETEC, EHEC<br />
UNKNOWN<br />
ETEC<br />
EAEC,ETEC<br />
ST11-Cplx<br />
ST69-Cplx<br />
ST394-Cplx<br />
ST28-Cplx<br />
ST86-Cplx<br />
ST10-Cplx<br />
ST29-Cplx<br />
ST20-Cplx<br />
0.2 0.15 0.1 <strong>0.0</strong>5 0<br />
Time (coalescent units)<br />
Fig. 1. (a) Unrooted consensus tree displaying the relationship between the 82 STs of the Mexican E. coli sample at seven concatenated loci (3423 nucleoti<strong>de</strong>s in total). The<br />
<strong>de</strong>ndogram was constructed from the combination of five ClonalFrame runs with a cut-off value of 0.5 as a majority rule consensus. Scale is in coalescent units. (b) Proportion<br />
of ancestry of each of 82 STs inferred by STRUCTURE assuming K = 4 ancestral groups. Each vertical line represents an individual ST and indicates the proportion of ancestry<br />
from the four ancestral groups. (c) Host and life style. Human host is indicated by an open square, domesticated animal by an open triangle, wild animal by a black full<br />
triangle, captive animal by an orange full triangle and environmental host by an open hexagon. NP: Non-Pathogenic (d) STs that conform the major Clonal Complexes<br />
(containing five or more Mexican E. coli strains) i<strong>de</strong>ntified by eBURST are grouped by a solid line. (For interpretation of the references to colour in this figure legend, the rea<strong>de</strong>r<br />
is referred to the web version of this article.)
A. González-González et al. / Infection, Genetics and Evolution 13 (2013) 187–197 191<br />
Fig. 2. eBURST diagram displaying the comparative analysis between Mexican sample and E. coli MLST database. Clusters of linked isolates correspond to clonal complexes<br />
(CC). Primary foun<strong>de</strong>rs in the cluster are shown in blue and the subgroup foun<strong>de</strong>rs are shown in yellow. The size of each circle is proportional to the number of isolates with<br />
the same ST. STs found in both populations are circled in pink and the STs found only in the Mexican population are shown in green. CCs containing five or more Mexican<br />
strains are circled in red. (For interpretation of the references to colour in this figure legend, the rea<strong>de</strong>r is referred to the web version of this article.)<br />
Table 2<br />
Average number of nucleoti<strong>de</strong> differences within and between each phylogenetic group, host types and life styles.<br />
Phylogenetic group A + B1 B2 D E<br />
A + B1 27.8<br />
B2 53.2 29.8<br />
D 52.9 65.1 26.9<br />
E 43.1 56.2 44.4 0.5<br />
Host Animal Environment Human<br />
Animal 39.6<br />
Environment 38.4 35.4<br />
Human 39.5 37.9 39.6<br />
Life style Non-pathogenic Pathogenic<br />
Non-pathogenic 39.5<br />
Pathogenic 39.8 39.2<br />
3. Results<br />
3.1. Nucleoti<strong>de</strong>, ST and clonal complex diversity<br />
The nucleoti<strong>de</strong> diversity (p) among Mexican strains of E. coli<br />
ranged from <strong>0.0</strong>0588 (purA) to <strong>0.0</strong>2213 (fumC) with a mean value<br />
of <strong>0.0</strong>11 in concatenated genes. Across the 128 strains, Tajima’s D<br />
was not significant for any single locus nor for the concatenated sequences<br />
(Table 1).<br />
Based on the combination of alleles at the seven housekeeping<br />
gene fragments, 82 STs were recovered from the 128 strains. ST10<br />
was the most frequent, represented by 11 isolates (8.6% of the sample).<br />
The majority of STs (60 STs representing 46.8% of the total<br />
sample) occurred as singletons in the dataset.<br />
The Mexican sample adds 33 new STs to the E. coli MLST database<br />
(http://mlst.ucc.ie/mlst/dbs/Ecoli). From these new STs, 14<br />
STs were <strong>de</strong>rived from new combinations of previously reported<br />
alleles. A further 19 STs, were evi<strong>de</strong>nt from the sequencing of<br />
new gene alleles. These new haplotypes were <strong>de</strong>signated as<br />
ST2330 through ST2362 in the MLST database and distributed over<br />
the global genetic diversity of the species (Supplementary Fig. S3).<br />
eBURST analysis grouped 85 (66.4%) of the 128 Mexican strains<br />
into 21 clonal complexes (CCs) (Supplementary Table S1). Fifty one<br />
(39.8%) strains fell into six major CCs (those CCs that cluster at<br />
least five isolates) where ST10-Cplx is the dominant CC, clustering<br />
23 strains (18%) followed by ST394-Cplx, ST20-Cplx, ST29-Cplx and<br />
ST11-Cplx (Figs. 1 and 2).<br />
3.2. Phylogenetic inference, genetic differentiation and niche<br />
association<br />
ClonalFrame analysis clusters the Mexican STs into the four major<br />
phylogenetic groups comprising E. coli as species as divi<strong>de</strong>d into<br />
phylogenetic groups A + B1, B2, D and E. The majority of Mexican
192 A. González-González et al. / Infection, Genetics and Evolution 13 (2013) 187–197<br />
Table 3<br />
Recombination rates per phylogenetic group, lineage and clonal complex inferred by ClonalFrame analysis.<br />
Recombination events Mutation events Substitutions introduced by recombination q/h a r/m b<br />
Phylogenetic group<br />
A + B1 19 118 196 0.16 1.66<br />
B2 8 42 112 0.19 2.7<br />
D 13 25 99 0.52 3.96<br />
E 1 4 14 0.25 3.5<br />
Lineage<br />
A 7 25 60 0.28 2.4<br />
A-ST522 1 13 16 <strong>0.0</strong>8 1.26<br />
B1 9 67 85 0.13 1.27<br />
B1-ST86 1 6 9 0.16 1.46<br />
Clonal complex<br />
ST10-Cplx 4 8 30 0.5 3.75<br />
ST165-Cplx 0 5 0 NA c NA<br />
ST20-Cplx 1 2 4 0.5 2<br />
ST29-Cplx 0 3 0 NA NA<br />
ST28-Cplx 4 4 40 1 10<br />
ST69-Cplx 2 1 9 2 9<br />
ST394-Cplx 3 1 16 3 16<br />
a<br />
b<br />
c<br />
Relative frequency of occurrence of recombination as compared to point mutation in genetic diversification.<br />
Relative impact of recombination as compared to point mutation on the genetic differentiation of population.<br />
NA, not applicable.<br />
strains (71%) cluster in the A + B1 monophyletic group. Mexican<br />
E. coli is genetically structured as suggested by a significant F ST value<br />
of 0.50 (P < <strong>0.0</strong>5) and by the higher than average nucleoti<strong>de</strong> differences<br />
observed between phylogenetic groups, rather than<br />
within them (Table 2). Furthermore, we did not find a significant<br />
ecological niche association with any phylogenetic group, since<br />
no genetic differentiation due to host (animal, human and environment)<br />
or life style (pathogenic and non-pathogenic) was recovered.<br />
This was also pointed out by a similar average number of nucleoti<strong>de</strong><br />
differences among groups (Table 2) and by the AMOVA analysis<br />
performed (99.5% and 98.73% of genetic variation was within<br />
populations respectively).<br />
Despite the lack of statistical association of ecological traits at<br />
phylogenetic group level, we found that at lower phylogenetic levels,<br />
such as CCs, a clear host or lifestyle association prevails (Supplementary<br />
Table S1). For example, we found a correspon<strong>de</strong>nce<br />
to open environments in the ST86-Cplx and ST394-Cplx and to specific<br />
pathotypes and serotypes such as ST20-Cplx (EPEC O111:Hand<br />
O111ab:H-), ST29-Cplx (EHEC and EPEC O26:H-/H11) and<br />
ST11-Cplx (EHEC O157:H7, EPEC O55:H7/H-).<br />
3.3. Levels and patterns of homologous recombination<br />
Overall, the MLST nucleoti<strong>de</strong> diversity was generated mainly by<br />
homologous recombination events (q/h= 1.5 (95% CI [0.91, 2.58])<br />
producing more nucleoti<strong>de</strong> substitutions than point mutation (r/<br />
m= 3.24 (95% CI [2.1, 4.81]).<br />
Furthermore, we found that mutation and recombination estimates<br />
are different through all clustering levels (phylogenetic<br />
group, lineage and CCs) in which Mexican genetic diversity is<br />
organized.<br />
In <strong>de</strong>tail, homologous recombination has a more important role<br />
than point mutation in the genetic diversification of phylogenetic<br />
groups D and E (r/m = 3.96 and 3.5, respectively) than in lineage<br />
B1 (r/m = 1.27) and an intermediate impact in phylogenetic group<br />
B2 and lineage A (r/m = 2.7 and 2.4, respectively). Moreover,<br />
homologous recombination had a remarkable impact on the generation<br />
of genetic diversity of <strong>de</strong>termined CCs, such as ST28-Cplx,<br />
ST69-Cplx and ST394-Cplx. This was in contrast to other CCs, such<br />
as ST165-Cplx and ST29-Cplx where mutation is accounted for the<br />
diversity levels. On the other hand, recombination levels were<br />
intermediate in ST10-Cplx and ST20-Cplx (Table 3).<br />
Ignoring recombination in the reconstruction of Mexican genealogy<br />
permit us to <strong>de</strong>pict the effects of recombination in the phylogenetic<br />
signal (Supplementary Fig. S4). This analysis shows a<br />
clear separation between A and B1 sister lineages as well as a<br />
merging between D and E into one phylogenetic group due to<br />
recombination. Visual inspection of the events inferred by Clonal-<br />
Frame revealed that substitutions promoting the diversification of<br />
the Mexican sample are the result of differential mutation/recombination<br />
gene dynamics within each phylogenetic group, lineage<br />
and CC. On one hand, substitutions in B2, D and E occur more<br />
extensively throughout all genes. In contrast, the pattern present<br />
in A + B1 indicates that substitutions occur in specific genes for<br />
each lineage (Supplementary Fig. S5).<br />
In addition, intra-lineage recombination (measured as the number<br />
of recombination breakpoints per lineage) occurs more frequently<br />
in B1 and B2 than in E, and is intermediate in A and D<br />
(Table 4).<br />
STRUCTURE analysis revealed different levels of inter-lineage<br />
recombination as different admixture levels were found across<br />
phylogenetic groups (Fig. 1). In particular, there was higher admixture<br />
between lineages A and B1 and between B2 and D. Phylogenetic<br />
group E, however, did not exhibit a distinct ancestral<br />
source of polymorphism. Furthermore, the genetic diversity of this<br />
group is <strong>de</strong>rived mainly from groups B2 and D (contributing 57%<br />
and 24% of genetic diversity in Group E, respectively) (Fig. 1 and<br />
Supplementary Table S3).<br />
The high levels of homologous recombination previously <strong>de</strong>scribed<br />
were not sufficient to create random-association of alleles,<br />
as linkage disequilibrium (LD) was observed for all 128 E. coli<br />
strains (I S A = 0.304, P < <strong>0.0</strong>001) remaining significant when only<br />
STs were consi<strong>de</strong>red (I S A = 0.201, P < <strong>0.0</strong>001).<br />
3.4. Substructure in A + B1 phylogenetic group<br />
In <strong>de</strong>tail, four subgroups were i<strong>de</strong>ntified within phylogenetic<br />
group A + B1. Two of these subgroups correspond to A and B1 lineages,<br />
each with its own ancestral signature. The other two<br />
subgroups are recombinant lineages referred to as A-ST522 and<br />
B1-ST86. The first one comprises A Clermont strains with an
A. González-González et al. / Infection, Genetics and Evolution 13 (2013) 187–197 193<br />
Table 4<br />
Recombination breakpoints estimated by GARD algorithm per gene, per lineage, per phylogenetic group and for the total sample.<br />
Gene<br />
Length (bp) a<br />
Number of point break <strong>de</strong>tected Position b Dc-AIC c<br />
adk 534 1 333 ⁄⁄⁄ 73.16<br />
fumC 465 1 225 ⁄⁄⁄ 108.5<br />
gyrB 459 1 216 ⁄⁄⁄ 134.7<br />
icd 516 1 354 ⁄⁄⁄ 111.8<br />
mdh 450 0 0 0<br />
purA 474 0 0 0<br />
recA 507 0 0 0<br />
Phylogenetic group<br />
A + B1 3405 4 534 ⁄⁄⁄ , 1185 ⁄⁄⁄ , 1974 ⁄⁄⁄ , 2784 ⁄⁄⁄ 2041.3<br />
B2 3405 6 525, 900 ⁄⁄⁄ , 1455 ⁄⁄⁄ , 2112 ⁄⁄⁄ , 2685, 2865 418.5<br />
D 3405 5 987 ⁄⁄⁄ , 1416, 1722, 2268 ⁄⁄⁄ , 2799 ⁄⁄⁄ 217.2<br />
E 3405 NA d NA NA<br />
Lineage<br />
A 3405 2 1554 ⁄⁄⁄ , 1921 ⁄⁄⁄ 79.60<br />
A-ST522 3405 2 1554 ⁄⁄⁄ , 2121 17.56<br />
B1 3405 4 915 ⁄⁄⁄ , 1470 ⁄⁄⁄ , 1977 ⁄⁄⁄ , 2742 ⁄⁄⁄ 988.90<br />
B1-ST86 3405 0 0 0<br />
Total sample 3405 4 534 ⁄⁄⁄ , 1426 ⁄⁄⁄ , 1974 ⁄⁄⁄ , 2799 ⁄⁄⁄ 3340.8<br />
a<br />
Number of base pair of protein coding region amplified.<br />
b Each number indicates the nucleoti<strong>de</strong> position into the alignment. Bold numbers points out the statistically significant positions by SH test. ⁄⁄⁄ p = <strong>0.0</strong>1,<br />
⁄⁄ p = <strong>0.0</strong>5.<br />
c Dc-AIC indicates the difference in the AIC between the non recombination mo<strong>de</strong>l (single-tree mo<strong>de</strong>l) and the best recombination mo<strong>de</strong>l.<br />
d NA, not applicable.<br />
AxB1 ancestry and the second, clusters A and B1 Clermont strains<br />
with ABD ancestry. Two ungrouped STs (ST2332 and ST2336) were<br />
also found within A + B1, corresponding respectively to A and B1<br />
Clermont strains with an ABD ancestry (Fig. 1 and Supplementary<br />
Table S3).<br />
Despite A + B1 clusters the majority of STs, its genetic diversity<br />
levels are i<strong>de</strong>ntical to those present in D and lower than those harboured<br />
by B2 phylogenetic groups. Likewise, Mexican A + B1<br />
exhibits complex selective dynamics, as positive and purifying<br />
selection is differentially acting upon certain genes insi<strong>de</strong> this phylogenetic<br />
group. In particular, the mdh gene shows significantly positive<br />
Tajima’s D value in A + B1 (2.41, P < <strong>0.0</strong>5), fumC gene displays<br />
a significantly negative Tajima’s D value in A-ST522 (-2.38,<br />
P < <strong>0.0</strong>1) and icd gene a significantly positive Tajima’s D value in<br />
B1-ST86 (3.02, P < <strong>0.0</strong>1).<br />
4. Discussion<br />
In this study we investigate the genetic diversification mechanisms<br />
of non-outbreak related E. coli isolates from Mexico. Overall,<br />
levels of genetic diversity harboured by multilocus sequences typing<br />
(MLST) genes are explained mainly by homologous recombination<br />
rather than by point mutation. Since genetic diversity is<br />
hierarchically organized according to the MLST genealogy, we observed<br />
that there is not a homogeneous recombination rate, but<br />
that different rates emerge at different clustering levels such as<br />
phylogenetic group, lineage and clonal complex (CC). We propose<br />
this finding as an alternative explanation for the maintenance of<br />
the phylogenetic signal of this species <strong>de</strong>spite the prevalence of<br />
homologous recombination.<br />
4.1. The recombinant nature of diversity in Mexican E. coli<br />
Our results suggest that recombination is the main molecular<br />
process involved in the generation of Mexican nucleoti<strong>de</strong> diversity.<br />
Levels of polymorphism and recombination are consistent with<br />
previously reported values for wild animal E. coli isolates from<br />
Mexico (Peek et al., 2001). This is also the case among different<br />
samples (environmental, different pathogenic types and host-wi<strong>de</strong><br />
range samples) and other housekeeping genes (Reid et al., 2000;<br />
Feil et al., 2001; Wirth et al., 2006; Walk et al., 2007; Jaureguy<br />
et al., 2008; Touchon et al., 2009; Okeke et al., 2010; Bergholz<br />
et al., 2011).<br />
Despite the homologous recombination levels found, linkage<br />
disequilibrium (LD) prevails across the sample suggesting a clonal<br />
population structure for Mexican E. coli (Maynard-Smith et al.,<br />
1993). This could be explained by the relative impact of recombination<br />
on the genetic diversification as compared to point mutation.<br />
Thus, although more nucleoti<strong>de</strong>s become substituted by each<br />
recombination event in contrast to point mutation, the frequency<br />
of homologous recombination events in the Mexican sample is<br />
not sufficient to promote a random assortment of alleles at the different<br />
loci analyzed. This is not surprising since it has been proposed<br />
that recombination must be 10–20 times higher than point<br />
mutation in or<strong>de</strong>r to reflect linkage equilibrium (Maynard-Smith<br />
et al., 1993).<br />
Alternatively, Touchon et al. (2009) address this clonal paradigm<br />
applying coalescent simulations and Bayesian calculations<br />
to the core genome, proposing that recombination events occur<br />
within short fragments (50 bp on average). Thus, an apparent clonal<br />
population structure and a clear phylogenetic signal are recovered,<br />
<strong>de</strong>spite a higher recombination rate than mutation rate.<br />
However, our data and a recent whole genome study suggest an<br />
average tract length higher (380 bp long; 95% CI [249.8,<br />
568.98 pb]; this study; 542 bp long; Di<strong>de</strong>lot et al., 2012). This data<br />
could suggest that even when the average tract length of recombination<br />
is large, a clonal population structure can be <strong>de</strong>picted. Nevertheless,<br />
comparative algorithm analysis should be performed in<br />
or<strong>de</strong>r to shed more light on this topic.<br />
4.2. Inter and intra-lineage recombination and genetic structure<br />
From a population dynamics perspective, Maynard-Smith et al.<br />
(1993) explain that linkage disequilibrium can also be found in a<br />
cryptically subdivi<strong>de</strong>d population. This occurs when recombination<br />
is more frequent within subpopulations than between them,<br />
because populations are isolated from each other geographically,<br />
ecologically or temporally. Due to this isolation different
194 A. González-González et al. / Infection, Genetics and Evolution 13 (2013) 187–197<br />
populations of the same species may exhibit different genetic substructures<br />
(Holmes et al., 1999) associated to different genetic<br />
diversification processes.<br />
In general, our study indicates that the diversification of E. coli is<br />
associated with particular levels of recombination within each phylogenetic<br />
group. This result agreed with previous reports corresponding<br />
to E. coli on a global scale and samples from Nigeria<br />
(Wirth et al., 2006; Okeke et al., 2010). Nevertheless, our study also<br />
indicates that the different patterns and levels of intra and interlineage<br />
recombination <strong>de</strong>scribed in this work, could explain the significant<br />
values of genetic structure recovered. Specifically, each<br />
phylogenetic group displays its own genetic signature (intralineage<br />
recombination differentiates the gene pool of the species),<br />
while preserving a common genetic background (inter-lineage<br />
recombination homogenizes it). Moreover, our results suggest that<br />
at phylogenetic level, homologous recombination is both acting as a<br />
homogenizing and as diversifying process (Supplementary Fig. S4).<br />
Furthermore, we observed signatures of genetic structure insi<strong>de</strong><br />
the A + B1 phylogenetic group (substructure). To date, evi<strong>de</strong>nce of<br />
genetic substructure among phylogenetic groups of E. coli has only<br />
been reported within B2 as nine subgroups correlating to genetic<br />
and ecological diversity were <strong>de</strong>tected (Le Gall et al., 2007). The<br />
fact that A + B1 consists of fewer lineages and has lower levels of<br />
nucleoti<strong>de</strong> diversity than B2 could be attributed to the recent<br />
emergence of A + B1, in contrast to the early emergence of B2<br />
(Touchon et al., 2009; Tenaillon et al., 2010; Denamur et al.,<br />
2010; Perna, 2011).<br />
4.3. Ecological structure and clonal complexes<br />
It has been suggested that ecological and adaptive mechanisms<br />
could represent barriers to recombination (sexual isolation) between<br />
bacterial lineages (Koeppel et al., 2008). Our analysis does<br />
not support the existence of such ecological sexual isolation between<br />
the Mexican E. coli phylogenetic groups as also suggested<br />
by recent works (Tenaillon et al., 2010; Clermont et al., 2011;<br />
White et al., 2011). Nevertheless, ecological barriers in E. coli have<br />
been proposed at higher phylogenetic levels (Luo et al., 2011).<br />
Hence, <strong>de</strong>termining in a phylogeny the clustering level that corresponds<br />
to an ecologically distinct population or ecotype, can be<br />
difficult because of the hierarchical nature of genetic diversity with<br />
subclusters within clusters and so on (Cohan and Perry, 2007;<br />
Koeppel et al., 2008; Cohan and Kopac, 2011). In this work, using<br />
a population genetics approach we found that Mexican E. coli genetic<br />
diversity is hierarchically organized and that CCs are the clustering<br />
level corresponding to an ecotype. Previous studies have<br />
suggested the existence of ecotypes in E. coli (Souza et al., 1999;<br />
Gordon and Cowling, 2003; Jaureguy et al., 2008). In our study,<br />
we found that such CCs are associated to specific hosts or life styles<br />
and different recombination rates. Therefore, CCs might provi<strong>de</strong><br />
evi<strong>de</strong>nce for a mechanism of ecological isolation.<br />
In line with the global distribution of E. coli (MLST database), we<br />
found CCs clearly associated to certain pathotypes and serotypes.<br />
In <strong>de</strong>tail, our results suggest that pathogenesis is coupled to different<br />
mutation and recombination diversification dynamics. Accordingly,<br />
CCs associated to highly pathogenic E. coli strains<br />
(represented in this sample by ST11-Cplx, O157:H7 and O55:H7/<br />
H-) are coupled with higher recombination rates. In contrast to<br />
the latter, CCs as ST20-Cplx (O111) and ST29-Cplx (O26), previously<br />
associated with less pathogenic E. coli strains (Bielaszewska<br />
et al., 2008), are affiliated with intermediate and low rates of<br />
recombination respectively.<br />
Since serotypes elicit a particular interaction between the host<br />
and its immune system (Orskov and Orskov, 1992; Whitfield,<br />
2006), competition between strains within the host might be<br />
preventing an interaction among strains that belong to different<br />
serotypes. Consequently, serotype can act as an ecological barrier<br />
to recombination (Buckee et al., 2008).<br />
We also found evi<strong>de</strong>nce of environmental ecotypes in the Mexican<br />
sample. In particular, ST86-Cplx inclu<strong>de</strong>s air and water isolates<br />
from Mexico as well as samples from marine intertidal<br />
sediment in Hong Kong. As in the fresh water beach ET-1 B1 cla<strong>de</strong><br />
(Walk et al., 2007), natural selection is probably favoring the recombinant<br />
nature exhibited by ST86-Cplx (ABD ancestry). Furthermore,<br />
our results suggest that homologous recombination and<br />
positive selection within this CC are promoting the diversification<br />
of the icd gene, a gene involved in the transition from an anaerobic<br />
to an aerobic niche (Partridge et al., 2006).<br />
In Mexico, we found that the domestication status and diet of<br />
animals could be <strong>de</strong>lineating ecotypes in B2 and D groups since<br />
CCs associated to wild carnivorous (ST69-Cplx), granivorous and<br />
nectarivorous animals (ST28-Cplx) were recovered. Interestingly,<br />
these CCs are coupled to the highest recombination rates reported<br />
in this study, thus explaining the low levels of LD previously reported<br />
for wild animals in Mexico (Souza et al., 2002b). It is important<br />
to mention that at a global scale, ST69-Cplx or the E. coli clonal<br />
group A (CGA) is consi<strong>de</strong>red one of the major CCs associated with<br />
urinary tract infections (Tartof et al., 2005; Johnson et al., 2006)<br />
and an emergent, antimicrobial drug-resistant extra-intestinal<br />
pathogen (Johnson et al., 2011). Thus our findings reinforce the<br />
i<strong>de</strong>a that wild animals could be a reservoir of antibiotic resistance<br />
as previously suggested (Allen et al., 2010). Nevertheless, more <strong>de</strong>tailed<br />
studies focused on this human health relevant CC should be<br />
performed.<br />
The existence of environmental and wild animal-associated CCs<br />
coupled with extreme recombination levels, supports evi<strong>de</strong>nce<br />
that the evolution of E. coli can also occur via recombination linked<br />
to adaptive traits other than pathogenesis, such as environment,<br />
commensalism or specific host diet.<br />
On the other hand, we found CCs associated to different pathotypes,<br />
serotypes, host types and environments such as ST10-Cplx.<br />
This CC contains the most common ST (ST10) recovered both in<br />
Mexico and at a global scale (Fig. 2; Turner et al., 2006; Lau<br />
et al., 2008; Okeke et al., 2010). This worldwi<strong>de</strong> prevalence could<br />
suggest some selective advantage, probably coupled to the ‘‘generalist’’<br />
faculty of this CC. Since it has been proposed that intermittent<br />
host change can exert <strong>de</strong>creasing population sizes (Fraser<br />
et al., 2007), the role of genetic drift should be also taken into account<br />
in further studies.<br />
Consi<strong>de</strong>ring that any given phylogenetic group consists of many<br />
CCs, the status of A strains has been questioned and should be better<br />
thought of as a CC (Gordon et al., 2008). However, in this study,<br />
the presence of another CC (ST165-Cplx, clustering mainly EIEC human<br />
isolates) in addition to ST10-Cplx, confirms the phylogenetic<br />
status of group A. Moreover, on a global scale, group A is comprised<br />
of additional CCs, as reported in the MLST database (ST46-Cplx,<br />
ST168-Cplx, ST184-Cplx, ST226-Cplx).<br />
All the above suggest that we can <strong>de</strong>scribe the evolutionary<br />
dynamics of our sample by an epi<strong>de</strong>mic population structure,<br />
where adaptive CCs are superimposed on a background population<br />
ma<strong>de</strong> up of recombinant singleton STs. To elucidate in <strong>de</strong>tail the<br />
evolutionary dynamics of each CC, consi<strong>de</strong>ration of other parameters<br />
(besi<strong>de</strong>s recombination and mutation frequencies and ecological<br />
associations) such as changes in population size and the<br />
adaptive value of genetic diversity, is essential. This will facilitate<br />
an un<strong>de</strong>rstanding of whether genetic drift and/or natural selection<br />
are responsible for the maintenance and evolution of such CCs.<br />
4.4. Geographic structure and epi<strong>de</strong>miological surveillance<br />
The genetic structure of E. coli Mexican strains is difficult to<br />
explain according to geographic barriers. This is because the life
A. González-González et al. / Infection, Genetics and Evolution 13 (2013) 187–197 195<br />
history of the species shows that migration is an important component<br />
of its ecology (Kaper et al., 2004; van Elsas et al., 2011).<br />
It has been suggested that due to the high migration rates maintained<br />
by E. coli, a large proportion of the global diversity can be<br />
<strong>de</strong>tected locally, pointing towards the presence of a homogenised<br />
global pool (Caugant et al., 1981; Whittam et al., 1983; Maynard-<br />
Smith et al., 2000). Nevertheless, a variable prevalence of phylogenetic<br />
groups among different hosts and geographic regions<br />
(Tenaillon et al., 2010) could suggest that there is a slight <strong>de</strong>gree<br />
of ecological structure at large geographical scales.<br />
Likewise, it is possible that each region has a different immunological<br />
context. Hence, this explains why E. coli serotypes seem to<br />
be less virulent in Mexico than in Europe and the USA. For example,<br />
obligatory pathogens such as EHEC O157:H7 belonging to E lineage<br />
are responsible for hemorrhagic colitis and haemolytic-uremic<br />
syndrome in those countries (Nataro and Kaper, 1998; Watanabe<br />
et al., 1996). The low recovery and the non-epi<strong>de</strong>mic potential of<br />
lineage E in Mexico (this work; Paniagua et al., 2007) could be related<br />
to the acquisition of antibodies against serogroup O157 or related<br />
E. coli lipopolysacchari<strong>de</strong>s during infancy (Navarro et al.,<br />
2003). Likewise, it has been shown that Mexican children <strong>de</strong>velop<br />
high levels of antibodies against the main EPEC virulence factors<br />
via maternal colostrum, supporting the importance of breastfeeding<br />
in areas of the world where bacterial diarrhoeagenic disease<br />
is en<strong>de</strong>mic (Parissi-Crivelli et al., 2000).<br />
In this context, this work emphasizes the importance of investigations<br />
that explore microevolutionary processes at a local scale.<br />
Such studies can provi<strong>de</strong> valuable information addressing the <strong>de</strong>tails<br />
of the evolutionary scenario and genetic reservoirs un<strong>de</strong>rlying<br />
the emergence of CCs with epi<strong>de</strong>miological relevance.<br />
5. Conclusions<br />
In this study we investigated the genetic diversification mechanisms<br />
of Mexican non-outbreak related E. coli strains isolated from<br />
a host wi<strong>de</strong> range. Overall, levels of genetic diversity harboured by<br />
MLST genes are explained principally by homologous recombination<br />
rather than by point mutation. Furthermore, we observed that<br />
there is not a homogeneous rate of recombination and mutation,<br />
but that different rates emerge at different clustering levels of<br />
diversity such as phylogenetic group, lineage and CC.<br />
These findings suggest an alternative explanation for the maintenance<br />
of the clear phylogenetic signal of E. coli <strong>de</strong>spite the prevalence<br />
of homologous recombination.<br />
It is important to point out that all the findings and proposals<br />
stated in this study were obtained from an MLST scheme and that<br />
a whole genome approach would give more accurate and <strong>de</strong>tailed<br />
results. However, a recently published whole genome analysis reports<br />
similar rates and patterns of recombination for E. coli, supporting<br />
our findings (Di<strong>de</strong>lot et al., 2012). Likewise, although<br />
there are different MLST schemes <strong>de</strong>veloped for typing E. coli, it<br />
is known that the same phylogenetic groups comprising the species<br />
are recovered whatever the MLST scheme used (Escobar-Páramo<br />
et al., 2004; Johnson et al, 2006; Wirth et al., 2006; Walk et al.,<br />
2007; Jaureguy et al., 2008; Gordon et al., 2008). According to this<br />
we <strong>de</strong>ci<strong>de</strong>d to use the MLST scheme <strong>de</strong>veloped by Wirth et al.<br />
(2006) because it allowed us to carry out a more robust epi<strong>de</strong>miological<br />
analysis, since this database is larger and more diverse than<br />
the other databases.<br />
Moreover <strong>de</strong>spite the weak signal of substructure among some<br />
phylogenetic groups (B2, D and E), the presence of CCs (associated<br />
with particular life style and hosts as well as different genetic<br />
diversification processes) insi<strong>de</strong> them might indicate differential<br />
genetic diversification processes within each phylogenetic group.<br />
Such pattern would suggest that all phylogenetic groups of E. coli<br />
within Mexico are sub-structured. Interestingly, recent whole genome<br />
studies (Leopold et al., 2011; Di<strong>de</strong>lot et al., 2012) have <strong>de</strong>monstrated<br />
that intra-lineage recombination is more frequent than<br />
inter-lineage genetic exchanges. These results not only supports<br />
the patterns of substructure and processes <strong>de</strong>scribed in this study,<br />
but also suggests that it could be exten<strong>de</strong>d to the whole species.<br />
Finally, it has been previously observed that using only typing<br />
methods can erroneously cluster E. coli genotypes (Gordon et al.,<br />
2008). Thus, we strongly recommend the combined use of population<br />
genetics and phylogenetic approaches in evolutionary and epi<strong>de</strong>miological<br />
studies of local E. coli samples.<br />
Acknowledgments<br />
We thank Jaime Gasca, Bio9l. José Luis Mén<strong>de</strong>z, Laura Espinosa<br />
and Dra. Erika Aguirre for technical support during the <strong>de</strong>velopment<br />
of this project. We thank Laboratorio <strong>de</strong> Genética Bacteriana<br />
at Facultad <strong>de</strong> Medicina, Universidad Nacional Autónoma <strong>de</strong> México<br />
for infrastructure support during the <strong>de</strong>velopment of this project.<br />
We thank Dr. Xavier Di<strong>de</strong>lot for his advice in the use of<br />
ClonalFrame software. We thank Christine Rooks, Santiago Ramírez,<br />
Eria Rebollar, Morena Avitia, René Cerritos, Rodolfo Salas and<br />
Alejandra Vázquez-Lobo for their constructive reviews of the manuscript.<br />
This paper is part of the doctoral research of the first<br />
author, who thanks the Doctorado en Ciencias Biomédicas (Universidad<br />
Nacional Autónoma <strong>de</strong> México) and CONACYT (Grant<br />
No. 169917) for financial support. The project was supported by<br />
Grant DGPA-<strong>UNAM</strong> PAPIIT IN219109.<br />
Appendix A. Supplementary data<br />
Supplementary data associated with this article can be found, in<br />
the online version, at http://dx.doi.org/10.1016/j.meegid.<br />
2012.09.003.<br />
References<br />
Achtman, M., Zurth, K., Morelli, G., Torrea, G., Guiyoule, A., Carniel, E., 1999. Yersinia<br />
pestis, the cause of plague, is a recently emerged clone of Yersinia<br />
pseudotuberculosis. Proc. Natl. Acad. Sci. USA 96, 14043–14048.<br />
Allen, H.K., Donato, J., Wang, H.H., Cloud-Hansen, K.A., Davies, J., Han<strong>de</strong>lsman, J.,<br />
2010. Call of the wild: antibiotic resistance genes in natural environments. Nat.<br />
Rev. Microbiol. 8, 251–259.<br />
Bergholz, P.W., Noar, J.D., Buckely, D.H., 2011. Environmental patterns are imposed<br />
on the population structure of Escherichia coli after fecal <strong>de</strong>position. Appl.<br />
Environ. Microbiol. 77, 129–211.<br />
Bielaszewska, M., Mid<strong>de</strong>ndorf, B., Köck, R., Friedrich, A.W., Fruth, A., Karch, H.,<br />
Schmidt, M.A., Mellmann, A., 2008. Shiga toxin-negative attaching and effacing<br />
Escherichia coli: distinct clinical associations with bacterial phylogeny and<br />
virulence traits and inferred in-host pathogen evolution. Clin. Infect. Dis. 47,<br />
208–217.<br />
Buckee, C.O., Jolley, K.A., Recker, M., Penman, B., Kriz, P., Gupta, S., Mai<strong>de</strong>n, M.C.J.,<br />
2008. Role of selection in the emergence of lineages and the evolution of<br />
virulence in Neisseria meningitidis. Proc. Natl. Acad. Sci. USA 105, 15082–15087.<br />
Caugant, D.A., Levin, B.R., Selan<strong>de</strong>r, R.K., 1981. Genetic diversity and temporal<br />
variation in the E. coli population of a human host. Genetics 98, 467–490.<br />
Clermont, O., Bonacorsi, S., Bingen, E., 2000. Rapid and simple <strong>de</strong>termination of the<br />
Escherichia coli phylogenetic group. Appl. Environ. Microbiol. 66, 4555–4558.<br />
Clermont, O., Olier, M., Hoe<strong>de</strong>, C., Diancourt, L., Brisse, S., Kerou<strong>de</strong>an, M., Glodt, J.,<br />
et al., 2011. Animal and human pathogenic Escherichia coli strains share<br />
common genetic backgrounds. Infect. Genet. Evol. 11, 654–662.<br />
Cohan, F.M., Kopac, S.M., 2011. Microbial genomics: E. coli relatives out of doors and<br />
out of body. Curr. Biol. 21, R587–R589.<br />
Cohan, F.M., Perry, E.B., 2007. A systematics for discovering the fundamental units<br />
of bacterial diversity. Curr. Biol. 17, R373–R386.<br />
Denamur, E., Picard, B., Tenaillon, O., 2010. Population genetics of pathogenic<br />
Escherichia coli. In: Robinson, D.A., Falush, D., Feil, E.J. (Eds.), Bacterial Population<br />
Genetics in Infectious Diseases. Wiley-Blackwell, West Sussex, United Kingdom,<br />
pp. 269–286.<br />
Di<strong>de</strong>lot, X., Falush, D., 2007. Inference of bacterial microevolution using multilocus<br />
sequence data. Genetics 175, 1251–1266.<br />
Di<strong>de</strong>lot, X., Meric, G., Falush, D., Darling, A.E., 2012. Impact of homologous and nonhomologous<br />
recombination in the genomic evolution of Escherichia coli. BMC<br />
Genomics 13, 256.
196 A. González-González et al. / Infection, Genetics and Evolution 13 (2013) 187–197<br />
Duriez, P., Clermont, O., Bonacorsi, S., Bingen, E., Chaventré, A., Elion, J., Picard, B.,<br />
Denamur, E., 2001. Commensal Escherichia coli isolates are phylogenetically<br />
distributed among geographically distinct human populations. Microbiology<br />
147, 1671–1676.<br />
Escobar-Páramo, P., Clermont, O., Blanc-Potard, A.B., Bui, H., Le Bouguénec, C.,<br />
Denamur, E., 2004. A specific genetic background is required for acquisition and<br />
expression of virulence factors in Escherichia coli. Mol. Biol. Evol. 21, 1085–1094.<br />
Estrada-Garcia, T., Lopez-Saucedo, C., Thompson-Bonilla, R., et al., 2009. Association<br />
of diarrheagenic Escherichia coli pathotypes with infection and diarrhea among<br />
Mexican children and association of atypical enteropathogenic E. coli with acute<br />
diarrhea. J. Clin. Microbiol. 47, 93–98.<br />
Evanno, G., Regnaut, S., Gou<strong>de</strong>t, J., 2005. Detecting the number of clusters of<br />
individuals using the software structure: a simulation study. Mol. Ecol. 14,<br />
2611–2620.<br />
Ewing, B., Hillier, L., Wendi, M.C., Green, P., 1998. Base-calling of automated<br />
sequencer traces using phred I. Accuracy assessment. Genome. Res. 8, 175–185.<br />
Excoffier, L., Laval, G., Schnei<strong>de</strong>r, S., 2005. Arlequin (version 3.0): an integrated<br />
software package for population genetics data analysis. Evol. Bioinform. Online<br />
1, 47–50.<br />
Feil, E.J., 2004. Small change: keeping pace with microevolution. Nat. Rev. Microbiol.<br />
2, 483–495.<br />
Feil, E.J., 2010. Linkage, selection, and the clonal complex. In: Robinson, D.A., Falush,<br />
D., Feil, E.J. (Eds.), Bacterial Population Genetics in Infectious Diseases. Wiley-<br />
Blackwell, West Sussex, United Kingdom, pp. 19–35.<br />
Feil, E.J., Holmes, E.C., Bessen, D.E., Chan, M.S., Day, N.P., Enright, M.C., Goldstein, R.,<br />
Hood, D.W., Kalia, A., Moore, C.E., et al., 2001. Recombination within natural<br />
populations of pathogenic bacteria: short term empirical estimates and longterm<br />
phylogenetic consequences. Proc. Natl. Acad. Sci. USA 98, 182–187.<br />
Feil, E.J., Li, B.C., Aanensen, D.M., Hanage, W.P., Spratt, B.G., 2004. EBURST: inferring<br />
patterns of evolutionary <strong>de</strong>scent among clusters of related bacterial genotypes<br />
from multilocus sequence typing data. J. Bacteriol. 186, 1518–1530.<br />
Fraser, C., Hanage, W.P., Spratt, B.G., 2007. Recombination and the nature of<br />
bacterial speciation. Science 315, 476–480.<br />
Gelman, A., Rubin, D.B., 1992. Inference from iterative simulation using multiple<br />
sequences. Statist. Sci. 7, 457–472.<br />
Gordon, D., Abajian, C., Green, P., 1998. Consed: a graphical tool for sequence<br />
finishing. Genome Res. 8, 195–202.<br />
Gordon, D.M., Clermont, O., Tolley, H., Denamur, E., 2008. Assigning Escherichia coli<br />
strains to phylogenetic groups: multi-locus sequence typing versus the triplex<br />
method. Environ. Microbiol. 10, 2484–2496.<br />
Gordon, D.M., Cowling, A., 2003. The distribution and genetic structure of<br />
Escherichia coli Australian vertebrates: host and geographic effects.<br />
Microbiology 12, 3575–3586.<br />
Goullet, P., Picard, B., 1989. Comparative electrophoretic polymorphism of esterases<br />
and other enzymes in Escherichia coli. J. Gen. Microbiol. 135, 135–143.<br />
Hall, T.A., 1999. BioEdit: a user-friendly biological sequence alignment editor and<br />
analysis program for Windows 95/98/NT. Nucleic Acids Symp. Ser. 41, 95–98.<br />
Haubold, B., Hudson, R.R., 2000. LIAN 3.0: <strong>de</strong>tecting linkage disequilibrium in<br />
multilocus data. Bioinformatics 16, 847–849.<br />
Herzer, P., Inouye, S., Inouye, M., Whittam, T.S., 1990. Phylogenetic distribution of<br />
branched RNA-linked multicopy single-stran<strong>de</strong>d DNA among natural isolates of<br />
Escherichia coli. J. Bacteriol. 172, 6175–6181.<br />
Holmes, E.C., Urwin, R., Mai<strong>de</strong>n, M.C., 1999. The influence of recombination on the<br />
population structure and evolution of the human pathogen Neisseria<br />
meningitidis. Mol. Biol. Evol. 16, 741–749.<br />
Jaureguy, F., Landraud, L., Passet, V., Diancourt, L., Frapy, E., Guigon, G., Carbonnelle,<br />
E., Lortholary, O., Clermont, O., Denamur, E., et al., 2008. Phylogenetic and<br />
genomic diversity of human bacteremic Escherichia coli strains. BMC Genomics<br />
9, 560–573.<br />
Johnson, J.R., Menard, M.E., Lau<strong>de</strong>rdale, T.-L., Kosmidis, C.H., Gordon, D., Collignon,<br />
P., Maslow, J.N., Tambic-Andrasevic, A., Kuskowski, M.A.Trans-Global Initiative<br />
for Antimicrobial Resistance Analysis Investigators, 2011. Global distribution<br />
and epi<strong>de</strong>miologic associations of Escherichia coli clonal group A, 1998–2007.<br />
Emerg. Infect. Dis. 17, 2001–2009.<br />
Johnson, J.R., Owens, K.L., Clabots, C.R., Weissman, S.J., Cannon, S.B., 2006.<br />
Phylogenetic relationships among clonal groups of extraintestinal pathogenic<br />
Escherichia coli as assessed by multi-locus sequence analysis. Microbes Infect. 8,<br />
1702–1713.<br />
Kaper, J.B., Nataro, J.P., Mobley, H.L., 2004. Pathogenic Escherichia coli. Nat. Rev.<br />
Microbiol. 2, 123–140.<br />
Koeppel, A., Perry, E.B., Sikorski, J., Krizanc, D., Warner, W.A., Ward, D.M., Rooney,<br />
A.P., Brambilla, E., Connor, N., Ratcliff, R.M., et al., 2008. I<strong>de</strong>ntifying the<br />
fundamental units of bacterial diversity: a paradigm shift to incorporate<br />
ecology into bacterial systematics. Proc. Natl. Acad. Sci. USA 105, 2504–2509.<br />
Lau, S.H., Reddy, S., Cheesbrough, J., Bolton, F.J., Willshaw, G., Cheasty, T., Fox, A.J.,<br />
Upton, M., 2008. Major uropathogenic Escherichia coli strain isolated in the<br />
northwest of England i<strong>de</strong>ntified by multilocus sequence typing. J. Clin.<br />
Microbiol. 46, 1076–1080.<br />
Le Gall, T., Clermont, O., Gouriou, S., Picard, B., Nassif, X., et al., 2007. Extraintestinal<br />
virulence is a coinci<strong>de</strong>ntal by-product of commensalism in B2 phylogenetic<br />
group Escherichia coli strains. Mol. Biol. Evol. 24, 2373–2384.<br />
Leopold, S.R., Sawyer, S.A., Whittam, T.S., Tarr, P.I., 2011. Obscured phylogeny and<br />
possible recombinational dormancy in Escherichia coli. BMC Evol. Biol. 11, 183–<br />
191.<br />
Levin, B.R., 1981. Periodic selection, infectious gene exchange and the genetic<br />
structure of E. coli populations. Genetics 99, 1–23.<br />
López-Saucedo, C., Cerna, J.F., Villegas-Sepulveda, N., Thompson, R., Velazquez, F.R.,<br />
Torres, J., Tarr, P.I., Estrada-García, T., 2003. Single multiplex polymerase chain<br />
reaction to <strong>de</strong>tect diverse loci associated with diarrheagenic Escherichia coli.<br />
Emerg. Infect. Dis. 9, 127–131.<br />
Luo, C., Walk, S.T., Gordon, D.M., Feldgar<strong>de</strong>n, M., Tiedje, J.M., Konstantinidis, K.T.,<br />
2011. Genome sequencing of environmental Escherichia coli expands<br />
un<strong>de</strong>rstanding of the ecology and speciation of the mo<strong>de</strong>l bacterial species.<br />
Proc. Natl. Acad. Sci. USA 108, 7200–7205.<br />
Mai<strong>de</strong>n, M.C.J., Bygraves, J.A., Feil, E., Morelli, G., Russell, J.E., Urwin, R., Zhang, Q.,<br />
Zhou, J., Zurth, K., Caugant, D.A., Feavers, I.M., Achtman, M., Spratt, B.G., 1998.<br />
Multilocus sequence typing: a portable approach to the i<strong>de</strong>ntification of clones<br />
within populations of pathogenic microorganisms. Proc. Natl. Acad. Sci. USA 95,<br />
3140–3145.<br />
Maynard-Smith, J.M., Feil, E., Smith, N., 2000. Population structure and evolutionary<br />
dynamics of pathogenic bacteria. BioEssays 22, 1115–1122.<br />
Maynard-Smith, J.M., Smith, N.H., O’Rourke, M., Spratt, B.G., 1993. How clonal are<br />
bacteria Proc. Natl. Acad. Sci. USA 90, 4384–4388.<br />
Nataro, J.P., Kaper, J.B., 1998. Diarrheagenic Escherichia coli. Clin. Microbiol. Rev. 11,<br />
142–201.<br />
Navarro, A., Eslava, C., Hernan<strong>de</strong>z, U., Navarro-Henze, J.L., Aviles, M., Garcia-<strong>de</strong> la<br />
Torre, G., Cravioto, A., 2003. Antibody responses to Escherichia coli O157 and<br />
other lipopolysacchari<strong>de</strong>s in healthy children and adults. Clin. Diagn. Lab.<br />
Immunol. 10, 797–801.<br />
Nicklasson, M., Klena, J., Rodas, C., Bourgeois, A.L., Tores, O., et al., 2010.<br />
Enterotoxigenic Escherichia coli multilocus sequence types in Guatemala and<br />
Mexico. Emerg. Infect. Dis. 16, 143–146.<br />
Okeke, I.N., Wallace-Gads<strong>de</strong>n, F., Simons, H.R., Matthews, N., Labar, A.S., Hwang, J.,<br />
Wain, J., 2010. Multi-locus sequence typing of enteroaggregative Escherichia coli<br />
isolates from Nigerian children uncovers multiple lineages. PLoS One 5, e14093.<br />
Orskov, F., Orskov, I., 1984. Serotyping of Escherichia coli. Methods Microbiol. 14,<br />
43–112.<br />
Orskov, F., Orskov, I., 1992. Escherichia coli serotyping and disease in man and<br />
animals. Can. J. Microbiol. 38, 699–704.<br />
Paniagua, G.L., Monroy, E., García-González, O., Alonso, J., Negrete, E., Vaca, S., 2007.<br />
Two or more enteropathogens are associated with diarrhoea in Mexican<br />
children. Ann. Clin. Microbiol. Antimicrob. 6, 17–24.<br />
Parissi-Crivelli, A., Parissi-Crivelli, J., Girón, J., 2000. Recognition of enteropathogenic<br />
Escherichia coli virulence <strong>de</strong>terminants by human colostrum and serum<br />
antibodies. J. Clin. Microbiol. 38, 2696–2700.<br />
Partridge, J.D., Scot, C., Tang, T., Poole, R.K., Green, J., 2006. Escherichia coli<br />
transcriptome dynamics during the transition from anaerobic to aerobic<br />
conditions. Journal of Biological Chemistry 281, 2786–27815.<br />
Peek, A.S., Souza, V., Eguiarte, L.E., Gaut, B.S., 2001. The interaction of protein<br />
structure, selection, and recombination on the evolutio of the type-1 fimbrial<br />
major subunit (fimA) from Escherichia coli. J. Mol. Evol. 52, 193–204.<br />
Perna, N.T., 2011. Genomics of Escherichia and Shigella. In: Wiedman, M., Zhang, W.<br />
(Eds.), Genomics of Foodborne Bacterial Pathogens. Springer, New York, USA,<br />
pp. 119–139.<br />
Picard, B., Garcia, J.S., Gouriou, S., Duriez, P., Brahimi, N., Bingen, E., Elion, J.,<br />
Denamur, E., 1999. The link between phylogeny and virulence in Escherichia coli<br />
extraintestinal infection. Infect. Immun. 67, 546–553.<br />
Pond, S.L., Frost, S.D., 2005. Datamonkey: rapid <strong>de</strong>tection of selective pressure on<br />
individual sites of codon alignments. Bioinformatics 21, 2531–2533.<br />
Power, M.L., Littlefield-Wyer, J., Gordon, D.M., Veal, D.A., Sla<strong>de</strong>, M.B., 2005.<br />
Phenotypic and genotypic characterization of encapsulated Escherichia coli<br />
isolated from blooms in two Australian lakes. Environ. Microbiol. 7, 631–640.<br />
Pritchard, J.K., Stephens, M., Donnelly, P., 2000. Inference of population structure<br />
using multilocus genotype data. Genetics 155, 945–959.<br />
Reid, S.D., Herbelin, C.J., Bumbaugh, A.C., Selan<strong>de</strong>r, R.K., Whittam, T.S., 2000. Parallel<br />
evolution of virulence in pathogenic Escherichia coli. Nature 406, 64–67.<br />
Rozas, J., Sanchez-DelBarrio, J.C., Messeguer, X., Rozas, R., 2003. DnaSP, DNA<br />
polymorphism analyses by the coalescent and other methods. Bioinformatics<br />
19, 2496–2497.<br />
Sabarly, V., Bouvet, O., Glodt, J., Clermont, O., Skurnik, D., Diancourt, L., et al., 2011.<br />
The <strong>de</strong>coupling between genetic structure and metabolic phenotypes in<br />
Escherichia coli leads to continuous phenotypic diversity. J. Evol. Biol. 24,<br />
1559–1571.<br />
Sandner, L., Eguiarte, L.E., Navarro, A., Cravioto, A., Souza, V., 2001. The elements of<br />
the locus of enterocyte effacement in human and wild mammal isolates of<br />
Escherichia coli: evolution by assemblage or disruption Microbiology 147,<br />
3149–3158.<br />
Savageau, M.A., 1983. Escherichia coli habitats, cell types, and molecular<br />
mechanisms of gene control. Am. Nat. 122, 732–744.<br />
Selan<strong>de</strong>r, R.K., Caugant, D.A., Whittam, T.S., 1987. Genetic structure and variation in<br />
natural populations of Escherichia coli. In: Ingraham, J.L., Low, K.B., Magasanik,<br />
B., Schaechter, M., Umbarger, H.E. (Eds.), Escherichia coli and Salmonella<br />
typhimurirum: Cellular and Molecular Biology. ASM Press, Washington, DC,<br />
pp. 1625–1648.<br />
Smith, N.H., Dale, J., Inwald, J., Palmer, S., Gordon, S.V., Hewinson, R.G., Maynard-<br />
Smith, J., 2003. The population structure of Mycobacterium bovis in Great<br />
Britain: clonal expansion. Proc. Natl Acad. Sci. USA 100, 5271–15275.<br />
Souza, V., Castillo, A., Eguiarte, L.E., 2002a. The evolutionary ecology of Escherichia<br />
coli. Am. Sci. 90, 332–341.<br />
Souza, V., Rocha, M., Valera, A., Eguiarte, L.E., 1999. Genetic structure of natural<br />
populations of Escherichia coli in wild hosts on different continents. Appl.<br />
Environ. Microbiol. 65, 3373–3385.
A. González-González et al. / Infection, Genetics and Evolution 13 (2013) 187–197 197<br />
Souza, V., Travisano, M., Turner, P., Eguiarte, L.E., 2002b. Does experimental<br />
evolution reflect patterns in natural populations Comparison of E. coli strains<br />
from long-term studies to those from wild isolates. Antoine van Leeuwenhoek.<br />
81, 143–153.<br />
Spratt, B., Hanage, W., Feil, E., 2001. The relative contributions of recombination and<br />
point mutation to the diversification of bacterial clones. Curr. Opin. Microbiol. 4,<br />
602–606.<br />
Stamatakis, A., 2006. RAxML-VI-HPC: maximum likelihood-based phylogenetic<br />
analyses with thousands of taxa and mixed mo<strong>de</strong>ls. Bioinformatics 22, 2688–<br />
2690.<br />
Suerbaum, S., Smith, J.M., Bapumia, K., Morelli, G., Smith, N.H., Kunstmann, E.,<br />
Dyrek, I., Achtman, M., 1998. Free recombination within Helicobacter pylori.<br />
Proc. Natl. Acad. Sci. USA 95, 12619–12624.<br />
Tartof, S.Y., Solberg, O.D., Manges, A.R., Riley, L.W., 2005. Analysis of a<br />
uropathogenic Escherichia coli clonal group by multilocus sequence typing. J.<br />
Clin. Microbiol. 43, 5860–5864.<br />
Tenaillon, O., Skurnik, D., Picard, B., Denamur, E., 2010. The population genetics of<br />
commensal Escherichia coli. Nat. Rev. Microbiol. 8, 207–217.<br />
Thompson, J., Higgins, D., Gibson, T., 1994. CLUSTAL W: improving the sensitivity of<br />
progressive multiple sequence alignment through sequence weighting,<br />
position-specific gap penalties and weight matrix choice. Nucl. Acids Res. 22,<br />
4673–4680.<br />
Touchon, M., Hoe<strong>de</strong>, C., Tenaillon, O., Barbe, V., Baeriswyl, S., et al., 2009. Organised<br />
genome dynamics in Escherichia coli species results in highly diverse adaptive<br />
paths. PLoS Genetics 5, e1000344.<br />
Turner, S.M., Chaudhuri, R.R., Jiang, Z.D., DuPont, H., Gyles, C., et al., 2006.<br />
Phylogenetic comparisons reveal multiple acquisitions of the toxin genes by<br />
enterotoxigenic Escherichia coli strains of different evolutionary lineages. J. Clin.<br />
Microbiol. 44, 4528–4536.<br />
van Elsas, J.D., Semenov, A.V., Costa, R., Trevors, J.T., 2011. Survival of Escherichia coli<br />
in the environment: fundamental and public health aspects. ISME J. 5, 173–183.<br />
Vos, M., Di<strong>de</strong>lot, X., 2009. A comparison of homologous recombination rates in<br />
bacteria and archaea. ISME J. 3, 199–208.<br />
Walk, S.T., Alm, E.W., Calhoun, L.M., Mladonicky, J.M., Whittam, T.S., 2007. Genetic<br />
diversity and population structure of Escherichia coli isolated from freshwater<br />
beaches. Environ. Microbiol. 9, 2274–2288.<br />
Watanabe, H., Wada, A., Inagaki, Y., Itoh, K., Tamura, K., 1996. Outbreaks of<br />
enterohaemorrhagic Escherichia coli O157:H7 infection by two different<br />
genotype strains in Japan, 1996. Lancet 348, 831–832.<br />
White, A.P., Sibley, K.A., Sibley, C.D., Wasmuth, J.D., Schaefer, R., Surette, M.G., Edge,<br />
T.A., Neumann, N.F., 2011. Intergenic sequence comparison of Escherichia coli<br />
isolates reveals lifestyle adaptations but not host specificity. Appl. Environ.<br />
Microbiol. 77, 7620–7632.<br />
Whitfield, C., 2006. Biosynthesis and assembly of capsular polysacchari<strong>de</strong>s in<br />
Escherichia coli. Annu. Rev. Biochem. 75, 39–68.<br />
Whittam, T.S., Ochman, H., Selan<strong>de</strong>r, R.K., 1983. Geographic components of linkage<br />
disequilibrium in natural populations of Escherichia coli. Mol. Biol. Evol. 1, 67–<br />
83.<br />
Wirth, T., Falush, D., Lan, R., Colles, F., Mensa, P., Wieler, L., Karch, H., Reeves, P.,<br />
Mai<strong>de</strong>n, M., Ochman, H., Achtman, M., 2006. Sex and virulence in Escherichia<br />
coli: an evolutionary perspective. Mol. Microbiol. 60, 1136–1151.
Fig. S1. Posterior probability from the mean estimated log-likelihood of K for sets 2-7
Fig. S2. Description of the four steps for the graphical method allowing <strong>de</strong>tection of the<br />
true number of groups K inferred by STRUCTURE software (Evanno et al., 2005).
Fig. S3. E. coli MLST database maximum likelihood (ML) analysis. Mexican STs<br />
coloured according their belonging to each phylogenetic group or lineage <strong>de</strong>tected by<br />
ClonalFrame: A (pink), B1 (blue), purple (A-ST522), magenta (B1-ST86), B2 (red), D<br />
(yellow), E (green), Ungrouped (black).
Fig. S4. 50% majority-rule consensus trees based on ClonalFrame output analysis for 82<br />
unique STs consi<strong>de</strong>ring (a) and ignoring (b) the role of homologous recombination in the<br />
estimation of the genealogy. The rulers indicate the time in coalescent units. Dashed<br />
black lines show the estimated time to the most recent common ancestors of A and B1<br />
lineages.
Fig. S5. Evolutionary events inferred by ClonalFrame on the branches of each Mexican<br />
E. coli phylogenetic group, lineages and CCs as indicated in the Figure 1. Each inferred<br />
substitution caused by either mutation or recombination is indicated by a cross, the<br />
intensity indicates the posterior probability for that substitution. The red line indicates the<br />
probability of recombination.
39<br />
Table S1. Mexican Escherichia coli isolates analyzed. Traits of isolates: Clonal Complex, Clermont group, ancestral group (Structure), MLST<br />
allele profiles, ST, host, pathotype, serotype<br />
Strain<br />
Tamaño <strong>de</strong><br />
Chromosoma<br />
Kb's<br />
Asignación<br />
ClonalFrame<br />
Grupo<br />
Ancestral<br />
a<br />
CC b GC c ST d Hospe<strong>de</strong>ro<br />
Especie <strong>de</strong>l<br />
hospe<strong>de</strong>ro<br />
Estilo <strong>de</strong><br />
vida<br />
PT e Serotipo Enfermedad Año Ciudad País<br />
Laboratorio<br />
<strong>de</strong> origen<br />
1 5392 B1 AxB1 Ninguno A0 867<br />
Animal<br />
domesticado<br />
Perro Canis<br />
lupus familiaris<br />
No<br />
patógeno<br />
Ninguno O:H- Ninguna 1994 México, DF. México<br />
Souza, V.<br />
<strong>Instituto</strong> <strong>de</strong><br />
<strong>Ecología</strong>,<br />
<strong>UNAM</strong><br />
3 4766 B1 B1 Ninguno B1 2350<br />
Animal<br />
domesticado<br />
Perro Canis<br />
lupus familiaris<br />
No<br />
patógeno<br />
Ninguno O8:H49 Ninguna 1994 México, DF. México<br />
Souza, V.<br />
<strong>Instituto</strong> <strong>de</strong><br />
<strong>Ecología</strong>,<br />
<strong>UNAM</strong><br />
19 4841 B1 AxB1<br />
ST40<br />
Cplx<br />
B1 200<br />
Animal<br />
silvestre<br />
Ratón Liomys<br />
pictus<br />
Patógeno ETEC O22:H28 Ninguna 1994 Chamela, Jal. México<br />
Souza, V.<br />
<strong>Instituto</strong> <strong>de</strong><br />
<strong>Ecología</strong>,<br />
<strong>UNAM</strong><br />
33 5181 B2 B2 Ninguno A0 136<br />
Animal<br />
silvestre<br />
Murciélago<br />
Leptonycteris<br />
nivalis<br />
Patógeno ETEC O8:H- Ninguna 1994<br />
Tepoztlán,<br />
Mor.<br />
México<br />
Souza, V.<br />
<strong>Instituto</strong> <strong>de</strong><br />
<strong>Ecología</strong>,<br />
<strong>UNAM</strong><br />
53 4813 A A<br />
ST10<br />
Cplx<br />
A1 10<br />
Animal<br />
domesticado<br />
Parrot Aratinga<br />
ocularis<br />
No<br />
patógeno<br />
Ninguno O78:H2 Ninguna 1994 México, DF. México<br />
Souza, V.<br />
<strong>Instituto</strong> <strong>de</strong><br />
<strong>Ecología</strong>,<br />
<strong>UNAM</strong><br />
55 5069 D D<br />
ST69<br />
Cplx<br />
D1 69<br />
Animal<br />
silvestre<br />
Aguila Aquila<br />
chrysaetos<br />
No<br />
patógeno<br />
Ninguno O:H6 Ninguna 1994 México, DF. México<br />
Souza, V.<br />
<strong>Instituto</strong> <strong>de</strong><br />
<strong>Ecología</strong>,<br />
<strong>UNAM</strong><br />
68 5143 B1 B1 Ninguno B1 737<br />
Animal<br />
silvestre<br />
Ratón Sigmodon<br />
mascotensis<br />
No<br />
patógeno<br />
Ninguno 037:H21 Ninguna 1994 Chamela, Jal. México<br />
Souza, V.<br />
<strong>Instituto</strong> <strong>de</strong><br />
<strong>Ecología</strong>,<br />
<strong>UNAM</strong><br />
75 5195 B1 AxB1<br />
ST40<br />
Cplx<br />
B1 2354<br />
Animal<br />
silvestre<br />
Ratón Baiomys<br />
musculus<br />
Patógeno ETEC O103:H21 Ninguna 1994 Chamela, Jal. México<br />
Souza, V.<br />
<strong>Instituto</strong> <strong>de</strong><br />
<strong>Ecología</strong>,<br />
<strong>UNAM</strong><br />
88 4739 A A<br />
ST10<br />
Cplx<br />
A1 218<br />
Animal<br />
silvestre<br />
Ratón Habromys<br />
sp.<br />
Patógeno ETEC O103:H- Ninguna 1994<br />
Zacualpan,<br />
Edomex.<br />
México<br />
Souza, V.<br />
<strong>Instituto</strong> <strong>de</strong><br />
<strong>Ecología</strong>,<br />
<strong>UNAM</strong>
40<br />
90 5046 D D<br />
95 4916 B2 B2xD<br />
ST69<br />
Cplx<br />
ST28<br />
Cplx<br />
D1 106<br />
B22 28<br />
270 5096 B1 B1 Ninguno B1 2338<br />
271 5072 B1 B1 Ninguno B1 2338<br />
272 4883 D D<br />
ST31<br />
Cplx<br />
D1 130<br />
288 4863 B1 AxB1 Ninguno B1 2352<br />
807 5131 Ungrouped ABD<br />
ST1250<br />
Cplx<br />
B1 2336<br />
814 4677 B2 B2 Ninguno B23 713<br />
815 4713 B2 B2 Ninguno B23 713<br />
825 4761 E B2xD<br />
830 5603 E B2xD<br />
ST11<br />
Cplx<br />
ST11<br />
Cplx<br />
D1 335<br />
D1 335<br />
Animal<br />
silvestre<br />
Animal<br />
silvestre<br />
Animal<br />
silvestre<br />
Animal<br />
silvestre<br />
Animal<br />
silvestre<br />
Animal<br />
silvestre<br />
Animal<br />
domesticado<br />
Animal<br />
silvestre<br />
Animal<br />
silvestre<br />
Animal<br />
silvestre<br />
Animal<br />
silvestre<br />
Coyote Canis<br />
latrans<br />
Ratón<br />
Peromyscus<br />
megalops<br />
Jaguar Panthera<br />
onca<br />
Jaguar Panthera<br />
onca<br />
Zorro Urocyon<br />
cinereoargenteus<br />
Ratón<br />
Dipodomys<br />
merriami<br />
Caballo Equus<br />
caballus<br />
Cacomixtle<br />
Bassariscus<br />
astutus<br />
Cacomixtle<br />
Bassariscus<br />
astutus<br />
Coyote Canis<br />
latrans<br />
Coyote Canis<br />
latrans<br />
No<br />
patógeno<br />
No<br />
patógeno<br />
Ninguno O77:H18 Ninguna 1994<br />
Ninguno O:H6 Ninguna 1994<br />
Omiltemi,<br />
Gro.<br />
Omiltemi,<br />
Gro.<br />
México<br />
México<br />
Patógeno EPEC O159:H46 Ninguna 1994 Chiapas México<br />
Patógeno EPEC O159:H46 Ninguna 1994 Chiapas México<br />
No<br />
patógeno<br />
No<br />
patógeno<br />
No<br />
patógeno<br />
No<br />
patógeno<br />
No<br />
patógeno<br />
Ninguno O77:H18 Ninguna 1994 Chiapas México<br />
Ninguno O132:H28 Ninguna 1994<br />
Ninguno O19:H- Ninguna 1994<br />
Mapimí,<br />
Dgo.<br />
Calpan,<br />
Puebla<br />
México<br />
México<br />
Ninguno O145:H34 Ninguna 1994 México, DF. México<br />
Ninguno O145:H34 Ninguna 1994 México, DF. México<br />
Patógeno EPEC O55:H7 Ninguna 1994<br />
Patógeno EPEC O55:H7 Ninguna 1994<br />
Mapimí,<br />
Dgo.<br />
Mapimí,<br />
Dgo.<br />
México<br />
México<br />
Souza, V.<br />
<strong>Instituto</strong> <strong>de</strong><br />
<strong>Ecología</strong>,<br />
<strong>UNAM</strong><br />
Souza, V.<br />
<strong>Instituto</strong> <strong>de</strong><br />
<strong>Ecología</strong>,<br />
<strong>UNAM</strong><br />
Souza, V.<br />
<strong>Instituto</strong> <strong>de</strong><br />
<strong>Ecología</strong>,<br />
<strong>UNAM</strong><br />
Souza, V.<br />
<strong>Instituto</strong> <strong>de</strong><br />
<strong>Ecología</strong>,<br />
<strong>UNAM</strong><br />
Souza, V.<br />
<strong>Instituto</strong> <strong>de</strong><br />
<strong>Ecología</strong>,<br />
<strong>UNAM</strong><br />
Souza, V.<br />
<strong>Instituto</strong> <strong>de</strong><br />
<strong>Ecología</strong>,<br />
<strong>UNAM</strong><br />
Souza, V.<br />
<strong>Instituto</strong> <strong>de</strong><br />
<strong>Ecología</strong>,<br />
<strong>UNAM</strong><br />
Souza, V.<br />
<strong>Instituto</strong> <strong>de</strong><br />
<strong>Ecología</strong>,<br />
<strong>UNAM</strong><br />
Souza, V.<br />
<strong>Instituto</strong> <strong>de</strong><br />
<strong>Ecología</strong>,<br />
<strong>UNAM</strong><br />
Souza, V.<br />
<strong>Instituto</strong> <strong>de</strong><br />
<strong>Ecología</strong>,<br />
<strong>UNAM</strong><br />
Souza, V.<br />
<strong>Instituto</strong> <strong>de</strong><br />
<strong>Ecología</strong>,<br />
<strong>UNAM</strong>
41<br />
1639 4695 B2 B2 Ninguno B22 2356<br />
1684 4863 A A<br />
1728 4700 A A<br />
ST10<br />
Cplx<br />
ST10<br />
Cplx<br />
A1 10<br />
A1 10<br />
1735 5725 B1 B1 Ninguno B1 1248<br />
1743 4775 A-ST522 AxB1<br />
1744 4608 A A<br />
ST522<br />
Cplx<br />
ST10<br />
Cplx<br />
A1 2334<br />
A1 48<br />
1937 4702 B1 AxB1 Ninguno B1 1308<br />
1940 4633 A-ST522 AxB1<br />
1967 4722 D D<br />
ST522<br />
Cplx<br />
ST349<br />
Cplx<br />
A1 2334<br />
D2 2337<br />
2055 5107 B1 AxB1 Ninguno B1 1582<br />
2064 5025 A A<br />
ST10<br />
Cplx<br />
A1 10<br />
Animal<br />
silvestre<br />
Animal<br />
silvestre<br />
Animal<br />
domesticado<br />
Animal<br />
silvestre<br />
Animal en<br />
cautiverio<br />
Animal en<br />
cautiverio<br />
Animal en<br />
cautiverio<br />
Animal en<br />
cautiverio<br />
Animal<br />
domesticado<br />
Animal<br />
silvestre<br />
Animal<br />
silvestre<br />
Mono aullador<br />
Alouatta palliata<br />
Murciélago<br />
Choeronycteris<br />
mexicana<br />
Gallo Galus<br />
gallus<br />
Manatí<br />
Trichechus<br />
manatus<br />
Oso hormiguero<br />
Tamandua<br />
mexicana<br />
Oso hormiguero<br />
Tamandua<br />
mexicana<br />
Tapir<br />
Tapirus bairdii<br />
Armadillo<br />
Dasypus sp.<br />
Oveja<br />
Ovis aries<br />
Pecarí<br />
Tayassu tajacu<br />
Mapache<br />
Procyon lotor<br />
Patógeno EPEC O127:H Ninguna 1994<br />
No<br />
patógeno<br />
No<br />
patógeno<br />
No<br />
patógeno<br />
Ninguno O148:H32 Ninguna 1994<br />
Los Tuxtlas,<br />
Ver.<br />
Tepoztlán,<br />
Mor.<br />
México<br />
México<br />
Ninguno O140:H32 Ninguna 1995 México, DF. México<br />
Ninguno O:H Ninguna 1995<br />
Chetumal,<br />
Q.Roo<br />
México<br />
Patógeno ETEC O148:H- Ninguna 1995 Chiapas México<br />
No<br />
patógeno<br />
No<br />
patógeno<br />
No<br />
patógeno<br />
Ninguno O65:H11 Ninguna 1995 Chiapas México<br />
Ninguno O8:H7 Ninguna 1995 Chiapas México<br />
Ninguno O166:H- Ninguna 1995 Chiapas México<br />
Patógeno ETEC O166:H15 Ninguna 1995<br />
No<br />
patógeno<br />
No<br />
patógeno<br />
Ninguno O8:H11 Ninguna 1995<br />
Ninguno O70:H11 Ninguna 1995<br />
Isla Socorro,<br />
Revillagigedo<br />
Chamela<br />
Cuixmala<br />
Chamela<br />
Cuixmala<br />
México<br />
México<br />
México<br />
Souza, V.<br />
<strong>Instituto</strong> <strong>de</strong><br />
<strong>Ecología</strong>,<br />
<strong>UNAM</strong><br />
Souza, V.<br />
<strong>Instituto</strong> <strong>de</strong><br />
<strong>Ecología</strong>,<br />
<strong>UNAM</strong><br />
Souza, V.<br />
<strong>Instituto</strong> <strong>de</strong><br />
<strong>Ecología</strong>,<br />
<strong>UNAM</strong><br />
Souza, V.<br />
<strong>Instituto</strong> <strong>de</strong><br />
<strong>Ecología</strong>,<br />
<strong>UNAM</strong><br />
Souza, V.<br />
<strong>Instituto</strong> <strong>de</strong><br />
<strong>Ecología</strong>,<br />
<strong>UNAM</strong><br />
Souza, V.<br />
<strong>Instituto</strong> <strong>de</strong><br />
<strong>Ecología</strong>,<br />
<strong>UNAM</strong><br />
Souza, V.<br />
<strong>Instituto</strong> <strong>de</strong><br />
<strong>Ecología</strong>,<br />
<strong>UNAM</strong><br />
Souza, V.<br />
<strong>Instituto</strong> <strong>de</strong><br />
<strong>Ecología</strong>,<br />
<strong>UNAM</strong><br />
Souza, V.<br />
<strong>Instituto</strong> <strong>de</strong><br />
<strong>Ecología</strong>,<br />
<strong>UNAM</strong><br />
Souza, V.<br />
<strong>Instituto</strong> <strong>de</strong><br />
<strong>Ecología</strong>,<br />
<strong>UNAM</strong><br />
Souza, V.<br />
<strong>Instituto</strong> <strong>de</strong><br />
<strong>Ecología</strong>,<br />
<strong>UNAM</strong>
42<br />
2065 4601 A A<br />
ST10<br />
Cplx<br />
A1 2357<br />
3442 4602 A-ST522 AxB1 Ninguno A1 716<br />
3456 4693 B1-ST86 ADB<br />
ST86<br />
Cplx<br />
Animal<br />
silvestre<br />
Animal<br />
silvestre<br />
Mapache<br />
Procyon lotor<br />
Murciélago<br />
Artibeus sp.<br />
No<br />
patógeno<br />
No<br />
patógeno<br />
Ninguno O70:H11 Ninguna 1995<br />
Ninguno O142:H25 Ninguna 1995<br />
A1 2358 Agua Agua Unknown Unknown O135:H25 Ninguna 1995<br />
3463 4634 A A Ninguno A0 1434 Agua Agua Unknown Unknown O18ab:H14 Ninguna 1995<br />
3470 4928 B2 B2xD<br />
3524 4851 A A<br />
ST28<br />
Cplx<br />
ST10<br />
Cplx<br />
B23 2360<br />
Animal<br />
silvestre<br />
Murciélago<br />
Artibeus sp.<br />
A1 34 Humano Humano<br />
No<br />
patógeno<br />
No<br />
patógeno<br />
Ninguno O:H6 Ninguna 1995<br />
Chamela<br />
Cuixmala<br />
Cueva Salitre<br />
Tetecalitla,<br />
Mor.<br />
Cueva Salitre<br />
Tetecalitla,<br />
Mor.<br />
Cueva Salitre<br />
Tetecalitla,<br />
Mor.<br />
Cueva Salitre<br />
Tetecalitla,<br />
Mor.<br />
México<br />
México<br />
México<br />
México<br />
México<br />
Ninguno O30:H10 Ninguna 1995 Morelos México<br />
3528 4731 A A Ninguno A0 495 Humano Humano Patógeno EPEC O126:H27 Ninguna 1995 Morelos México<br />
3535 4737 B1 AxB1<br />
ST155<br />
Cplx<br />
D2 58 Humano Humano<br />
3566 4602 A A Ninguno A0 1434 Humano Humano<br />
3607 5488 B1 AxB1<br />
3609 5427 B2 B2<br />
3614 4907 B1-ST86 ABD<br />
3617 4892 A A<br />
ST40<br />
Cplx<br />
ST14<br />
Cplx<br />
ST86<br />
Cplx<br />
ST10<br />
Cplx<br />
No<br />
patógeno<br />
No<br />
patógeno<br />
Ninguno O8:H30 Ninguna 1995 Morelos México<br />
Ninguno O86:H12 Ninguna 1995 Morelos México<br />
B1 200 Humano Humano Patógeno EAEC O11:H- Ninguna 1995 Morelos México<br />
B23 550 Humano Humano Patógeno EAEC O75:H5 Ninguna 1995 Morelos México<br />
B1 453 Humano Humano Patógeno EAEC OR:H16 Diarrea 1995 Morelos México<br />
A1 34 Humano Humano Patógeno EAEC O136:H33 Diarrea 1995 Morelos México<br />
Souza, V.<br />
<strong>Instituto</strong> <strong>de</strong><br />
<strong>Ecología</strong>,<br />
<strong>UNAM</strong><br />
Souza, V.<br />
<strong>Instituto</strong> <strong>de</strong><br />
<strong>Ecología</strong>,<br />
<strong>UNAM</strong><br />
Souza, V.<br />
<strong>Instituto</strong> <strong>de</strong><br />
<strong>Ecología</strong>,<br />
<strong>UNAM</strong><br />
Souza, V.<br />
<strong>Instituto</strong> <strong>de</strong><br />
<strong>Ecología</strong>,<br />
<strong>UNAM</strong><br />
Souza, V.<br />
<strong>Instituto</strong> <strong>de</strong><br />
<strong>Ecología</strong>,<br />
<strong>UNAM</strong><br />
Faculty of<br />
Medicine,<br />
<strong>UNAM</strong><br />
Faculty of<br />
Medicine,<br />
<strong>UNAM</strong><br />
Faculty of<br />
Medicine,<br />
<strong>UNAM</strong><br />
Faculty of<br />
Medicine,<br />
<strong>UNAM</strong><br />
Faculty of<br />
Medicine,<br />
<strong>UNAM</strong><br />
Faculty of<br />
Medicine,<br />
<strong>UNAM</strong><br />
Faculty of<br />
Medicine,<br />
<strong>UNAM</strong><br />
Faculty of<br />
Medicine,<br />
<strong>UNAM</strong>
43<br />
3620 4863 A A<br />
ST10<br />
Cplx<br />
A1 10 Humano Humano Patógeno EAEC O92:H- Diarrea 1995 Morelos México<br />
3621 4252 D D Ninguno D1 414 Humano Humano Patógeno EAEC O7:H3 Diarrea 1995 Morelos México<br />
3622 5646 D D<br />
3623 5224 A A<br />
3625 4948 B1 AxB1<br />
3627 4962 A A<br />
3628 5147 A A<br />
3629 4863 B1-ST86 ABD<br />
ST31<br />
Clpx<br />
ST10<br />
Cplx<br />
ST40<br />
Cplx<br />
ST165<br />
Cplx<br />
ST10<br />
Cplx<br />
ST86<br />
Cplx<br />
D1 31 Humano Humano Patógeno EAEC O15:H7 Diarrea 1995 Morelos México<br />
A1 10 Humano Humano Patógeno EAEC O111:H12 Diarrea 1995 Morelos México<br />
B1 200 Humano Humano Patógeno EAEC O7:H Diarrea 1995 Morelos México<br />
A0 2342 Humano Humano Patógeno EAEC O130:H27 Diarrea 1995 Morelos México<br />
A1 2339 Humano Humano Patógeno EAEC O33:H19 Diarrea 1995 Morelos México<br />
A0 453 Humano Humano Patógeno EAEC O7:H10 Diarrea 1995 Morelos México<br />
3630 4182 D D Ninguno D1 414 Humano Humano Patógeno EAEC O44:H18 Diarrea 1995 Morelos México<br />
3631 5284 A A<br />
3635 5177 B1 B1<br />
ST10<br />
Cplx<br />
ST20<br />
Cplx<br />
A1 10 Humano Humano Patógeno EAEC O15:H7 Diarrea 1995 Morelos México<br />
B1 3 Humano Humano Patógeno EPEC O114:H2 Ninguna 1995 DF México<br />
3637 4757 B1 AxB1 Ninguno B1 173 Humano Humano Patógeno ETEC O78:H12 Ninguna 1995 DF México<br />
3641 4898 B1 B1<br />
3646 4686 B1 B1<br />
ST205<br />
Cplx<br />
ST23<br />
Cplx<br />
B1 443 Humano Humano Patógeno ETEC O167:H5 Ninguna 1995 DF México<br />
A1 410 Humano Humano Patógeno ETEC O8:H- Ninguna 1995 DF México<br />
Faculty of<br />
Medicine,<br />
<strong>UNAM</strong><br />
Faculty of<br />
Medicine,<br />
<strong>UNAM</strong><br />
Faculty of<br />
Medicine,<br />
<strong>UNAM</strong><br />
Faculty of<br />
Medicine,<br />
<strong>UNAM</strong><br />
Faculty of<br />
Medicine,<br />
<strong>UNAM</strong><br />
Faculty of<br />
Medicine,<br />
<strong>UNAM</strong><br />
Faculty of<br />
Medicine,<br />
<strong>UNAM</strong><br />
Faculty of<br />
Medicine,<br />
<strong>UNAM</strong><br />
Faculty of<br />
Medicine,<br />
<strong>UNAM</strong><br />
Faculty of<br />
Medicine,<br />
<strong>UNAM</strong><br />
Souza, V.<br />
<strong>Instituto</strong> <strong>de</strong><br />
<strong>Ecología</strong>,<br />
<strong>UNAM</strong><br />
Souza, V.<br />
<strong>Instituto</strong> <strong>de</strong><br />
<strong>Ecología</strong>,<br />
<strong>UNAM</strong><br />
Souza, V.<br />
<strong>Instituto</strong> <strong>de</strong><br />
<strong>Ecología</strong>,<br />
<strong>UNAM</strong><br />
Souza, V.<br />
<strong>Instituto</strong> <strong>de</strong><br />
<strong>Ecología</strong>,<br />
<strong>UNAM</strong>
44<br />
3648 4761 B1 B1<br />
3650 4776 B1 B1<br />
3651 5696 B1 B1<br />
3652 4608 B1 B1<br />
ST23<br />
Cplx<br />
ST29<br />
Cplx<br />
ST20<br />
Cplx<br />
ST278<br />
Cplx<br />
A1 410 Humano Humano Patógeno ETEC O8:H9 Ninguna 1995 DF México<br />
B1 29 Humano Humano Patógeno EHEC O26:H11 Ninguna 1995 DF México<br />
B1 3 Humano Humano Patógeno EPEC O111:H- Ninguna 1995 DF México<br />
B1 316 Humano Humano Patógeno ETEC O27:H7 Ninguna 1995 DF México<br />
3653 4802 B2 B2 Ninguno B23 2362 Humano Humano Patógeno EHEC O125ac:H- Ninguna 1995 DF México<br />
3655 5369 B1 AxB1 Ninguno B1 734 Humano Humano Patógeno ETEC O78:H12 Ninguna 1995 DF México<br />
3657 4697 A A<br />
ST10<br />
Cplx<br />
A1 10 Suelo Suelo Patógeno EIEC O135:H- Ninguna 1995 DF México<br />
3658 5698 B1 AxB1 Ninguno B1 2330 Suelo Suelo Unknown Unknown O34:H40 Ninguna 1995 DF México<br />
3659 5606 B1 B1<br />
ST20<br />
Cplx<br />
B1 3 Humano Humano Patógeno EPEC O111:H- Ninguna 1995 DF México<br />
3662 4007 B2 B2 Ninguno B23 2331 Humano Humano Patógeno EIEC O164:H- Ninguna 1995 DF México<br />
3663 4927 B1 B1<br />
ST205<br />
Cplx<br />
B1 443 Humano Humano Patógeno EIEC O167:H- Ninguna 1995 DF México<br />
Souza, V.<br />
<strong>Instituto</strong> <strong>de</strong><br />
<strong>Ecología</strong>,<br />
<strong>UNAM</strong><br />
Souza, V.<br />
<strong>Instituto</strong> <strong>de</strong><br />
<strong>Ecología</strong>,<br />
<strong>UNAM</strong><br />
Souza, V.<br />
<strong>Instituto</strong> <strong>de</strong><br />
<strong>Ecología</strong>,<br />
<strong>UNAM</strong><br />
Souza, V.<br />
<strong>Instituto</strong> <strong>de</strong><br />
<strong>Ecología</strong>,<br />
<strong>UNAM</strong><br />
Souza, V.<br />
<strong>Instituto</strong> <strong>de</strong><br />
<strong>Ecología</strong>,<br />
<strong>UNAM</strong><br />
Souza, V.<br />
<strong>Instituto</strong> <strong>de</strong><br />
<strong>Ecología</strong>,<br />
<strong>UNAM</strong><br />
Souza, V.<br />
<strong>Instituto</strong> <strong>de</strong><br />
<strong>Ecología</strong>,<br />
<strong>UNAM</strong><br />
Souza, V.<br />
<strong>Instituto</strong> <strong>de</strong><br />
<strong>Ecología</strong>,<br />
<strong>UNAM</strong><br />
Souza, V.<br />
<strong>Instituto</strong> <strong>de</strong><br />
<strong>Ecología</strong>,<br />
<strong>UNAM</strong><br />
Souza, V.<br />
<strong>Instituto</strong> <strong>de</strong><br />
<strong>Ecología</strong>,<br />
<strong>UNAM</strong><br />
Souza, V.<br />
<strong>Instituto</strong> <strong>de</strong><br />
<strong>Ecología</strong>,<br />
<strong>UNAM</strong>
45<br />
3664 4792 A A<br />
3665 4688 A A<br />
3673 4892 A A<br />
3677 4648 A A<br />
3681 4533 B1 B1<br />
3682 5316 E B2xD<br />
3683 4761 B1 AxB1<br />
3687 4397 A A<br />
3691 6097 D D<br />
ST165<br />
Cplx<br />
ST165<br />
Cplx<br />
ST10<br />
Cplx<br />
ST165<br />
Cplx<br />
ST278<br />
Cplx<br />
ST11<br />
Clpx<br />
ST155<br />
Cplx<br />
ST10<br />
Cplx<br />
ST405<br />
Cplx<br />
A0 2343 Humano Humano Patógeno EIEC O152:H- Ninguna 1995 DF México<br />
A0 2355 Humano Humano Patógeno EIEC O112:H- Ninguna 1995 DF México<br />
A0 34 Humano Humano Patógeno EIEC O136:H- Ninguna 1995 DF México<br />
A1 2344 Humano Humano Patógeno EIEC O112:H- Ninguna 1995 DF México<br />
B1 316 Humano Humano Patógeno EHEC O157:H7 Ninguna 1995 DF México<br />
D1 11 Humano Humano Patógeno EHEC O157:H7 Ninguna 1995 DF México<br />
A0 58 Humano Humano Patógeno ETEC O20:H- Ninguna 1995 DF México<br />
A1 2353 Humano Humano Patógeno ETEC O6:H16 Ninguna 1995 DF México<br />
D2 2348 Humano Humano Patógeno EHEC O4:H- Ninguna 1995 DF México<br />
3693 5011 B2 B2 Ninguno B23 2347 Humano Humano Patógeno EPEC O55:H6 Ninguna 1995 DF México<br />
3694 4911 B1 B1 Ninguno B1 2333 Suelo Suelo Unknown Unknown O170:H- Ninguna 1995 DF México<br />
Souza, V.<br />
<strong>Instituto</strong> <strong>de</strong><br />
<strong>Ecología</strong>,<br />
<strong>UNAM</strong><br />
Souza, V.<br />
<strong>Instituto</strong> <strong>de</strong><br />
<strong>Ecología</strong>,<br />
<strong>UNAM</strong><br />
Souza, V.<br />
<strong>Instituto</strong> <strong>de</strong><br />
<strong>Ecología</strong>,<br />
<strong>UNAM</strong><br />
Souza, V.<br />
<strong>Instituto</strong> <strong>de</strong><br />
<strong>Ecología</strong>,<br />
<strong>UNAM</strong><br />
Souza, V.<br />
<strong>Instituto</strong> <strong>de</strong><br />
<strong>Ecología</strong>,<br />
<strong>UNAM</strong><br />
Souza, V.<br />
<strong>Instituto</strong> <strong>de</strong><br />
<strong>Ecología</strong>,<br />
<strong>UNAM</strong><br />
Souza, V.<br />
<strong>Instituto</strong> <strong>de</strong><br />
<strong>Ecología</strong>,<br />
<strong>UNAM</strong><br />
Souza, V.<br />
<strong>Instituto</strong> <strong>de</strong><br />
<strong>Ecología</strong>,<br />
<strong>UNAM</strong><br />
Souza, V.<br />
<strong>Instituto</strong> <strong>de</strong><br />
<strong>Ecología</strong>,<br />
<strong>UNAM</strong><br />
Souza, V.<br />
<strong>Instituto</strong> <strong>de</strong><br />
<strong>Ecología</strong>,<br />
<strong>UNAM</strong><br />
Souza, V.<br />
<strong>Instituto</strong> <strong>de</strong><br />
<strong>Ecología</strong>,<br />
<strong>UNAM</strong>
46<br />
3697 4007 B2 B2 Ninguno B23 2331 Humano Humano Patógeno EHEC O145:H- Ninguna 1995 DF México<br />
3698 4158 D D Ninguno D1 414 Humano Humano Patógeno EPEC O44:H18 Ninguna 1995 DF México<br />
3700 4693 B2 B2 Ninguno B23 2346 Humano Humano Patógeno ETEC O78:H12 Ninguna 1995 DF México<br />
3702 4722 B2 B2 Ninguno B23 2346 Humano Humano Patógeno EHEC O26:H11 Ninguna 1995 DF México<br />
3707 5586 B1 B1<br />
ST20<br />
Cplx<br />
B1 3 Humano Humano Patógeno EPEC O111ab:H- Ninguna 1995 DF México<br />
3711 5063 A A Ninguno A0 96 Humano Humano Patógeno ETEC O25:H42 Ninguna 1995 DF México<br />
3712 5663 B1 AxB1 Ninguno B1 2330 Suelo Suelo Unknown Unknown O34:H40 Ninguna 1995 DF México<br />
3713 5348 D D<br />
ST405<br />
Cplx<br />
D2 405 Humano Humano Patógeno ETEC O6:H16 Ninguna 1995 DF México<br />
3715 4714 A A Ninguno A1 1312 Humano Humano Patógeno ETEC O25:H- Ninguna 1995 DF México<br />
3716 5136 B1 B1<br />
3719 4736 E B2xD<br />
ST205<br />
Cplx<br />
ST11<br />
Clpx<br />
A0 443 Humano Humano Patógeno ETEC O167:H5 Ninguna 1995 DF México<br />
D1 11 Humano Humano Patógeno EHEC O157:H7 Ninguna 1995 DF México<br />
Souza, V.<br />
<strong>Instituto</strong> <strong>de</strong><br />
<strong>Ecología</strong>,<br />
<strong>UNAM</strong><br />
Souza, V.<br />
<strong>Instituto</strong> <strong>de</strong><br />
<strong>Ecología</strong>,<br />
<strong>UNAM</strong><br />
Souza, V.<br />
<strong>Instituto</strong> <strong>de</strong><br />
<strong>Ecología</strong>,<br />
<strong>UNAM</strong><br />
Souza, V.<br />
<strong>Instituto</strong> <strong>de</strong><br />
<strong>Ecología</strong>,<br />
<strong>UNAM</strong><br />
Souza, V.<br />
<strong>Instituto</strong> <strong>de</strong><br />
<strong>Ecología</strong>,<br />
<strong>UNAM</strong><br />
Souza, V.<br />
<strong>Instituto</strong> <strong>de</strong><br />
<strong>Ecología</strong>,<br />
<strong>UNAM</strong><br />
Souza, V.<br />
<strong>Instituto</strong> <strong>de</strong><br />
<strong>Ecología</strong>,<br />
<strong>UNAM</strong><br />
Souza, V.<br />
<strong>Instituto</strong> <strong>de</strong><br />
<strong>Ecología</strong>,<br />
<strong>UNAM</strong><br />
Souza, V.<br />
<strong>Instituto</strong> <strong>de</strong><br />
<strong>Ecología</strong>,<br />
<strong>UNAM</strong><br />
Souza, V.<br />
<strong>Instituto</strong> <strong>de</strong><br />
<strong>Ecología</strong>,<br />
<strong>UNAM</strong><br />
Souza, V.<br />
<strong>Instituto</strong> <strong>de</strong><br />
<strong>Ecología</strong>,<br />
<strong>UNAM</strong>
47<br />
3720 4473 A A<br />
ST10<br />
Cplx<br />
3824 4693 B2 B2 Ninguno B23 2335<br />
3842 4706 B1 AxB1<br />
3859 4885 A A<br />
3873 4668 A A<br />
3874 4668 A-ST522 AxB1<br />
3876 4247 A-ST522 AxB1<br />
3885 4899 A A<br />
4129 4742 D D<br />
4130 4719 D D<br />
4132 4742 D D<br />
ST155<br />
Cplx<br />
ST10<br />
Cplx<br />
ST10<br />
Cplx<br />
ST522<br />
Cplx<br />
ST10<br />
Cplx<br />
ST10<br />
Cplx<br />
ST394<br />
Cplx<br />
ST394<br />
Cplx<br />
ST394<br />
Cplx<br />
A1 10 Drenaje Drenaje Unknown Unknown O:H32 Ninguna 1995 DF México<br />
Animal<br />
silvestre<br />
Murciélago<br />
Artibeus<br />
jamaiciencis<br />
No<br />
patógeno<br />
Ninguno O:H6 Ninguna 1996 Yucatán México<br />
B1 58 Lodo Lodo Unknown Unknown O120:H27 Ninguna 1996 DF México<br />
A1 2349 Lodo Lodo Unknown Unknown O:H30 Ninguna 1996 DF México<br />
B22 48 Lodo Lodo Unknown Unknown O8:H9 Ninguna 1996 DF México<br />
A0 522 Lodo Lodo Unknown Unknown O148:H Ninguna 1996 DF México<br />
A1 2345 Lodo Lodo Unknown Unknown O:H- Ninguna 1996 DF México<br />
A1 10 Lodo Lodo Unknown Unknown O71:H27 Ninguna 1996 DF México<br />
D1 394<br />
B23 394<br />
D1 394<br />
Aire <strong>de</strong><br />
cueva<br />
Aire <strong>de</strong><br />
cueva<br />
Aire <strong>de</strong><br />
cueva<br />
Aire Unknown Unknown O73:H18 Ninguna 1996 Yucatán México<br />
Aire Unknown Unknown O73:H18 Ninguna 1996 Yucatán México<br />
Aire Unknown Unknown O73:H18 Ninguna 1996 Yucatán México<br />
Souza, V.<br />
<strong>Instituto</strong> <strong>de</strong><br />
<strong>Ecología</strong>,<br />
<strong>UNAM</strong><br />
Souza, V.<br />
<strong>Instituto</strong> <strong>de</strong><br />
<strong>Ecología</strong>,<br />
<strong>UNAM</strong><br />
Souza, V.<br />
<strong>Instituto</strong> <strong>de</strong><br />
<strong>Ecología</strong>,<br />
<strong>UNAM</strong><br />
Souza, V.<br />
<strong>Instituto</strong> <strong>de</strong><br />
<strong>Ecología</strong>,<br />
<strong>UNAM</strong><br />
Souza, V.<br />
<strong>Instituto</strong> <strong>de</strong><br />
<strong>Ecología</strong>,<br />
<strong>UNAM</strong><br />
Souza, V.<br />
<strong>Instituto</strong> <strong>de</strong><br />
<strong>Ecología</strong>,<br />
<strong>UNAM</strong><br />
Souza, V.<br />
<strong>Instituto</strong> <strong>de</strong><br />
<strong>Ecología</strong>,<br />
<strong>UNAM</strong><br />
Souza, V.<br />
<strong>Instituto</strong> <strong>de</strong><br />
<strong>Ecología</strong>,<br />
<strong>UNAM</strong><br />
Souza, V.<br />
<strong>Instituto</strong> <strong>de</strong><br />
<strong>Ecología</strong>,<br />
<strong>UNAM</strong><br />
Souza, V.<br />
<strong>Instituto</strong> <strong>de</strong><br />
<strong>Ecología</strong>,<br />
<strong>UNAM</strong><br />
Souza, V.<br />
<strong>Instituto</strong> <strong>de</strong><br />
<strong>Ecología</strong>,<br />
<strong>UNAM</strong>
48<br />
4135 4642 B1 B1<br />
ST205<br />
Cplx<br />
B1 2351<br />
Aire <strong>de</strong><br />
cueva<br />
Aire Unknown Unknown O139:H28 Ninguna 1996 Yucatán México<br />
Souza, V.<br />
<strong>Instituto</strong> <strong>de</strong><br />
<strong>Ecología</strong>,<br />
<strong>UNAM</strong><br />
4136 4751 D D<br />
ST394<br />
Cplx<br />
D1 394<br />
Aire <strong>de</strong><br />
cueva<br />
Aire Unknown Unknown O73:H18 Ninguna 1996 Yucatán México<br />
Souza, V.<br />
<strong>Instituto</strong> <strong>de</strong><br />
<strong>Ecología</strong>,<br />
<strong>UNAM</strong><br />
4952 4685 B1 B1<br />
ST29<br />
Cplx<br />
B1 29<br />
Animal<br />
domesticado<br />
Cerdo<br />
Sus scrofa<br />
domesticus<br />
Patógeno EPEC O26:H- Ninguna 1998 Edo México México<br />
Souza, V.<br />
<strong>Instituto</strong> <strong>de</strong><br />
<strong>Ecología</strong>,<br />
<strong>UNAM</strong><br />
4953 5277 B1 B1<br />
ST29<br />
Cplx<br />
B1 29<br />
Animal<br />
domesticado<br />
Cerdo<br />
Sus scrofa<br />
domesticus<br />
Patógeno EPEC O26:H- Ninguna 1998 Edo México México<br />
Souza, V.<br />
<strong>Instituto</strong> <strong>de</strong><br />
<strong>Ecología</strong>,<br />
<strong>UNAM</strong><br />
4957 4693 A A<br />
ST10<br />
Cplx<br />
A1 10 Aire Aire Patógeno EPEC O28:H- Ninguna 1998 DF México<br />
Souza, V.<br />
<strong>Instituto</strong> <strong>de</strong><br />
<strong>Ecología</strong>,<br />
<strong>UNAM</strong><br />
4958 4438 B1 ABD B1<br />
ST270<br />
Cplx<br />
B1 270 Humano Humano Patógeno EPEC O28:H- Ninguna 1998 DF México<br />
Souza, V.<br />
<strong>Instituto</strong> <strong>de</strong><br />
<strong>Ecología</strong>,<br />
<strong>UNAM</strong><br />
4959 5658 E B2xD<br />
ST11<br />
Cplx<br />
D1 335 Humano Humano Patógeno EPEC O55:H- Ninguna 1998 DF México<br />
Souza, V.<br />
<strong>Instituto</strong> <strong>de</strong><br />
<strong>Ecología</strong>,<br />
<strong>UNAM</strong><br />
4962 5646 E B2xD<br />
ST11<br />
Cplx<br />
D1 335 Humano Humano Patógeno EPEC O55:H- Ninguna 1998 DF México<br />
Souza, V.<br />
<strong>Instituto</strong> <strong>de</strong><br />
<strong>Ecología</strong>,<br />
<strong>UNAM</strong><br />
4964 5574 E B2xD<br />
ST11<br />
Cplx<br />
D1 335 Humano Humano Patógeno EPEC O55:H- Ninguna 1998 DF México<br />
Souza, V.<br />
<strong>Instituto</strong> <strong>de</strong><br />
<strong>Ecología</strong>,<br />
<strong>UNAM</strong><br />
4976 5370 B1 B1<br />
ST20<br />
Cplx<br />
B1 3 Humano Humano Patógeno EPEC O111ab:H- Ninguna 1998 DF México<br />
Souza, V.<br />
<strong>Instituto</strong> <strong>de</strong><br />
<strong>Ecología</strong>,<br />
<strong>UNAM</strong><br />
4993 4617 B1-ST86 ABD<br />
ST86<br />
Cplx<br />
B1 86 Aire Aire Patógeno EPEC O127:H9 Ninguna 1998 DF México<br />
Souza, V.<br />
<strong>Instituto</strong> <strong>de</strong><br />
<strong>Ecología</strong>,<br />
<strong>UNAM</strong>
49<br />
5014 5007 B1 B1<br />
5020 5908 B1 B1<br />
ST29<br />
Cplx<br />
ST29<br />
Cplx<br />
B1 29<br />
B1 16<br />
Animal<br />
domesticado<br />
Animal<br />
domesticado<br />
Cerdo<br />
Sus scrofa<br />
domesticus<br />
Oveja<br />
Ovis aries<br />
Patógeno EHEC O26:H- Ninguna 1998 Edo México México<br />
Patógeno EHEC O111ac:H- Ninguna 1998 Edo México México<br />
5021 4784 A-ST522 AxB1 Ninguno A0 1303 Humano Humano Patógeno EHEC 0128:H- Ninguna 1998 Morelos México<br />
5040 5122 A-ST522 A Ninguno A0 746 Aire Aire Unknown Unknown O181:H Ninguna 1998 DF México<br />
5058 5614 B1-ST86 ABD<br />
ST86<br />
Cplx<br />
6879 5387 B1 AxB1 Ninguno A0 540 Humano Humano<br />
6891 5073 D D<br />
ST394<br />
Cplx<br />
B1 641 Aire Aire Unknown Unknown O:H11 Ninguna 1998 DF México<br />
D1 2361 Humano Humano<br />
6908 4156 B2 ABD Ninguno B22 2359 Humano Humano<br />
6909 4608 B1 B1 Ninguno B1 345 Humano Humano<br />
6918 4826 A A<br />
ST10<br />
Cplx<br />
A1 2341 Humano Humano<br />
No<br />
patógeno<br />
No<br />
patógeno<br />
No<br />
patógeno<br />
No<br />
patógeno<br />
No<br />
patógeno<br />
Ninguno O11:H Ninguna 2003 Edo México México<br />
Ninguno O8:H18 Ninguna 2003 Edo México México<br />
Ninguno O:H9 Ninguna 2003 Edo México México<br />
Ninguno O9:H11 Ninguna 2003 DF México<br />
Ninguno O35:H9 Ninguna 2003 DF México<br />
41724 4766 B1 B1 Ninguno A0 295 Humano Humano Patógeno ETEC O29:H21 Ninguna 1995 Morelos México<br />
43221 5298 A AxB1 Ninguno B1 7 Humano Humano Patógeno ETEC O29:H21 Ninguna 1995 Morelos México<br />
Souza, V.<br />
<strong>Instituto</strong> <strong>de</strong><br />
<strong>Ecología</strong>,<br />
<strong>UNAM</strong><br />
Souza, V.<br />
<strong>Instituto</strong> <strong>de</strong><br />
<strong>Ecología</strong>,<br />
<strong>UNAM</strong><br />
Souza, V.<br />
<strong>Instituto</strong> <strong>de</strong><br />
<strong>Ecología</strong>,<br />
<strong>UNAM</strong><br />
Souza, V.<br />
<strong>Instituto</strong> <strong>de</strong><br />
<strong>Ecología</strong>,<br />
<strong>UNAM</strong><br />
Souza, V.<br />
<strong>Instituto</strong> <strong>de</strong><br />
<strong>Ecología</strong>,<br />
<strong>UNAM</strong><br />
Souza, V.<br />
<strong>Instituto</strong> <strong>de</strong><br />
<strong>Ecología</strong>,<br />
<strong>UNAM</strong><br />
Souza, V.<br />
<strong>Instituto</strong> <strong>de</strong><br />
<strong>Ecología</strong>,<br />
<strong>UNAM</strong><br />
Souza, V.<br />
<strong>Instituto</strong> <strong>de</strong><br />
<strong>Ecología</strong>,<br />
<strong>UNAM</strong><br />
Souza, V.<br />
<strong>Instituto</strong> <strong>de</strong><br />
<strong>Ecología</strong>,<br />
<strong>UNAM</strong><br />
Souza, V.<br />
<strong>Instituto</strong> <strong>de</strong><br />
<strong>Ecología</strong>,<br />
<strong>UNAM</strong><br />
Faculty of<br />
Medicine,<br />
<strong>UNAM</strong><br />
Faculty of<br />
Medicine,<br />
<strong>UNAM</strong>
50<br />
48339 4883 B1 AxB1<br />
ST155<br />
Cplx<br />
B1 2340 Humano Humano Patógeno ETEC O6:H16 Ninguna 1995 Morelos México<br />
50417 4706 B1 B1 Ninguno B1 120 Humano Humano Patógeno ETEC O:H- Diarrea 1995 Morelos México<br />
63880 4782 Sin grupo ABD Ninguno A0 2332 Humano Humano Patógeno ETEC O6:H16 Diarrea 1995 Morelos México<br />
Faculty of<br />
Medicine,<br />
<strong>UNAM</strong><br />
Faculty of<br />
Medicine,<br />
<strong>UNAM</strong><br />
Faculty of<br />
Medicine,<br />
<strong>UNAM</strong><br />
a Grupo ancestral arrojado por el análisis <strong>de</strong> recombinación mediante el algoritmo STRUCTURE.<br />
b Complejo Clonal<br />
c Grupo Clermont: Asignación a grupo filogenético según el método <strong>de</strong> Clermont et al., 2000.<br />
d ST: SecuencioTipo (Sequence Type)
51<br />
5. Artículo 2<br />
“El tamaño <strong>de</strong>l genoma en Escherichia coli no se encuentra <strong>de</strong>terminado por su historia<br />
filogenética”<br />
5.1. Resumen<br />
Las poblaciones bacterianas presentan variación en el tamaño <strong>de</strong>l genoma tanto a nivel<br />
inter-específico como intra-específico. Esta variación es clasificada principalmente en<br />
dos partes: el genoma central (que se refiere a los genes compartidos por todas las<br />
cepas) y el genoma flexible (referente a los genes compartidos por algunas cepas). Se ha<br />
propuesto que ésta variación guarda una clara relación con el nicho ecológico don<strong>de</strong><br />
habitan tales bacterias. Escherichia coli es un mo<strong>de</strong>lo apropiado para estudiar cómo el<br />
tamaño <strong>de</strong>l genoma evoluciona <strong>de</strong>bido a su versatilidad ecológica. Se ha propuesto que<br />
el genoma <strong>de</strong> E. coli presenta un rango <strong>de</strong> variación en el tamaño <strong>de</strong>l cromosoma que va<br />
<strong>de</strong> los 4.6 a los 5.6 Mb y que esta variación correlaciona con la estructura filogenética<br />
<strong>de</strong> la especie. Lo anterior implica que las cepas pertenecientes a los grupos A y B1<br />
cuentan con genomas pequeños con respecto a las cepas <strong>de</strong> los grupos B2, D y E. En un<br />
trabajo previo, encontramos que el genoma central <strong>de</strong> una muestra <strong>de</strong> E. coli aislada <strong>de</strong><br />
diversos hospe<strong>de</strong>ros presenta una gran dinámica evolutiva. El objetivo <strong>de</strong> este trabajo es<br />
evaluar la influencia <strong>de</strong> la estructura filogenética y el nicho ecológico en el dinamismo<br />
<strong>de</strong>l genoma flexible, reflejado en la variación en el tamaño <strong>de</strong>l cromosoma <strong>de</strong> esta<br />
muestra <strong>de</strong> E. coli previamente estudiada. Utilizando la técnica <strong>de</strong> electroforesis en<br />
campos pulsados, encontramos que el genoma flexible <strong>de</strong> esta muestra es dinámico lo<br />
cual se encuentra representado por el amplio rango <strong>de</strong>l tamaño <strong>de</strong>l cromosoma (2 Mb)<br />
el cual no se encuentra <strong>de</strong>terminado ni por la estructura filogenética y ni por el nicho<br />
ecológico <strong>de</strong> la muestra.
52<br />
Chromosome size variation in Escherichia coli is not linked either to phylogeny nor<br />
ecological niche<br />
González-González, A 1 ., Delgado, G 2 ., Eguiarte, L 1 ., Souza, V 1,*<br />
1 Departamento <strong>de</strong> <strong>Ecología</strong> Evolutiva, <strong>Instituto</strong> <strong>de</strong> <strong>Ecología</strong>, Universidad Nacional<br />
Autónoma <strong>de</strong> México, Apartado Postal 70-275, México, D.F. 04510, México<br />
2 Departamento <strong>de</strong> Microbiología y Parasitología, Facultad <strong>de</strong> Medicina, Universidad<br />
Nacional Autónoma <strong>de</strong> México, México, D.F., México.<br />
* Corresponding author: Souza, V.<br />
Departamento <strong>de</strong> <strong>Ecología</strong> Evolutiva, <strong>Instituto</strong> <strong>de</strong> <strong>Ecología</strong>, Universidad Nacional<br />
Autónoma <strong>de</strong> México, Apartado Postal 70-275, México, D.F. 04510, México.<br />
Tel. (+52 55 56229006) Fax (+52 55 56228995)<br />
E-mail: souza@servidor.unam.mx<br />
Running title: Chromosome size variation in E. coli<br />
Status: en preparación para ser enviado a la revista Infection Genetics and Evolution ó<br />
Journal of Bacteriology.
53<br />
1<br />
Abstract<br />
2<br />
3<br />
4<br />
5<br />
6<br />
7<br />
8<br />
9<br />
10<br />
11<br />
12<br />
13<br />
14<br />
15<br />
16<br />
17<br />
Bacterial populations show both inter-specific and intra-specific variation in genome<br />
size. The genome size variation within a bacterial species is mainly classified in two<br />
parts: the core genome (genes shared by all strains) and the flexible genome (the genes<br />
shared by some but not all the strains). It is proposed this variation has a clear<br />
relationship with the ecological niche where bacteria distribute. Escherichia coli is a<br />
suitable mo<strong>de</strong>l to study how chromosome size evolve because its ecological versatility.<br />
It has been previously suggested that E. coli genomes vary in size from 4.6 to 5.6 Mb<br />
and that this variation correlates well with the phylogenetic structure of species having<br />
A and B1 strains smaller genomes than B2, D and E strains. In a previous work we<br />
<strong>de</strong>scribed the core genome of a wi<strong>de</strong> E. coli host sample as highly evolutionary<br />
dynamic. The objective of this study is to evaluate the influence of the phylogenetic<br />
structure and ecological niche in the dynamism of flexible genome reflected in the<br />
chromosome size variation of this E. coli sample. Using pulsed field gel electrophoresis<br />
technique, we found dynamism of flexible genome represented by a wi<strong>de</strong> range of<br />
chromosome size not <strong>de</strong>termined neither by the phylogeny nor ecology of the sample.<br />
18<br />
19<br />
20<br />
21<br />
22<br />
23<br />
24<br />
25
54<br />
26<br />
27<br />
28<br />
29<br />
30<br />
31<br />
32<br />
33<br />
34<br />
35<br />
36<br />
37<br />
38<br />
39<br />
40<br />
41<br />
42<br />
43<br />
44<br />
45<br />
46<br />
47<br />
48<br />
49<br />
50<br />
1. Introduction<br />
It is well known that bacterial populations might show an intra-specific variation in<br />
chromosome size. This variability in gene content between isolates of the same species<br />
has been observed as the result of distinct molecular events such as point mutation,<br />
homologous recombination, <strong>de</strong>letions, duplications, inversions, and horizontal gene<br />
transfer (Mira et al., 2001; Gregory and DeSalle, 2005). Moreover, it has been<br />
suggested a clear relationship between the ecological niche and the bacterial genome<br />
size where, free-living bacteria has the largest genome size, the facultative pathogens<br />
the intermediate and the obligate symbionts or pathogens the smallest ones (Ochman<br />
and Dávalos, 2006).<br />
Escherichia coli is a suitable mo<strong>de</strong>l to study how chromosome size evolve because its<br />
ecological versatility. i.e. the majority of E. coli live as a harmless commensal in the gut<br />
and other E. coli strains have the capacity to cause disease in humans and many animals<br />
(Savageau, 1983; Kaper et al., 2004; Tenaillon et al., 2010). It has been previously<br />
suggested that E. coli genomes vary in size from 4.6 to 5.6 Mb (Bergthorsson and<br />
Ochman, 1998) suggesting the phenotypic diversity among pathogenic and commensal<br />
E. coli mirrors their genome content. This size diversity indicates the presence of<br />
different amounts of strain-specific genetic information, which may represent up to 30%<br />
of the complete genome content. Furthermore, an open pangenome it has been<br />
<strong>de</strong>termined for this enteric species suggesting E. coli still evolves by gene acquisition<br />
and diversification processes (Rasko et al., 2008; Touchon et al., 2009). Thus, it has<br />
been suggested that evolution of the E. coli variants results from or<strong>de</strong>red gene<br />
acquisition events and loss of genetic information together with DNA rearrangements<br />
and point mutations (Lawrence et al., 1998; Ochman et al., 2000; Dobrindt et al., 2010).<br />
Furthermore, it is assumed that genome size in E. coli correlates well with their
55<br />
51<br />
52<br />
phylogenetic structure having A and B1 strains smaller genomes than B2, D and E<br />
strains (Bergthorsson and Ochman, 1998).<br />
53<br />
54<br />
55<br />
56<br />
57<br />
58<br />
59<br />
60<br />
61<br />
62<br />
63<br />
64<br />
65<br />
66<br />
67<br />
68<br />
69<br />
To date, there are around four hundred E. coli genome sequences in databases.<br />
Nevertheless, most of these are human pathogenic isolates outbreak related, being<br />
animal and environmental strains un<strong>de</strong>rrepresented. In a previous study where a nonoutbreak<br />
related host-wi<strong>de</strong> sample of 128 E. coli isolates were analyzed (González-<br />
González et al., 2013), we reported high levels of genetic diversity driven mainly by<br />
homologous recombination and to a lesser extent by point mutation. Furthermore, we<br />
found both intra and inter lineage recombination differentiating the “core” genome of<br />
this sample. Moreover we proposed clonal complexes as evolutionary units since they<br />
display different genetic diversification processes coupled to particular lifestyles.<br />
Consi<strong>de</strong>ring the evolutionary dynamics of the core genome above <strong>de</strong>scribed, the<br />
objective of this study is to evaluate the magnitu<strong>de</strong> of the flexible genome dynamism of<br />
E. coli un<strong>de</strong>r ecological and phylogenetic terms. To achieve partially this objective, we<br />
measure the chromosome size of the same sample of non-outbreak related E. coli strains<br />
isolated from a wi<strong>de</strong> range of host to assesses if these traits are either associated with<br />
the phylogenetic groups where the strains belong or with the different ecological niches<br />
where this species lives.<br />
70<br />
71<br />
2. Material and Methods<br />
72<br />
73<br />
74<br />
2.1. Bacterial strains<br />
A total of 128 E. coli strains encompassing a wi<strong>de</strong> range of hosts both pathogenic and
56<br />
75<br />
76<br />
77<br />
78<br />
79<br />
80<br />
81<br />
82<br />
83<br />
84<br />
85<br />
86<br />
87<br />
88<br />
89<br />
90<br />
91<br />
92<br />
93<br />
non-pathogenic isolates were analyzed in this study. Such sample was previously<br />
assessed by González-González et al. (2013) and consi<strong>de</strong>rs strains exclusively isolated<br />
from Mexican hosts <strong>de</strong>posited in the <strong>Instituto</strong> <strong>de</strong> <strong>Ecología</strong> Collection of E. coli (IECOL)<br />
and in the Enteric Pathogen Reference Laboratory Collection, Public Health<br />
Department, Facultad <strong>de</strong> Medicina both at the Universidad Nacional Autónoma <strong>de</strong><br />
México.<br />
Three groups of E. coli strains were analyzed: a) 39 strains isolated from healthy<br />
animals from which, 25 were isolated from wild animals [5 enteropathogenic E. coli<br />
(EPEC), 4 enterotoxigenic E. coli (ETEC) and 16 non-pathogenic strains], 4 strains<br />
from captive animals [1 ETEC and 3 non-pathogenic strains] and 10 strains from<br />
domesticated animals [2 enterohemorragic E. coli (EHEC), 2 EPEC, 1 ETEC and 5 nonpathogenic<br />
strains]; b) 67 human strains from which, 14 strains were isolated from<br />
faeces of diarrheagenic babies [12 enteroaggregative E. coli (EAEC) and 2 ETEC<br />
strains], 10 strains from the faeces of healthy babies [1 EPEC, 2 EAEC, 1 EHEC, 3<br />
ETEC and 3 non-pathogenic isolates] and 43 strains from healthy adults [8 EHEC, 6<br />
enteroinvasive E. coli (EIEC), 11 EPEC, 13 ETEC and 5 non-pathogenic strains]; c) 22<br />
environmental strains, from which 9 were isolated from air (2 EPEC, 7 unknown), 4<br />
from soil (1 EIEC, 3 unknown), 1 from drainpipe, 6 from mud and 2 isolates from water<br />
(Supplementary Table 1).<br />
94<br />
95<br />
96<br />
97<br />
98<br />
99<br />
2.2. Preparation of DNA<br />
Genomic DNA preparation was carried out with modifications from the method<br />
<strong>de</strong>scribed by Liu et al. (1993) and Matushek et al. (1996). Bacteria were grown<br />
overnight in 5ml of Luria-Bertani (LB) broth and harvested by centrifugation. The<br />
bacterial pellet was washed twice in 500 µl of PIV (10 mM Tris [pH 8], 1 M NaCl) and
57<br />
100<br />
101<br />
102<br />
103<br />
104<br />
105<br />
106<br />
107<br />
108<br />
109<br />
adjusted to 5 OD at 600 nm. Then, 0.2 ml of this cell suspension were embed<strong>de</strong>d in 0.2<br />
ml of 1.5 % low melting point agarose (Seaplaque GTG agarose) temperated to 37ºC.<br />
This mixture was distributed into plug molds (BioRad) and waited to solidify. Agarose<br />
plugs were incubated twice at 37ºC in 2 ml of lysis solution (1 M Tris [pH 8], 1 M<br />
NaCl, 0.5 M EDTA [pH 8], 0.5% sodium <strong>de</strong>oxicolate, 12.5% N-lauroyl-sarcosine, 5<br />
µg/ml RNAse, 10 µg/ml lysozyme). First incubation was for 3 h and the second one<br />
overnight in new lysis solution at 50ºC in ESP (10 mM Tris HCl [pH7.4], 1 mM EDTA,<br />
0.25% N-lauroyl-sarcosine, 0.1 mg/ml proteinase K [Sigma]. Finally, plugs were<br />
washed seven times (1 h each wash) in TE (Tris-HCl 10 mM [pH 8], 1 mM EDTA [pH<br />
8]) and store into fresh TE buffer at 4ºC.<br />
110<br />
111<br />
112<br />
113<br />
114<br />
115<br />
2.3. I-CeuI endonuclease digestion<br />
Agarose plugs were equilibrated at 37ºC in 1X corresponding buffer enzyme during 1<br />
hour. Then, they were suspen<strong>de</strong>d in 0.1 ml of digestion mix (4 U of I-CeuI [New<br />
England Biolabs], 1X enzyme buffer, 1X BSA [bovine serum albumin]) and incubated<br />
at 37ºC overnight.<br />
116<br />
117<br />
118<br />
119<br />
120<br />
121<br />
122<br />
123<br />
124<br />
2.4. Pulsed-field gel electrophoresis (PFGE) and chromosome size estimation<br />
Electrophoresis was performed in Bio-Rad CHEF Mapper electrophoresis system in a<br />
1% agarose (Seakem Gold agarose) gel and 0.5X TBE (90 mM Tris, 90 mM boric acid,<br />
2 mM EDTA, pH8) buffer at 12°C. To resolve fragments ranging from 4000 kb’s to<br />
1400 kb’s a two program blocks was used with the following conditions: block 1 with a<br />
pulse time ramped from 20 min to 29 min 45 s over 60 h followed by a block 2 with a<br />
pulse time ramped from 2.31 s to 2 min 25 s over 7 h. The <strong>de</strong>vice was at 2 V/cm with<br />
53º angle for the first block and at 6 v/cm with 60º angle for the second block. For
58<br />
125<br />
126<br />
127<br />
128<br />
129<br />
fragments in the range of 1400 kb’s to 40 kb’s three program blocks was performed as<br />
follows: in block 1 a pulse time ramped from 50 s to 2 min over 21 h, in block 2 a<br />
pulsed time ramped from 20 s to 1 min 20 s over 10 h and in block 3 a pulse time<br />
ramped from 3 s to 12 s over 7 h. The <strong>de</strong>vice for three blocks was at 4 V/cm with 60º<br />
angle.<br />
130<br />
131<br />
132<br />
133<br />
134<br />
135<br />
136<br />
137<br />
138<br />
139<br />
2.5. Visualization of bands and chromosome size measurements<br />
Gels were stained with ethidium bromi<strong>de</strong>, photographed un<strong>de</strong>r UV light and then<br />
analyzed in Bionumerics software (Bionumerics version 2.5; Applied Maths, Kortrijk,<br />
Belgium). Escherichia coli K12 MG1665 and Pseudomonas aeruginosa PAO1<br />
chromosomes were used as molecular size markers in or<strong>de</strong>r to obtain the chromosome<br />
size of bacterial isolates. Size of each molecular marker band was obtained in silico<br />
using the program MapDraw implemented in the DNASTAR Lasergene package.<br />
Chromosome size was estimated by adding up the sizes of the restriction fragments<br />
produced in these digests.<br />
140<br />
141<br />
142<br />
143<br />
144<br />
2.6. Statistical analysis<br />
A factorial ANOVA analysis implemented in SPSS 15.0 software (SPSS, Inc, Chicago,<br />
IL) was performed in or<strong>de</strong>r to know which strain trait reveals differences in average<br />
chromosome size.<br />
145<br />
146<br />
3. Results<br />
147<br />
148<br />
3.1. Variation in chromosome size among natural isolates of E. coli in Mexico
59<br />
149<br />
150<br />
151<br />
152<br />
Based on the cumulative sizes of the I-Ceu-I digested fragments for each strain, natural<br />
isolates of Mexican E. coli can differ by over 2 Mbp in the lengths of their<br />
chromosomes, with sizes ranging from 4,007 to 6,097 kb (Supplementary Table S1,<br />
Supplementary Table S2, Figure 1).<br />
153<br />
154<br />
155<br />
156<br />
157<br />
158<br />
159<br />
160<br />
161<br />
162<br />
163<br />
164<br />
3.2.Chromosome size differences according to E. coli traits in Mexico<br />
Consi<strong>de</strong>ring isolate traits such as phylogenetic group/lineage belonging, host and life<br />
style together, the factorial analysis suggests that only phylogenetic group/lineage trait<br />
yields significant differences in chromosome size (F = 2.7, P = <strong>0.0</strong>19) (Figure 1 and<br />
Figure 2). It has been previously reported that Mexican E. coli strains are clustered into<br />
A, B1, B2, D, and E phylogenetic groups in addition to A-ST522 and B1-ST86 lineages<br />
(González-González et al., 2013). However, as phylogenetic groups and lineages<br />
display heterogeneous variances (Levene’s Test, F = 3.83, P = <strong>0.0</strong>06) this significant<br />
difference (Brown-Forsythe’s Test, F = 3.657, P = <strong>0.0</strong>05) is due to the fact that A<br />
chromosomes are significantly smaller than B1 (Table 1), while the other groups are<br />
equal in their chromosomes sizes (post hoc Games-Howell test, P = <strong>0.0</strong>23) (Figure 1).<br />
165<br />
166<br />
4. Discussion<br />
167<br />
168<br />
4.1. Similar chromosome size variation of Mexican E. coli to another samples<br />
169<br />
170<br />
171<br />
172<br />
173<br />
E. coli genome size variation has been previously reported in a subset of the ECOR<br />
collection (Bergthorsson and Ochman, 1998) as well as in whole genomic surveys of<br />
commensal and pathogenic type strains (Rasko et al., 2008, Touchon et al., 2009).<br />
Contrasting our results with these previous works, we found that Mexican E. coli
60<br />
174<br />
175<br />
176<br />
177<br />
178<br />
179<br />
180<br />
181<br />
182<br />
183<br />
184<br />
185<br />
186<br />
187<br />
188<br />
189<br />
190<br />
191<br />
sample displays a little more wi<strong>de</strong> genome size variation range (0.5 Mbp more bigger).<br />
This chromosome size difference could harbour new genes thus contributing to expand<br />
the pangenome of E. coli, but further genome sequencing of these strains is nee<strong>de</strong>d. It is<br />
important to note that the pulsed field gel electrophoresis (PFGE) method applied in this<br />
study yields consistent results with other PFGE analysis (Bergthorsson and Ochman,<br />
1998) and with the genome sequencing technique (Supplementary Table S3) (Rasko et<br />
al., 2008, Touchon et al., 2009; Kuo et al., 2011). Unlike the studies mentioned above<br />
we found strains (IE-5020 and IE-3691) with a genome size around 6 Mbp in our<br />
sample. This observation is supported by the existence of strains in other collections<br />
presenting this similar genome size (Supplementary Table S3). Remarkably, some of<br />
these isolates belong to O111 serogroup, which together with O26 and O103 serogroups<br />
are consi<strong>de</strong>red atypical enteropathogenic E. coli strains (aEPEC) (Bielaszewska et al.,<br />
2008), frequently associated to food-borne outbreaks and emergent diarrhoea among<br />
children worldwi<strong>de</strong> (Brooks et al., 2005; Trabulsi et al., 2002, Robins-Browne et al.,<br />
2004; Nguyen et al., 2006). It has been previously suggested that these serotypes<br />
contain surprisingly large numbers of prophages and integrative elements associated to<br />
virulence factors than the typical O157:H7 EHEC strains (Ogura et a., 2009) thus<br />
explaining in part their largest chromosome sizes.<br />
192<br />
193<br />
194<br />
4.2. Chromosome size of Mexican Escherichia coli not present a phylogenetic<br />
component<br />
195<br />
196<br />
197<br />
198<br />
It has been proposed that genome size in E. coli correlates well with their phylogenetic<br />
structure having A and B1 strains smaller genomes than B2, D and E strains<br />
(Bergthorsson and Ochman, 1998). Nevertheless, our study suggests that B1
61<br />
199<br />
200<br />
201<br />
202<br />
203<br />
204<br />
205<br />
phylogenetic group has larger chromosomes than A group being the other phylogenetic<br />
groups not statistically different. This discrepancy could be explained by the host-wi<strong>de</strong><br />
associated sample here studied in contrast to the restricted nature of the ECOR sample<br />
analyzed in the Bergthorsson and Ochman study. Furthermore, when the Clermont<br />
group assignation method was consi<strong>de</strong>red, B1 group has larger chromosomes than A<br />
(post hoc Games-Howell test, P = <strong>0.0</strong>05) and B2 phylogenetic groups (post hoc Games-<br />
Howell test, P = <strong>0.0</strong>06) (Supplementary Table S4).<br />
206<br />
207<br />
208<br />
209<br />
210<br />
211<br />
212<br />
213<br />
214<br />
215<br />
216<br />
217<br />
218<br />
219<br />
220<br />
It is assumed that A and B1 groups cluster commensal gut associated strains in contrast<br />
to B2 and D groups which harbour extra-intestinal pathogenic isolates (Escobar-Páramo<br />
et al., 2006). Nevertheless in this study, groups A and B1 harbour both commensal and<br />
pathogenic strains. Genome sequencing of several B2 strains suggests chromosome<br />
sizes around 4.6 and 5.6 Mbp (Welch et al., 2002; Rasko et al., 2008; Toh et al., 2010).<br />
In our study we found that B2 group has a chromosome size mean of 4.7 Mbp<br />
clustering commensal and pathogenic strains isolated from human and wild animal<br />
faeces. This finding agrees with the chromosome size <strong>de</strong>termined for a B2 human<br />
commensal bacterium (SE15, O150:H5) containing fewer virulence-related genes than<br />
the typical extra intestinal strains (Toh et al., 2010). It has been pointed out that ExPEC<br />
virulence factors i<strong>de</strong>ntified in commensal B2 strains may facilitate colonization of the<br />
human gut acting as fitness factors for commensal E. coli strains (Le Gall et al., 2007).<br />
Thus, genome sequencing of the wild animal and human strains here studied could shed<br />
light on this niche colonization processes.<br />
221<br />
222<br />
223<br />
Furthermore, when we consi<strong>de</strong>r the genome size of the strains conforming the clonal<br />
complexes (CC) <strong>de</strong>tected in this sample (González-González, et al., 2013), we found
62<br />
224<br />
225<br />
226<br />
227<br />
228<br />
229<br />
230<br />
that ST11-Cplx, ST20-Cplx and ST29-Cplx (associated to highly pathogenic E. coli<br />
strains with different homologous recombination rates and represented in this sample by<br />
O55, O157 O111 and O26 serogroups) (Figure 3) harbour similar genome sizes. In<br />
contrast, CCs such as ST86-Cplx, ST394-Cplx, ST69-Cplx, ST28-Cplx and ST10-Cplx<br />
are more diverse in their genome content. Interestingly, these latter CCs represent<br />
environmental, wild animal and generalist ecotypes thus suggesting epi<strong>de</strong>mic clones<br />
un<strong>de</strong>rgo a restrict genome diversification dynamic.<br />
231<br />
232<br />
233<br />
234<br />
235<br />
236<br />
237<br />
238<br />
239<br />
240<br />
241<br />
242<br />
243<br />
244<br />
245<br />
246<br />
247<br />
4.3. Chromosome size of Mexican Escherichia coli not present an ecological component<br />
It has been previously suggested that in bacteria, there is a correlation between the<br />
genome size and their lifestyle being largest genome sizes commonly consi<strong>de</strong>red an<br />
adaptation to changing environments (Moran, 2002; Konstantidinis et al., 2004;<br />
Ochman and Davalos, 2006). In our study, we did not find statistical differences in<br />
chromosome size either among the different hosts (animal, human and environment) nor<br />
life styles (non-pathogenic and pathogenic). Our genome size estimates of some nonpathogenic<br />
wild animal and human strains (5 to 5.4 Mbp) agree with those present in<br />
non-pathogenic wild animals of Australia (Supplementary Table S5). Recently, the<br />
genome size of a commensal strain isolated from porcine faeces belonging to<br />
phylogenetic group B1 (AI27) was <strong>de</strong>terminated in 4.9 Mbp. This strain has complete<br />
genetic regions coding for ExPEC type virulence factors absent in most B1 strains (Lee<br />
et a., 2012). Likewise, other commensal members of B1 group have genome sizes<br />
around 5.1 Mbp and harbour several genetic elements absent in pathogenic strains (Kim<br />
et al., 2012). All the above suggests the existence of several genome diversification<br />
processes associated to the adaptation to different niches.<br />
248
63<br />
249<br />
250<br />
251<br />
252<br />
253<br />
254<br />
255<br />
256<br />
257<br />
258<br />
259<br />
260<br />
261<br />
262<br />
263<br />
264<br />
265<br />
266<br />
267<br />
268<br />
269<br />
270<br />
271<br />
272<br />
273<br />
4.4. Ecological strategies and copy number of rRNA operons in E. coli<br />
As previously mentioned, we estimated the genome size of each isolated by pulsed field<br />
gel electrophoresis cutting with the I-CeuI endonuclease. Due the specific restriction<br />
site of I-Ceu I (Marshall and Lemieux, 1992), the total number of bands visualized in<br />
each fingerprint was consi<strong>de</strong>red as an estimator of the total number of rRNA operons<br />
for each strain (Liu et al., 1993; Bergthorsson and Ochman, 1998). As genes encoding<br />
the 5S, 16S, and 23S ribosomal RNAs are clustered into a rRNA operon, it has been<br />
previously suggested that the number of ribosomal RNA operons is an ecological<br />
strategy for responding to environmental variation and fluctuations in resource<br />
availability (oligotrophs have few rRNA genes than copiotrophs) (Klappenbach et al.,<br />
2000; Stevenson and Schmidt, 2004).<br />
The copy number of rRNA operons per bacterial genome varies from 1 to as many as<br />
15. For example, species as Mycoplasma pneumonie and Roseobacter <strong>de</strong>nitrificans have<br />
one rRNA operon, while Bacillus subtilis and Clostridium paradoxum have fifteen<br />
copies (Klappenbach et al., 2000). Although variation in operon numbers between<br />
different bacterial species haven been well documented, variations between strains of<br />
the same species are consi<strong>de</strong>red less often. The variation in operon numbers does not<br />
appear to be large, but the phenomenon is not restricted to a specific phylogenetic group<br />
since operon variation between strains of the same species was <strong>de</strong>tected for diverse<br />
species as Vibrio cholerae, Bacillus cereus and Yersinia pestis (Acinas et al., 2004).<br />
Regarding E. coli, it has been proposed seven copies per genome being the number of<br />
rrn operons conserved among natural strains of this species (Bergthorsson and Ochman,<br />
1998). In this work, the majority of the 128 Mexican isolates produced seven fragments<br />
as the result of convergent evolution although the different ecological niches where E.<br />
coli inhabits. We suggest this convergence of the rrn operon number is explained by the
64<br />
274<br />
275<br />
276<br />
277<br />
278<br />
279<br />
280<br />
281<br />
282<br />
283<br />
284<br />
285<br />
286<br />
287<br />
288<br />
289<br />
290<br />
291<br />
292<br />
293<br />
294<br />
flux between the primary and secondary habitats where E. coli inhabits. Nevertheless<br />
we found three Mexican E. coli isolates having eight rrn operons (Supplementary<br />
information). Two strains, one isolated from drainpipe (IE-3720) and the other from<br />
mud (IE-3885), belong to phylogenetic group A and to ST10-Cplx, the most wi<strong>de</strong>spread<br />
clonal complex. The third is a B1 strain isolated from a healthy human (IE-6879).<br />
Remarkably, the environmental strains have a “standard” chromosome size (4.5 and 4.9<br />
Mbp) in contrast to the human strain, which has a bigger chromosome size (5.4 Mbp).<br />
This suggests that there is not a tight relationship between the chromosome architecture<br />
and its size. Interestingly, no relationship between chromosome size and rrn operon<br />
number was found, suggesting that is not necessary to have more rrn operons to<br />
replicate more faster larger chromosomes as previously suggested (Fegatella et al.,<br />
1998; Strehl et al., 1999; Lauro et al., 2009). Moreover, further studies have to be<br />
performed in or<strong>de</strong>r to elucidate the genetic mechanisms that origin a new rrn operon<br />
copy, and their physiological and ecological implications in terms of the capacity to<br />
respond to environmental fluctuation and resource availability. Regarding strains with<br />
six rrn operons, we have to perform more studies in or<strong>de</strong>r to validate this result.<br />
Although it has been suggested that at least one rRNA operon can be <strong>de</strong>leted from E.<br />
coli without obvious <strong>de</strong>leterious effects (Ellwood and Nomura, 1980; Stevenson and<br />
Schmidt, 2004), it is clear that some of the seven operons has distinct responses to<br />
particular physiological and genetic perturbations (Condon et al., 1992; Stevenson and<br />
Schmidt, 2004).<br />
295<br />
296<br />
5. Conclusion and perspectives<br />
297
65<br />
298<br />
299<br />
300<br />
301<br />
302<br />
303<br />
304<br />
305<br />
306<br />
307<br />
308<br />
309<br />
310<br />
311<br />
312<br />
313<br />
314<br />
315<br />
316<br />
317<br />
318<br />
319<br />
320<br />
321<br />
322<br />
323<br />
324<br />
325<br />
326<br />
327<br />
328<br />
In this study we investigated the chromosome size of Mexican non-outbreak related E.<br />
coli strains isolated from a host wi<strong>de</strong> range. Overall, we found natural isolates of<br />
Mexican E. coli can differ by over 2 Mbp in the lengths of their chromosomes.<br />
Likewise, our analysis suggest that phylogenetic group B1 contains the largest<br />
chromosomes of the sample meanwhile B2 strains have similar chromosome sizes than<br />
A strains in contrast to the previously suggested. Moreover, we did not find a significant<br />
association with the ecological niche and chromosome size. All the above suggests a<br />
dynamic flexible genome represented by the chromosome size range variation present in<br />
this E. coli sample. However, in or<strong>de</strong>r to shed light on the molecular processes and gene<br />
flow dynamics governing the evolution of E. coli genome size, we propose the isolates<br />
analyzed in this study should be sequenced because the wi<strong>de</strong> range of ecological niches<br />
displayed.<br />
6. Acknowledgements<br />
We thank José Luis Mén<strong>de</strong>z for technical support during the <strong>de</strong>velopment of the<br />
project. We also thank Jorge Valdivia for the fruitful discussion regarding the ecological<br />
strategies and copy number of rRNA operons. This paper is part of the doctoral research<br />
of the first author, who thanks the Doctorado en Ciencias Biomédicas (Universidad<br />
Nacional Autónoma <strong>de</strong> México) and CONACYT (Grant: 169917). The project was<br />
supported by grant DGPA-<strong>UNAM</strong> PAPIIT IN219109.<br />
7. References<br />
Acinas, S.G., Marcelino, L.A., Klepac-Ceraj, V., Polz, M. 2004. Divergence and redundancy of<br />
16S rRNA sequences in genomes with multiple rrn operons. J. Bacteriol. 186, 2629-2635.<br />
Bergthorsson, U., Ochman, H. 1998. Distribution of chromosome length variation in natural<br />
isolates of Escherichia coli. Mol. Biol. Evol. 15, 6-16.
66<br />
329<br />
330<br />
331<br />
332<br />
333<br />
334<br />
335<br />
336<br />
337<br />
338<br />
339<br />
340<br />
341<br />
342<br />
343<br />
344<br />
345<br />
346<br />
347<br />
348<br />
349<br />
350<br />
351<br />
352<br />
353<br />
354<br />
355<br />
356<br />
357<br />
358<br />
359<br />
360<br />
361<br />
362<br />
363<br />
364<br />
365<br />
366<br />
367<br />
368<br />
369<br />
370<br />
371<br />
372<br />
373<br />
374<br />
375<br />
376<br />
377<br />
378<br />
379<br />
380<br />
381<br />
382<br />
383<br />
Bielaszewska, M., Mid<strong>de</strong>ndorf, B., Köck, R., Friedrich, A.W., Fruth, A., Karch, H., Schmidt,<br />
M.A., Mellmann, A., 2008. Shiga toxin-negative attaching and effacing Escherichia coli:<br />
distinct clinical associations with bacterial phylogeny and virulence traits and inferred in-host<br />
pathogen evolution. Clin. Infect. Dis. 47, 208-217.<br />
Brooks, J.T., Sowers, E., Wells, J., Greene, K., Griffin, P., Hoekstra, R., Strockbine, N. 2005.<br />
Non-O157 Shiga toxin-producing Escherichia coli infections in the United States, 1983-2002. J.<br />
Infect. Dis. 192, 1422-1429.<br />
Condon, C., Philips, J., Fu, Z.H., Squires, C., Squires, C.L. 1992. Comparison of the expression<br />
of the seven ribosomal RNA operons in Escherichia coli. The EMBO Journal. 11, 4175-4185.<br />
Dobrindt, U., Geddam, M., Krumbholz, G., Hacker, J. 2010. Genome dynamics and its impact<br />
on evolution of Escherichia coli. Med. Microbiol. Immunol. 199, 145-154.<br />
Ellwood, M., Nomura, M. 1980. Deletion of a ribosomal ribonucleic acid operon in Escherichia<br />
coli. J. Bacteriol. 143, 1077-1080.<br />
Fegatella, F., Lim, J., Kjelleberg, S., Cavicchioli, R. 1998. Implications of rRNA operon copy<br />
number and ribosome content in the marine oligotrophic ultramicrobacterium Sphingomonas sp.<br />
strain RB2256. Appl. Environ. Microbiol. 64, 4433-4438.<br />
Gregory, T.R., DeSalle, R. 2005. The evolution of genome size in prokaryotes. In: The<br />
evolution of the genome (Ed. T. R. Gregory). Elsevier, San Diego. 631-640.<br />
González-González, A., Sánchez-Reyes, L.L., Delgado, G., Eguiarte, L.E., Souza, V. 2013.<br />
Hierarchical clustering of genetic diversity associated to different levels of mutation and<br />
recombination in Escherichia coli: A study based on Mexican isolates. Infect. Genet. Evol. 13,<br />
187-197.<br />
Kaper, J.B., Nataro, J.P., Mobley, H.L., 2004. Pathogenic Escherichia coli. Nat. Rev.<br />
Microbiol. 2, 123-140.<br />
Klappenbach, J.A., Dunbar, J.M., Schmidt, Th.M. 2000. rRNA operon copy number reflects<br />
ecological strategies of bacteria. Appl. Environ. Microbiol. 66, 1328-1333.<br />
Kim, M., Yi, H., Cho, Y., Jang, J., Hur, H., Chun, J. 2012. Draft genome sequences of<br />
Escherichia coli W26, an enteric strain isolated from cow faeces. J. Bacteriol. 194, 5149-5150.<br />
Konstantinidis, K.T., Tiedje, J.M. 2004. Trends between gene content and genome size in<br />
prokaryotic species with larger genomes. Proc. Natl. Acad. Sci. USA. 101, 3160-3165.<br />
Kuo, C.H., Ochman, H., Raghavan, R. 2011. The genomics of Escherichia coli and beyond. In:<br />
Population Genetics of Bacteria: a tribute to Thomas Whittam. Walk, T., Feng, P.C.H. (eds).<br />
ASM Press, Washington, DC. pp. 31-42.<br />
Lane, D.J. 1991. 16S/23S rRNA sequencing. In: Stackebrandt, E., and Goodfellow, M. (Eds.),<br />
Nucleid Acid Techniques in Bacterial Systematics. Chichester, UK: Wiley, pp. 115-175.<br />
Lauro, et al. 2009. The genomic basis of trophic strategy in marine bacteria. Proc. Natl. Acad.<br />
Sci. USA. 106, 5527-5533.<br />
Lawrence, J.G., Ochman, H. 1998. Molecular archaeology of the Escherichia coli genome.<br />
Proc. Natl. Acad. Sci. USA. 95, 9413-9417.
67<br />
384<br />
385<br />
386<br />
387<br />
388<br />
389<br />
390<br />
391<br />
392<br />
393<br />
394<br />
395<br />
396<br />
397<br />
398<br />
399<br />
400<br />
401<br />
402<br />
403<br />
404<br />
405<br />
406<br />
407<br />
408<br />
409<br />
410<br />
411<br />
412<br />
413<br />
414<br />
415<br />
416<br />
417<br />
418<br />
419<br />
420<br />
421<br />
422<br />
423<br />
424<br />
425<br />
426<br />
427<br />
428<br />
429<br />
430<br />
431<br />
432<br />
433<br />
434<br />
435<br />
436<br />
Lee, K., Cho, Y., Jang, J., Hur, H., Chun, J. 2012. Draft genome sequence of Escherichia coli<br />
AI27, a porcine isolate belonging to phylogenetic group B1. J. Bacteriol. 194, 6640-6641.<br />
Le Gall, T., Clermont, O., Gouriou, S., Picard, B., Nassif, X., et al., 2007. Extraintestinal<br />
virulence is a coinci<strong>de</strong>ntal by-product of commensalism in B2 phylogenetic group Escherichia<br />
coli strains. Mol. Biol. Evol. 24, 2373-2384.<br />
Liu, S. L., A. Hessel and K. E. San<strong>de</strong>rson. 1993. Genomic mapping with I-Ceu I, an intronenco<strong>de</strong>d<br />
endonuclease specific for genes for ribosomal RNA, in Salmonella spp., Escherichia<br />
coli, and other bacteria. Proc. Natl. Acad. Sci. USA. 90:6874–6878.<br />
Marshall, P., Lemieux, C. 1992. The I-Ceu I, endonuclease recognizes a sequence of 19 base<br />
pairs and preferentially cleaves the coding strand of the Chlamydomonas moewusii chloroplast<br />
large subunit rRNA gene. Nucl. Ac. Res. 20, 6401-6407.<br />
Matushek, M. G., M. J. Bonten and M. K. Hay<strong>de</strong>n. 1996. Rapid preparation of bacterial DNA<br />
for pulsed-field gel electrophoresis. J. Clin. Microbiol. 34:2598–2600.<br />
Mira, A., Ochman, H., Moran, N. 2001. Deletional bias and the evolution of bacterial genomes.<br />
Trends Genet. 17, 589-596.<br />
Moran, N.A. 2002. Microbial minimalism: genome reduction in bacterial pathogens. Cell. 108,<br />
583-586.<br />
Nguyen R.N., Taylor, L.S., Tauschek, M., Robins-Browne, R.M. 2006. Atypical<br />
enteropathogenic Escherichia coli infection and prolonged diarrhea in children. Emerg. Infect.<br />
Dis. 12, 597-603.<br />
Ochman, H., Lawrence, J., Groisman, E. 2000. Lateral gene transfer and the nature of bacterial<br />
innovation. Nature. 405, 299-304.<br />
Ochman, H., Dávalos, L.M. 2006. The nature and dynamics of bacterial genomes. Science 311,<br />
1730-1733.<br />
Ogura, Y., Tadasuke, O., Iguchi, A., Toh, H., Asadulghani, Md., Oshima, K., et al. 2009.<br />
Comparative genomics reveal the mechanism of the parallel evolution of O157 and non-O157<br />
enteroherrhagic Escherichia coli. Proc. Natl. Acad. Sci. USA 106, 17939-17944.<br />
Rasko, D.A, Rosovitz, M.J., Myers, G.S., Mongodin, E.F., Fricke, W.F. Gajer, P., Crabtree, J.,<br />
et al. 2008. The pangenome structure of Escherichia coli: comparative genomic analysis of E.<br />
coli commensal and pathogenic isolates. J. Bacteriol. 190, 6881-6893.<br />
Robins-Browne, R.M., Bordun, A., Tuschek, M., et al. 2004. Escherichia coli and communityacquired<br />
gastroenteritis, Melbourne, Australia. Emerg. Infect. Dis. 10, 1797-805.<br />
Sambrook J, Fritsch, E.F., Maniatis, T. 1989. Molecular cloning: a laboratory manual. Cold<br />
Spring Harbor Laboratory Press.<br />
Savageau, M.A., 1983. Escherichia coli habitats, cell types, and molecular mechanisms of gene<br />
control. Am. Nat. 122, 732-744.<br />
SPSS for Windows (Computer program). Version 15.0. Chicago: SPSS Inc; 2007.<br />
Stevenson, B.S., Schmidt, Th.M. 2004. Life history implications of rRNA gene copy number in<br />
Escherichia coli. Appl. Environ. Microbiol. 70, 6670-6677.
68<br />
437<br />
438<br />
439<br />
440<br />
441<br />
442<br />
443<br />
444<br />
445<br />
446<br />
447<br />
448<br />
449<br />
450<br />
451<br />
452<br />
453<br />
454<br />
455<br />
456<br />
457<br />
458<br />
459<br />
Strehl, B., Holtzendorff, J., Partensky, F., Hess, W.R. 1999. A small and compact genome in the<br />
marine cyanobacterium Prochlorococcus marinus CCMP 1375: lack of an intron in the gene for<br />
tRNA (Leu) UAA and a single copy of the rRNA operon. FEMS Microbiol. Lett. 181, 261-266.<br />
Tenaillon, O., Skurnik, D., Picard, B., Denamur, E., 2010. The population genetics of<br />
commensal Escherichia coli. Nat. Rev. Microbiol. 8, 207-217.<br />
Toh, H., Oshima, K., Toyoda, A., Ogura, Y., et al. 2010. Complete genome sequence of the<br />
wild-type commensal Escherichia coli strain SE15, belonging to phylogenetic group B2. J.<br />
Bacteriol. 192, 1165-1166.<br />
Touchon, M., Hoe<strong>de</strong>, C., Tenaillon, O., Barbe, V., Baeriswyl, S., et al., 2009. Organised<br />
genome dynamics in Escherichia coli species results in highly diverse adaptive paths. PLoS<br />
Genetics 5, e1000344.<br />
Trabulsi, L.R., Keller, R., Gomes T.A.T. 2002. Typical and atypical enteropathogenic<br />
Escherichia coli. Emerg. Infec. Dis. 175, 508-513.<br />
Welch, R.A., Burland, V., Plunkett III, P.R., Roesch, P., Rasko, D., et al. 2002. Extensive<br />
mosaic structure revealed by the complete genome sequence of uropathogenic Escherichia coli.<br />
Proc. Natl. Acad. Sci. USA 99, 17020-17024.
69<br />
Supplementary information<br />
Determination of the rRNA operons number<br />
Due the specific restriction site of I-Ceu I endonuclease (Marshall and Lemieux, 1992),<br />
the total number of bands visualized in each fingerprint was consi<strong>de</strong>red as an estimator<br />
of the total number of rRNA operons for strain (Liu et al., 1993; Bergthorsson and<br />
Ochman, 1998). In or<strong>de</strong>r to corroborate the number of rRNA operons in cases where<br />
more than seven I-Ceu I fragments were yiel<strong>de</strong>d, a hybridization analysis of the E. coli<br />
16S and 23S rRNA genes was carried out. Thus, PFGE gels with the digested atypical<br />
strains were transferred overnight to positively charged nylon membrane (Hybond TM -<br />
N + , Amersham Pharmacia Biotech UK) by Southern Blotting method (Sambrook et al<br />
1989). Hybridization analysis of the E. coli 16S and 23S rRNA genes was carried out<br />
using a DIG High Prime DNA labeling and <strong>de</strong>tection starter kit II (Roche Diagnostics).<br />
PCR probes were obtained as follows: 16S rRNA gene PCR amplification was<br />
performed as <strong>de</strong>scribed previously in Lane (1991). For 23S rRNA gene PCR mixture<br />
consisted of 10 ng of DNA template, 20 pmol of each PCR primer (Invitrogen), 1 x PCR<br />
buffer (Invitrogen), 1.5 mM MgCl 2 (Invitrogen), 1 U of Taq DNA polymerase<br />
(Invitrogen), and 0.2 mM of each <strong>de</strong>oxynucleosi<strong>de</strong> triphosphates (Invitrogen). PCR<br />
amplification consisted of 10 min of <strong>de</strong>naturation at 94°C followed by 30 cycles of 1<br />
min of <strong>de</strong>naturation at 94°C, 1 min of annealing at 58ºC and 1 min of extension at 72°C<br />
and finally a cycle of 10 min of extension at 72ºC on a MJ Research PTC-200 Peltier<br />
Thermal Cycler (MJ Research Inc, Watertown, Mass., USA). E. coli K12 MG1655 was<br />
used as template to both genes. Primers for the PCR amplification and fragment size of<br />
each gene are listed in Table 1. DNA probes (1 µg) were labeled using the DIG High<br />
Prime DNA accordingto the manufacturer's protocol. Membranes were pre-hybridized in
70<br />
hybridization solution at 58 °C for 30min. Hybridizationwas carried out in a hybridization<br />
solution containing labeled DNA (25 ng ml –1 ) at 58 °C overnight to both genes. After<br />
hybridization, membranes were washed twice in 2x SSC and 0·1 % SDS solution at 15-25<br />
ºC by 5 min, and washed again, twice in 0·5x SSC and 0·1 % SDS solution at 68 °C by 12<br />
min. Chemiluminescence <strong>de</strong>tection with CSPD ready-to-use was done by exposure of<br />
membranes to Lumi-Film Chemiluminescent Detection Film (Roche Diagnostics,<br />
GMBH, Mannheim, Germany) for 1 hr.<br />
Table 1. rRNA genes selected to hybridization analysis<br />
Gene Primer Sequence 5’-3’ Fragment<br />
Reference<br />
size<br />
16S<br />
27F<br />
AGAGTTTGATCCCTCAG<br />
≈ 1450 pb Lane, 1991<br />
1492R<br />
ACCTTGTTACGACTT<br />
23S<br />
23S4F<br />
ACTGGGGCGGTCTCCTC<br />
≈ 616 bp<br />
Delgados et<br />
23S4R<br />
CATCGCTGCGCTTACACA<br />
al., en<br />
revision<br />
References:<br />
Bergthorsson, U., Ochman, H. 1998. Distribution of chromosome length variation in natural<br />
isolates of Escherichia coli. Mol. Biol. Evol. 15, 6-16.<br />
Lane, D.J. 1991. 16S/23S rRNA sequencing. In: Stackebrandt, E., and Goodfellow, M. (Eds.),<br />
Nucleid Acid Techniques in Bacterial Systematics. Chichester, UK: Wiley, pp. 115-175.<br />
Liu, S. L., A. Hessel and K. E. San<strong>de</strong>rson. 1993. Genomic mapping with I-Ceu I, an intronenco<strong>de</strong>d<br />
endonuclease specific for genes for ribosomal RNA, in Salmonella spp., Escherichia<br />
coli, and other bacteria. Proc. Natl. Acad. Sci. USA. 90:6874–6878.<br />
Marshall, P., Lemieux, C. 1992. The I-Ceu I, endonuclease recognizes a sequence of 19 base<br />
pairs and preferentially cleaves the coding strand of the Chlamydomonas moewusii chloroplast<br />
large subunit rRNA gene. Nucleic Acids Research 20, 6401-6407.<br />
Sambrook J, Fritsch, E.F., Maniatis, T. 1989. Molecular cloning: a laboratory manual. Cold<br />
Spring Harbor Laboratory Press.
Figure 1 (a) Unrooted consensus tree displaying the relationship between the 82 STs of<br />
the Mexican E. coli sample at seven concatenated housekeeping genes (3423<br />
nucleoti<strong>de</strong>s in total) (González-González et al., 2013). (b) Chromosome size of the<br />
Mexican E. coli phylogenetic groups in mega bases (Mbp).<br />
71
Figure 2. Chromosome size in mega bases (Mbp) associated to different E. coli (a) life<br />
style, (b) pathogenic type, (c) host and (d) host type. No significant differences were<br />
found between different lifestyles (Brown-Forsythe Test, P = 0.211) neither between<br />
host type (Brown-Forsythe Test, P = <strong>0.0</strong>85).<br />
72
Figure 3. Chromosome size, recombination rate and ecotype associated to Mexican E.<br />
coli clonal complexes. r/m: Relative impact of recombination as compared to point<br />
mutation on the genetic differentiation of population. Each colour of clonal complex<br />
represents its phylogenetic group belonging as follows: phylogenetic group E is<br />
indicated by green, phylogenetic group B1 by blue, lineage B1-ST86 by magenta,<br />
phylogenetic group D by yellow, phylogenetic group B2 by red and phylogenetic group<br />
A by lilac colour.<br />
73
74<br />
Supplementary Table S2. Chromosome size of Mexican Escherichia coli isolates.<br />
Strain<br />
Locus<br />
rrn b Total<br />
(Kb’s) a (Kb's)<br />
size<br />
size<br />
1 42 115 144 610 730 1100 2650,8 7 5392<br />
3 42 95 135 521 610 900 2463 7 4766<br />
19 42 95 160 521 670 730 2622,9 7 4841<br />
33 42 115 144 550 730 1100 2500 7 5181<br />
53 42 95 144 550 670 730 2581,9 7 4813<br />
55 42 95 144 550 730 900 2607,6 7 5069<br />
68 42 115 135 550 730 900 2670,7 7 5143<br />
75 42 95 135 521 730 1100 2572,3 7 5195<br />
88 42 95 135 521 705 730 2510,8 7 4739<br />
90 42 95 144 580 705 730 2750 7 5046<br />
95 42 95 310 348 521 1100 2500 7 4916<br />
270 42 95 144 521 670 1100 2523,7 7 5096<br />
271 42 95 144 521 670 1100 2500 7 5072<br />
272 42 95 115 580 705 900 2446 7 4883<br />
288 42 95 135 521 670 900 2500 7 4863<br />
807 42 95 135 180 610 1700 2369,1 7 5131<br />
814 42 115 160 550 670 705 2434,6 7 4677<br />
815 42 115 160 521 670 705 2500 7 4713<br />
825 42 95 144 580 670 730 2500 7 4761<br />
830 42 95 144 580 705 900 3137,2 7 5603<br />
1639 42 95 160 550 670 705 2472,6 7 4695<br />
1684 42 95 135 521 670 900 2500 7 4863<br />
1728 42 95 160 521 670 705 2506,8 7 4700<br />
1735 42 95 144 521 705 1700 2518,2 7 5725<br />
1743 42 95 144 521 670 730 2573,1 7 4775<br />
1744 42 95 135 521 610 705 2500 7 4608<br />
1937 42 95 144 521 670 730 2500 7 4702<br />
1940 42 95 135 521 610 730 2500 7 4633<br />
1967 42 95 135 550 670 730 2500 7 4722<br />
2055 42 95 144 521 705 1100 2500 7 5107<br />
2064 42 95 144 521 670 705 2848,3 7 5025<br />
2065 42 95 128 521 610 705 2500 7 4601<br />
3442 42 95 135 487 610 670 2562,5 7 4602<br />
3456 42 95 160 521 670 705 2500 7 4693<br />
3463 42 95 160 521 670 705 2441,1 7 4634<br />
3470 42 115 135 550 705 730 2650,8 7 4928<br />
3524 42 95 135 521 670 730 2657,7 7 4851<br />
3528 42 95 144 550 670 730 2500 7 4731<br />
3535 42 95 144 521 705 730 2500 7 4737<br />
3566 42 95 135 550 610 670 2500 7 4602<br />
3607 42 95 160 521 730 1100 2839,7 7 5488<br />
3609 42 115 160 610 900 1100 2500 7 5427<br />
3614 42 95 144 521 705 900 2500 7 4907<br />
3617 42 95 135 550 670 900 2500 7 4892<br />
3620 42 95 135 521 670 900 2500 7 4863<br />
3621 42 95 135 580 900 2500 6 4252<br />
3622 42 95 160 580 900 1100 2769,2 7 5646
3623 42 95 144 610 670 900 2763,2 7 5224<br />
3625 42 95 160 521 730 900 2500 7 4948<br />
3627 42 95 115 580 730 900 2500 7 4962<br />
3628 42 95 160 580 670 1100 2500 7 5147<br />
3629 42 95 135 521 670 900 2500 7 4863<br />
3630 42 95 135 610 900 2400 6 4182<br />
3631 42 95 135 550 730 900 2832,3 7 5284<br />
3635 42 95 160 550 730 1100 2500 7 5177<br />
3637 42 95 135 550 705 730 2500 7 4757<br />
3641 42 95 135 521 705 900 2500 7 4898<br />
3646 42 84 135 550 670 705 2500 7 4686<br />
3648 42 95 144 580 670 730 2500 7 4761<br />
3650 42 95 255 357 705 3321,9 6 4776<br />
3651 42 95 310 341 900 1100 2907,9 7 5696<br />
3652 42 95 135 521 610 705 2500 7 4608<br />
3653 42 115 160 550 705 730 2500 7 4802<br />
3655 42 95 144 580 705 1100 2702,5 7 5369<br />
3657 42 95 135 550 670 705 2500 7 4697<br />
3658 42 95 135 521 705 1700 2500 7 5698<br />
3659 42 95 310 341 900 1100 2817,7 7 5606<br />
3662 42 95 144 521 705 2500 6 4007<br />
3663 42 95 135 550 705 900 2500 7 4927<br />
3664 42 95 115 580 670 705 2585,1 7 4792<br />
3665 42 115 135 521 670 705 2500 7 4688<br />
3673 42 95 135 550 670 900 2500 7 4892<br />
3677 42 95 115 521 670 705 2500 7 4648<br />
3681 42 95 135 521 610 730 2400 7 4533<br />
3682 42 95 144 580 670 705 3080 7 5316<br />
3683 42 95 144 580 670 730 2500 7 4761<br />
3687 42 95 135 475 550 730 2370 7 4397<br />
3691 42 95 180 550 900 1700 2630,1 7 6097<br />
3693 42 115 144 580 730 900 2500 7 5011<br />
3694 42 95 135 521 610 730 2778,4 7 4911<br />
3697 42 95 144 521 705 2500 6 4007<br />
3698 42 95 115 610 900 2396 6 4158<br />
3700 42 95 135 521 670 730 2500 7 4693<br />
3702 42 95 135 550 670 730 2500 7 4722<br />
3707 42 95 135 550 900 1100 2764 7 5586<br />
3711 42 95 135 521 670 1100 2500 7 5063<br />
3712 42 95 135 521 670 1700 2500 7 5663<br />
3713 42 95 144 580 705 1100 2681,7 7 5348<br />
3715 50 95 144 550 670 705 2500 7 4714<br />
3716 42 95 144 550 705 1100 2500 7 5136<br />
3719 42 95 144 580 670 705 2500 7 4736<br />
3720 84 115 135 186 265 459 705 2524 8 4473<br />
3824 42 95 135 521 670 730 2500 7 4693<br />
3842 42 95 144 550 670 705 2500 7 4706<br />
3859 42 95 135 521 610 705 2777,4 7 4885<br />
3873 42 95 135 521 670 705 2500 7 4668<br />
3874 42 95 135 521 670 705 2500 7 4668<br />
3876 42 95 135 550 670 2755,3 6 4247<br />
3885 84 115 135 200 255 459 900 2750,8 8 4899<br />
4129 42 115 135 550 670 730 2500 7 4742<br />
75
76<br />
4130 42 115 135 550 670 730 2476,6 7 4719<br />
4132 42 115 135 550 670 730 2500 7 4742<br />
4135 42 95 144 521 610 730 2500 7 4642<br />
4136 42 115 144 550 670 730 2500 7 4751<br />
4952 42 95 265 348 705 730 2500 7 4685<br />
4953 42 95 255 370 705 730 3079,7 7 5277<br />
4957 42 95 160 521 670 705 2500 7 4693<br />
4958 42 95 135 200 487 670 2809,1 7 4438<br />
4959 42 95 160 580 705 900 3176,4 7 5658<br />
4962 42 95 144 580 705 900 3179,7 7 5646<br />
4964 42 95 144 580 670 1100 2943,2 7 5574<br />
4976 42 95 310 341 730 1100 2752 7 5370<br />
4993 42 95 144 521 610 705 2500 7 4617<br />
5014 42 95 255 370 705 730 2809,8 7 5007<br />
5020 42 95 144 521 730 1700 2675,5 7 5908<br />
5021 42 95 144 521 670 705 2606,7 7 4784<br />
5040 42 95 135 580 670 1100 2500 7 5122<br />
5058 42 95 357 370 550 1700 2500 7 5614<br />
6879 42 95 144 521 610 670 705 2599,9 8 5387<br />
6891 42 115 144 550 670 900 2652 7 5073<br />
6908 42 95 128 255 550 580 2506 7 4156<br />
6909 42 95 135 521 610 705 2500 7 4608<br />
6918 42 95 160 521 670 705 2632,6 7 4826<br />
41724 42 95 144 550 705 730 2500 7 4766<br />
43221 42 95 160 550 670 1100 2680,9 7 5298<br />
48334 42 95 144 521 670 730 2680,9 7 4883<br />
50417 42 95 144 550 670 705 2500 7 4706<br />
63880 42 95 160 550 705 730 2500 7 4782<br />
a Tamaño <strong>de</strong> cada uno <strong>de</strong> los fragmentos arrojados por la enzima <strong>de</strong> restricción I-CeuI.<br />
b Número <strong>de</strong> operones ribosomales por aislado (rrn). Este número correspon<strong>de</strong> al<br />
número <strong>de</strong> cortes que arroja la enzima <strong>de</strong> restricción I-CeuI.
77<br />
Supplementary Table S3. Chromosome size of sequenced Escherichia coli isolates<br />
Organism BioProject Plasmids<br />
Escherichia coli O157:H7 str.<br />
Sakai<br />
Escherichia coli SE11<br />
Escherichia coli str. K-12<br />
substr. MG1655<br />
Escherichia coli O26:H11 str.<br />
11368<br />
Escherichia coli 'BL21-<br />
Gold(DE3)pLysS AG'<br />
Escherichia coli 042<br />
Escherichia coli 536<br />
Escherichia coli 55989<br />
Size<br />
(Mb)<br />
Gene<br />
Pathogenic/<br />
NonPathog<br />
enic<br />
PRJNA57781,<br />
PRJNA226 2 5,59 5.460 p<br />
PRJNA59425,<br />
PRJNA18057 6 5,16 5.105 n<br />
PRJNA57779,<br />
PRJNA225 - 4,64 4.496 n<br />
PRJNA41021,<br />
PRJDA32509 4 5,86 5.989 p<br />
PRJNA59245,<br />
PRJNA30681 - 4,57 4.425<br />
PRJEA161985,<br />
PRJEA40647 1 5,36 5.036 p<br />
PRJNA58531,<br />
PRJNA16235 - 4,94 4.779 p<br />
PRJNA59383,<br />
PRJNA33413 - 5,15 5.140 p<br />
Escherichia coli ABU 83972<br />
PRJNA161975,<br />
PRJNA38725 1 5,13 4.906 n<br />
Escherichia coli APEC O1<br />
PRJNA58623,<br />
PRJNA16718 2 5,5 4.968 p<br />
Escherichia coli ATCC 8739<br />
PRJNA58783,<br />
PRJNA18083 - 4,75 4.408 n<br />
Escherichia coli B str. REL606<br />
PRJNA58803,<br />
PRJNA18281 - 4,63 4.365<br />
Escherichia coli BL21(DE3)<br />
Escherichia coli BL21(DE3)<br />
Escherichia coli BW2952<br />
Escherichia coli CFT073<br />
Escherichia coli DH1<br />
Escherichia coli DH1<br />
Escherichia coli E24377A<br />
Escherichia coli ED1a<br />
Escherichia coli ETEC<br />
H10407<br />
Escherichia coli HS<br />
Escherichia coli IAI1<br />
Escherichia coli IAI39<br />
Escherichia coli IHE3034<br />
Escherichia coli KO11FL<br />
Escherichia coli KO11FL<br />
Escherichia coli LF82<br />
Escherichia coli NA114<br />
Escherichia coli O103:H2 str.<br />
12009<br />
Escherichia coli O111:H- str.<br />
11128<br />
Escherichia coli O127:H6 str.<br />
E2348/69<br />
Escherichia coli O157:H7 str.<br />
EC4115<br />
Escherichia coli O157:H7 str.<br />
EDL933<br />
Escherichia coli O157:H7 str.<br />
TW14359<br />
Escherichia coli O55:H7 str.<br />
CB9615<br />
Escherichia coli O55:H7 str.<br />
RM12579<br />
PRJNA161947,<br />
PRJNA20713 - 4,56 4.334<br />
PRJEA161949,<br />
PRJEA28965 - 4,56 4.422<br />
PRJNA59391,<br />
PRJNA33775 - 4,58 4.267<br />
PRJNA57915,<br />
PRJNA313 - 5,23 5.579 p<br />
PRJNA161951,<br />
PRJNA30031 - 4,63 4.375<br />
PRJDA162051,<br />
PRJDA52077 - 4,62 4.450<br />
PRJNA58395,<br />
PRJNA13960 6 5,25 5.258 p<br />
PRJNA59379,<br />
PRJNA33409 - 5,21 5.325 n<br />
PRJEA161993,<br />
PRJEA42749 4 5,33 5.086 p<br />
PRJNA58393,<br />
PRJNA13959 - 4,64 4.629 n<br />
PRJNA59377,<br />
PRJNA33373 - 4,7 4.633 p<br />
PRJNA59381,<br />
PRJNA33411 - 5,13 5.097 p<br />
PRJNA162007,<br />
PRJNA43693 - 5,11 4.970 p<br />
PRJNA52593,<br />
PRJNA33875 2 5,03 4.885<br />
PRJNA162099,<br />
PRJNA62299 1 5,03 4.825<br />
PRJNA161965,<br />
PRJNA33825 - 4,77 4.545 p<br />
PRJNA162139,<br />
PRJNA66975 - 4,97 4.975 p upec<br />
PRJNA41013,<br />
PRJDA32511 1 5,52 5.545 p ehec<br />
PRJNA41023,<br />
PRJDA32513 5 5,77 5.935 p ehec<br />
PRJNA59343,<br />
PRJEA32571 2 5,07 5.015 p epec<br />
PRJNA59091,<br />
PRJNA27739 2 5,7 6.066 p ehec<br />
PRJNA57831,<br />
PRJNA259 1 5,62 5.528 p ehec (isolated from USA food)<br />
PRJNA59235,<br />
PRJNA30045 1 5,62 5.588 p ehec<br />
PRJNA46655,<br />
PRJNA42729 1 5,45 5.371 p epec<br />
PRJNA162153,<br />
PRJNA68245 5 5,45 5.255 p epec<br />
Host
78<br />
Escherichia coli O7:K1 str.<br />
CE10<br />
Escherichia coli O83:H1 str.<br />
NRG 857C<br />
Escherichia coli P12b<br />
Escherichia coli S88<br />
Escherichia coli SE15<br />
Escherichia coli SMS-3-5<br />
Escherichia coli UM146<br />
Escherichia coli UMN026<br />
Escherichia coli UMNK88<br />
Escherichia coli UTI89<br />
Escherichia coli W<br />
Escherichia coli W<br />
Escherichia coli Xuzhou21<br />
Escherichia coli str. 'clone D<br />
i14'<br />
Escherichia coli str. 'clone D<br />
i2'<br />
Escherichia coli str. K-12<br />
substr. DH10B<br />
Escherichia coli str. K-12<br />
substr. W3110<br />
Escherichia coli O157:H7 str.<br />
TW14588<br />
PRJNA162115,<br />
PRJNA63597 4 5,38 5.269 p nmec<br />
PRJNA161987,<br />
PRJNA41221 1 4,89 4.690 p aiec<br />
PRJNA162061,<br />
PRJNA59455 - 4,94 4.581 n<br />
PRJNA62979,<br />
PRJNA33375 1 5,17 5.191 p nmec<br />
PRJDA161939,<br />
PRJDA19053 1 4,84 4.594 n comensal<br />
PRJNA58919,<br />
PRJNA19469 4 5,22 5.127 n free-living<br />
PRJNA162043,<br />
PRJNA50883 1 5,11 4.891 p aiec<br />
PRJNA62981,<br />
PRJNA33415 2 5,36 5.298 p upec<br />
PRJNA161991,<br />
PRJNA42137 5 5,67 5.754 p etec (porcine/post-weaning diarrhea in pigs)<br />
PRJNA58541,<br />
PRJNA16259 1 5,18 5.272 p upec<br />
PRJNA162011,<br />
PRJNA48011 2 5,01 4.880<br />
PRJNA162101,<br />
PRJNA62301 2 5,01 4.848<br />
PRJNA163995,<br />
PRJNA45823 2 5,52 5.298 p ehec<br />
PRJNA162049,<br />
PRJNA52023 - 5,04 5.049 p commensal/upec (dog)<br />
PRJNA162047,<br />
PRJNA52021 - 5,04 5.049 p commensal/upec (dog)<br />
PRJNA58979,<br />
PRJNA20079 - 4,69 4.356 n<br />
PRJNA161931,<br />
PRJNA16351 - 4,65 4.440 n<br />
PRJNA55087,<br />
PRJNA28847 1 5,67 6.011 p ehec<br />
Escherichia coli UMNF18 PRJNA48455 5 - - p ETEC (porcine/post-weaning diarrhea in pigs)<br />
Escherichia coli str. K-12<br />
substr. MG1655 PRJNA40075 - 4,64 - n<br />
Escherichia coli str. K-12<br />
substr. MG1655star PRJNA51747 - 4,64 - n<br />
Escherichia coli 1.2264 PRJNA51097 - 5,5 5.661 isolated from a goat Capra hircus (O76:H-)<br />
Escherichia coli 1.2741 PRJNA51085 - 5,69 5.914 isolated from a cow (O2:H4<br />
Escherichia coli 101-1<br />
PRJNA54363,<br />
PRJNA16193 - 4,98 5.155 p eaec<br />
Escherichia coli 1827-70<br />
PRJNA60615,<br />
PRJNA40257 - 4,8 4.822 <br />
Escherichia coli 2.3916 PRJNA51123 - 5,64 6.179 isolated from a pig<br />
Escherichia coli 2.4168 PRJNA51127 - 4,74 4.804 isolated from water<br />
PRJNA60613,<br />
Escherichia coli 2362-75 PRJNA40275 - 5,17 5.343 p epec<br />
Escherichia coli 2534-86 PRJNA48251 - 5,29 5.642 etec (O8:K87)<br />
Escherichia coli 3.2303 PRJNA51129 - 4,95 5.149 isolated from water<br />
Escherichia coli 3.2608 PRJNA51105 - 5,45 5.670 isolated from a horse<br />
Escherichia coli 3.3884 PRJNA51125 - 5,23 5.311 isolated from a cow<br />
Escherichia coli 3003 PRJNA51131 - 4,92 4.982 isolated from water<br />
Escherichia coli 3030-1 PRJNA48253 - 5,25 5.456 <br />
Escherichia coli 3431 PRJNA40265 - 5,22 5.322 da-epec<br />
Escherichia coli 4.0522 PRJNA51109 - 5,83 6.308 isolated from a cow<br />
Escherichia coli 4.0967 PRJNA51121 - 5,87 6.266 isolated from a rabbit<br />
Escherichia coli 4_1_47FAA PRJNA39385 - 5,26 5.389 <br />
Escherichia coli 5.0588 PRJNA51089 - 5 5.137 isolated from a cow<br />
Escherichia coli 5.0959 PRJNA51115 - 5,42 5.710 isolated from an unknown host<br />
PRJNA54321,<br />
Escherichia coli 53638 PRJNA15639 2 5,37 5.654 eiec<br />
Escherichia coli 541-1 PRJNA47101 - 5 4.984 Homo sapiens ileum<br />
Escherichia coli 541-15 PRJNA47099 - 5,03 5.065 Homo sapiens ileum<br />
Escherichia coli 576-1 PRJNA47103 - 5,19 5.292 p invasive E. coli<br />
Escherichia coli 75 PRJNA47105 - 4,6 4.484<br />
PRJNA55485,<br />
Escherichia coli 83972 PRJNA31467 - 5,07 5.380 isolated from a clinical ABU episo<strong>de</strong><br />
Escherichia coli 9.0111 PRJNA51119 - 5,73 6.149 O128 isolated from human, stx1 stx2 genes
79<br />
Escherichia coli 9.1649 PRJNA51117 - 5,1 - O2:H- isolated from pig, stx1 stx2<br />
Escherichia coli 900105 (10e) PRJNA51137 - 5,56 5.983 O26:H11 isolated from calf in 1990, stx1<br />
Escherichia coli 93-001 PRJNA65775 - 5,38 5.805 isolated from Bos taurus (O157:H7 related)<br />
Escherichia coli 93.0624 PRJNA51107 - 5,28 5.459 O103:H6 isolated from human, stx1<br />
Escherichia coli 95.0941 PRJNA51095 - 4,79 - O45:H2 isolated from human, stx1 and stx2<br />
Escherichia coli 96.0497 PRJNA51101 - 5,01 5.026 O91:H21 isolated from human, stx1<br />
Escherichia coli 96.154 PRJNA51113 - 4,95 4.981 O113:H12 isolated from human, stx2<br />
Escherichia coli 97.0246 PRJNA51087 - 5,5 5.924 O5:H- isolated from cow, stx1, stx2<br />
Escherichia coli 97.0259 PRJNA51091 - 5,21 5.269 O11:H- isolated from cow, stx2<br />
Escherichia coli 97.0264 PRJNA51099 - 5,23 - O88:H25 isolated from cow, stx1, stx2<br />
Escherichia coli 99.0741 PRJNA51103 - 5,45 5.724 O91:H- isolated from food, stx1, stx2<br />
Escherichia coli AA86 PRJNA65321 1 4,98 4.819 n isolated from healthy cow feces<br />
Escherichia coli AI27 PRJNA89369 - 4,9 4.750 isolated from porcine feces in South Korea<br />
PRJNA47003,<br />
Escherichia coli B088 PRJNA38905 - 4,94 4.671 isolated from bird (Circus assimilis)<br />
Escherichia coli B093 PRJNA38907 - 5,19 4.990 isolated from bird (Strepera graculina)<br />
Escherichia coli B171<br />
PRJNA54319,<br />
PRJNA15630 1 5,5 5.932 p epec<br />
Escherichia coli B185<br />
PRJNA47001,<br />
PRJNA38915 - 5,11 4.797 isolated from bird (Turdus merula)<br />
Escherichia coli B354<br />
PRJNA46999,<br />
PRJNA38917 - 4,83 4.724 isolated from bird (Monarca trivirgatus)<br />
Escherichia coli B41 PRJNA51135 - 5,01 5.075<br />
O101:HNM isolated from pig, does not enco<strong>de</strong> for stx1<br />
nor stx2<br />
Escherichia coli B799 PRJNA38929 - 5,3 5.203 isolated from bird (Sericornis frontalis)<br />
PRJNA54297,<br />
Escherichia coli B7A<br />
PRJNA15572 - 5,3 5.529 p etec (O148:H28)<br />
Escherichia coli CUMT8 PRJNA47109 - 4,71 4.635 p adherent and invasive pathotype (O8:H21)<br />
Escherichia coli DEC10A PRJNA50999 - 5,37 5.838 p<br />
Escherichia coli DEC10B PRJNA51001 - 5,58 6.104 p ehec (O26:H11 isolated from australian human)<br />
ehec (O26:H11 isolated from USA infant human with<br />
Escherichia coli DEC10C PRJNA51003 - 5,53 6.026 p acute gastroenteritis)<br />
Escherichia coli DEC10D PRJNA51005 - 5,4 5.878 p<br />
Escherichia coli DEC10E PRJNA51007 - 5,17 5.361 p ehec (O26:H11 isolated from USA cow-calf)<br />
Escherichia coli DEC10F PRJNA51009 - 5,76 6.202 p<br />
Escherichia coli DEC11A PRJNA51011 - 5,22 5.365 p epec (O128a:H2 isolated from USA human with diarrhea)<br />
diarrheagenic E. coli (O128a:H2 isolated from USA<br />
Escherichia coli DEC11B PRJNA51013 - 5,23 5.390 p infant human with diarrhea)<br />
Escherichia coli DEC11C PRJNA51015 - 5,55 5.998 p<br />
Escherichia coli DEC11D PRJNA51017 - 5,3 5.498 p<br />
Escherichia coli DEC11E PRJNA51019 - 5,13 5.294 p<br />
Escherichia coli DEC12A PRJNA51021 - 5,36 5.769 p<br />
Escherichia coli DEC12B PRJNA51023 - 5,49 5.920 p<br />
diarrheagenic E. coli (O128:H2 isolated from UK infant<br />
human, source Dr. Cravioto)<br />
diarrheagenic E. coli (O128:H2 isolated from Brazil<br />
infant human with diarrhea)<br />
epec (O111:H2 isolated from UK infant human with<br />
diarrhea)<br />
epec (O111:H2 isolated from USA human with diarrhea<br />
outbreak)<br />
Escherichia coli DEC12C PRJNA51025 - 5,45 5.922 p epec (O111:HNM isolated from Panama human)<br />
Escherichia coli DEC12D PRJNA51027 - 5,4 5.775 p<br />
Escherichia coli DEC12E PRJNA51029 - 5,3 5.556 p<br />
Escherichia coli DEC13A PRJNA51031 - 4,69 4.758 p<br />
Escherichia coli DEC13B PRJNA51033 - 4,71 4.801 p<br />
Escherichia coli DEC13C PRJNA51035 - 5,29 5.522 p<br />
Escherichia coli DEC13D PRJNA51037 - 5,01 5.123 p<br />
Escherichia coli DEC13E PRJNA51039 - 4,98 5.049 p<br />
Escherichia coli DEC14A PRJNA51043 - 4,95 5.022 p<br />
Escherichia coli DEC14B PRJNA51045 - 5,27 5.519 p<br />
Escherichia coli DEC14C PRJNA51047 - 5,15 5.407 p<br />
Escherichia coli DEC14D PRJNA51049 - 5,18 5.368 p<br />
Escherichia coli DEC15A PRJNA51053 - 5,25 5.414 p<br />
Escherichia coli DEC15B PRJNA51055 - 5,26 5.464 p<br />
diarrheagenic E. coli (O128:H7 isolated from USA<br />
human with diarrhea)<br />
diarrheagenic E. coli (O128:H7 isolated from USA<br />
human with diarrhea)<br />
diarrheagenic E. coli (O128:H7 isolated from Tanzania<br />
infant human with diarrhea)<br />
diarrheagenic E. coli (O128:H7 isolated from Rwanda<br />
infant human with diarrhea)<br />
diarrheagenic E. coli (O128:H47 isolated from USA<br />
human with diarrhea)<br />
diarrheagenic E. coli (O128:H21 isolated from Peru<br />
infant humanwith diarrhea)<br />
diarrheagenic E. coli (O128:H21 isolated from India<br />
infant human with diarrhea)<br />
diarrheagenic E. coli (O128a:H21 isolated from Peru<br />
human with diarrhea)<br />
diarrheagenic E. coli (O128:HNM isolated from USA<br />
human with diarrhea)<br />
epec (O111:H21 isolated from USA human with diarrhea<br />
from outbreak)<br />
diarrheagenic E. coli (O111:H21 isolated from USA<br />
human with diarrhea)<br />
Escherichia coli DEC15C PRJNA51057 - 5,2 5.308 p diarrheagenic E. coli (O111:H21 isolated from USA
80<br />
Escherichia coli DEC15D PRJNA51059 - 5,21 5.317 p<br />
Escherichia coli DEC15E PRJNA51061 - 5,23 5.418 p<br />
Escherichia coli DEC1A PRJNA50903 - 5,11 5.322 p<br />
Escherichia coli DEC1B PRJNA50905 - 5,2 5.472 p<br />
Escherichia coli DEC1C PRJNA50907 - 5,28 5.492 p<br />
Escherichia coli DEC1D PRJNA50909 - 5,16 5.420 p<br />
Escherichia coli DEC1E PRJNA50911 - 5,15 5.424 p<br />
Escherichia coli DEC2A PRJNA50913 - 5,09 5.362 p<br />
Escherichia coli DEC2B PRJNA50915 - 5,13 5.337 p<br />
Escherichia coli DEC2C PRJNA50917 - 5,3 5.599 p<br />
Escherichia coli DEC2D PRJNA50919 - 5,09 5.258 p<br />
human with diarrhea)<br />
diarrheagenic E. coli (O111:H21 isolated from USA<br />
human with diarrhea)<br />
diarrheagenic E. coli (O111:H21 isolated from USA<br />
human with diarrhea)<br />
epec (O55:H6 isolated from USA infant human with<br />
diarrhea outbreak)<br />
epec (O55:H6 isolated from Dutch infant human with<br />
diarrhea)<br />
epec (O55:H6 isolated from Germany infant human with<br />
diarrhea)<br />
epec (O55:H6 isolated from Congo infant human with<br />
diarrhea)<br />
epec (O55:HNM isolated from USA infant human with<br />
diarrhea outbreak)<br />
epec (O55:H6 isolated from USA infant human with<br />
diarrhea outbreak)<br />
Escherichia coli DEC2E PRJNA50921 - 5,21 5.425 p epec (O55:H6 isolated from USA human)<br />
Escherichia coli DEC3A PRJNA50923 - 5,45 5.692 p<br />
Escherichia coli DEC3B PRJNA50925 - 5,5 5.824 p ehec (O157:H7 isolated from USA human)<br />
ehec (O157:H7 isolated from USA human with<br />
Escherichia coli DEC3C PRJNA50927 - 5,48 5.850 p gastroenteritis)<br />
Escherichia coli DEC3D PRJNA50929 - 5,44 5.751 p ehec (O157:H7 isolated from USA human)<br />
Escherichia coli DEC3E PRJNA50931 - 5,52 5.900 p ehec (O157:H7 isolated from Canada human)<br />
Escherichia coli DEC3F PRJNA50933 - 5,41 5.692 p<br />
Escherichia coli DEC4A PRJNA50935 - 5,38 5.720 p ehec (O157:H7 isolated from Argentinca cow-calf)<br />
ehec (O157:H7 isolated from Denmark human woth<br />
Escherichia coli DEC4B PRJNA50937 - 5,63 6.097 p diarrhea)<br />
Escherichia coli DEC4C PRJNA50939 - 5,53 5.919 p<br />
Escherichia coli DEC4D PRJNA50941 - 5,39 5.676 p ehec (O157:H7 isolated from Japan cow-calf)<br />
ehec (O157:H7 isolated from Denmark human with<br />
Escherichia coli DEC4E PRJNA50943 - 5,41 5.683 p diarrhea)<br />
Escherichia coli DEC4F PRJNA50945 - 5,4 5.727 p<br />
Escherichia coli DEC5A PRJNA50947 - 5,37 5.425 p<br />
Escherichia coli DEC5B PRJNA50949 - 5,48 5.700 p<br />
ehec (O55:H7 isolated from USA infant human with<br />
diarrhea for more than 7 weeks)<br />
ehec (O55:H7 isolated from USA infant human with<br />
diarrhea)<br />
Escherichia coli DEC5C PRJNA50951 - 5,33 5.480 p ehec (O55:H7 isolated from USA human with diarrhea)<br />
Escherichia coli DEC5D PRJNA50953 - 5,23 5.320 p ehec (O55:H7 isolated from Sri Lanka human)<br />
Escherichia coli DEC5E PRJNA50955 - 5,68 5.936 p ehec (O55:H7 isolated from Iran human)<br />
Escherichia coli DEC6A PRJNA50957 - 5,39 5.679 p<br />
Escherichia coli DEC6B PRJNA50959 - 5,32 5.661 p<br />
Escherichia coli DEC6C PRJNA50961 - 5,12 5.503 p<br />
Escherichia coli DEC6D PRJNA50963 - 4,98 5.312 p<br />
Escherichia coli DEC6E PRJNA50965 - 5,08 5.323 p<br />
Escherichia coli DEC7A PRJNA50967 - 5,25 5.399 p<br />
Escherichia coli DEC7B PRJNA50969 - 5,24 5.414 p<br />
Escherichia coli DEC7C PRJNA50973 - 5,31 5.436 p<br />
Escherichia coli DEC7D PRJNA50975 - 5,36 5.517 p<br />
Escherichia coli DEC7E PRJNA50977 - 5,14 5.232 p<br />
diarrheagenic E. coli (O111:H21 isolated from USA<br />
infant human with diarrhea from an outbreak)<br />
diarrheagenic E. coli (O111:H12 isolated from Guatemala<br />
human with diarrhea)<br />
diarrheagenic E. coli (O157:H43 isolated from USA pig<br />
with septicemia)<br />
diarrheagenic E. Coli (O149:HNM isolated from small<br />
intestine of USA cow)<br />
diarrheagenic E. coli (O157:H43 isolated from USA pig<br />
with colibacilosis)<br />
Escherichia coli DEC8A PRJNA50979 - 5,65 6.141 p/n ehec (O111a:HNM isolated from stool of USA human)<br />
Escherichia coli DEC8B PRJNA50981 - 5,37 5.759 p<br />
Escherichia coli DEC8C PRJNA50983 - 5,91 6.505 p<br />
Escherichia coli DEC8D PRJNA50985 - 5,46 5.763 p<br />
Escherichia coli DEC8E PRJNA50987 - 5,32 5.711 p<br />
Escherichia coli DEC9A PRJNA50989 - 5,41 5.735 p<br />
ehec (O111:HNM isolated from USA cow-calf with<br />
scours)<br />
ehec (O111:H11 isolated from Cuba infant human with<br />
diarrhea)<br />
ehec (O111:H8 isolated from Denmark human with<br />
diarrhea)<br />
ehec (O26:H11 isolated from USA human with diarrhea<br />
and fever)<br />
Escherichia coli DEC9B PRJNA50991 - 5,36 5.616 p ehec (O26:HN isolated from USA human with diarrhea)<br />
Escherichia coli DEC9C PRJNA50993 - 5,19 5.369 p<br />
Escherichia coli DEC9D PRJNA50995 - 5,49 5.750 p<br />
Escherichia coli DEC9E PRJNA50997 - 5,43 5.768 p<br />
ehec (O26:H11 isolated from Denmark infant human with<br />
diarrhea)
81<br />
Escherichia coli E101 PRJNA38935 - 5,18 5.015<br />
Escherichia coli E110019<br />
PRJNA54303,<br />
PRJNA15578 - 5,38 5.681 p<br />
isolated from the environment (Lake Ginn<strong>de</strong>rra, ACT,<br />
Australia)<br />
atypical EPEC (O111:H9 isolated from a diarrhea<br />
outbreak in Finland, without EAF plasmid<br />
Escherichia coli E1167 PRJNA38941 - 4,92 4.724 p/n This strain will be used for comparative analysis<br />
Escherichia coli E128010 PRJNA40269 - 5,22 5.500 p aEPEC (O114:H2) diarrhea, human, Bangla<strong>de</strong>sh<br />
Escherichia coli E1520 PRJNA38945 - 4,9 4.777 p/n<br />
Escherichia coli E22<br />
PRJNA54301,<br />
PRJNA15577 - 5,53 5.831 p<br />
Escherichia coli E482 PRJNA38949 - 4,83 4.637 p/n<br />
Escherichia coli EC1734 PRJNA65941 - 5,43 5.685 p/n Human<br />
epec O103:H2 mo<strong>de</strong>l strain, with Locus LEE, Kaper<br />
strain, human, diarrhea, intestinal<br />
Escherichia coli EC1738 PRJNA65939 - 5,48 5.710 p ehec (O157:H7 isolated from USA human)<br />
Escherichia coli EC1845 PRJNA65949 - 5,36 5.749 p ehec (O157:H7 isolated from USA human)<br />
Escherichia coli EC1863 PRJNA65965 - 5,38 5.693 p ehec (O157:H7 isolated from USA human)<br />
Escherichia coli EC4013 PRJNA65927 - 5,35 5.714 p ehec (O157:H7 isolated from USA human)<br />
Escherichia coli EC4100B PRJNA61479 - 5,11 5.117 p ehec (O157:H7 isolated from USA human)<br />
Escherichia coli EC4196 PRJNA65917 - 5,36 5.830 p ehec (O157:H7 isolated from USA human)<br />
Escherichia coli EC4203 PRJNA65915 - 5,39 5.824 p ehec (O157:H7 isolated from USA human)<br />
Escherichia coli EC4402 PRJNA65929 - 5,45 5.953 p ehec (O157:H7 isolated from USA human)<br />
Escherichia coli EC4421 PRJNA65923 - 5,32 5.664 p ehec (O157:H7 isolated from USA human)<br />
Escherichia coli EC4422 PRJNA65925 - 5,32 5.625 p ehec (O157:H7 isolated from USA human)<br />
Escherichia coli EC4436 PRJNA65933 - 5,42 5.780 p ehec (O157:H7 isolated from USA human)<br />
Escherichia coli EC4437 PRJNA65935 - 5,41 5.820 p ehec (O157:H7 isolated from USA human)<br />
Escherichia coli EC4439 PRJNA65931 - 5,4 5.862 p ehec (O157:H7 isolated from USA human)<br />
Escherichia coli EC4448 PRJNA65937 - 5,49 5.969 p ehec (O157:H7 isolated from USA human)<br />
Escherichia coli EPEC C342-<br />
62 PRJNA49113 - 5,24 5.485 p epec (O126:H2 from human USA<br />
Escherichia coli EPECa12 PRJNA40273 - 5,23 5.479 p epec from human stool Brazil<br />
Escherichia coli EPECa14 PRJNA40267 - 5,44 5.994 p epec<br />
PRJNA54299,<br />
ExPEC (O6:H31, cystitis, infection of the blad<strong>de</strong>r,<br />
Escherichia coli F11<br />
PRJNA15576 - 5,22 5.307 p woman<br />
Escherichia coli FDA505 PRJNA65755 - 5,35 5.756 p ehec(O157:H7 isolated from USA human<br />
Escherichia coli FDA517 PRJNA65759 - 5,52 5.990 p ehec(O157:H7 isolated from USA human<br />
Escherichia coli FRIK1985 PRJNA65765 - 5,54 6.159 p ehec (O157:H7 isolated from Bos taurus, USA<br />
Escherichia coli FRIK1990 PRJNA65769 - 5,52 6.058 p ehec (O157:H7 isolated from Bos taurus, USA<br />
Escherichia coli FRIK1996 PRJNA65763 - 5,43 5.936 p ehec (O157:H7 isolated from Bos taurus, USA<br />
Escherichia coli FVEC1302<br />
PRJNA49707,<br />
PRJNA39915 - 5,29 5.199 human FVEC<br />
Escherichia coli FVEC1412<br />
PRJNA46997,<br />
PRJNA39917 - 5,19 5.055 human FVEC<br />
Escherichia coli G58-1 PRJNA48249 - 4,87 5.047 p<br />
etec (O101:K28:NM, isolated from a terrestial animal)<br />
Emerging Diarrhea pathogens project<br />
Escherichia coli H120 PRJNA38971 - 5,04 4.955 p/n This strain will be used for comparative analysis PATRIC<br />
Escherichia coli H252 PRJNA38981 - 5,26 5.126 p/n This strain will be used for comparative analysis PATRIC<br />
Escherichia coli H263 PRJNA38985 - 5,19 5.126 p/n This strain will be used for comparative analysis PATRIC<br />
Escherichia coli H299<br />
PRJNA52527,<br />
PRJNA38991 - 5,25 5.714 human<br />
Escherichia coli H30 PRJNA51093 - 5,49 - p<br />
diarrheagenic E. coli (O26:H11 isolated from UK human<br />
with diarrhea)<br />
Escherichia coli H397 PRJNA39001 - 5,21 5.121 human<br />
Escherichia coli H489 PRJNA39013 - 4,83 4.739 p/n This strain will be used for comparative analysis PATRIC<br />
Escherichia coli H494 PRJNA39015 - 5,09 4.960 human<br />
PRJNA52525,<br />
Escherichia coli H591 PRJNA39021 - 4,92 5.143 human<br />
Escherichia coli H730 PRJNA39031 - 5,05 4.960 human<br />
PRJNA52485,<br />
Escherichia coli H736 PRJNA39033 - 4,65 4.781 human<br />
Escherichia coli HM605 PRJNA47107 - 5,12 5.163 p<br />
Escherichia coli HM605 PRJEA66487 - 5,2 - p<br />
Escherichia coli J53 PRJNA82837 - 4,65 4.567<br />
Escherichia coli JB1-95 PRJNA51111 - 5,41 5.768<br />
Escherichia coli KD1 PRJNA47095 - 4,84 4.694<br />
Escherichia coli KD2 PRJNA47097 - 4,97 4.828<br />
Escherichia coli LCT-EC106 PRJNA89725 - 5,12 -<br />
Escherichia coli LT-68 PRJNA40261 - 5,19 5.697<br />
adherent and invasive pathotype (O8:H1), human patient<br />
suffering with Crohn's disease, not diarrhea associated<br />
adherent and invasive pathotype (O8:H1), human patient<br />
suffering with Crohn's disease, not diarrhea associated
82<br />
Escherichia coli M605<br />
Escherichia coli M718<br />
PRJNA52483,<br />
PRJNA39039 - 5,45 5.750 isolated from mammal (Nyctophilus geoffroyi- bat)<br />
PRJNA52481,<br />
isolated from mammal (Sarcophilus harrisii - Tasmanian<br />
PRJNA39043 - 5,37 5.514<br />
<strong>de</strong>vil)<br />
Escherichia coli M863 PRJNA39045 - 5,25 5.057<br />
Escherichia coli M919 PRJNA39047 - 5,25 5.136<br />
PRJNA50575,<br />
Escherichia coli MS 107-1 PRJNA40713 - 4,91 5.294<br />
Escherichia coli MS 110-3 PRJNA47225 - 5,06 5.536<br />
Escherichia coli MS 115-1<br />
PRJNA50627,<br />
PRJNA47227 - 4,8 5.133<br />
Escherichia coli MS 116-1<br />
PRJNA50635,<br />
PRJNA47229 - 4,84 5.276<br />
Escherichia coli MS 117-3 PRJNA47231 - 5,01 5.491<br />
Escherichia coli MS 119-7<br />
PRJNA50577,<br />
PRJNA40709 - 4,97 5.477<br />
Escherichia coli MS 124-1<br />
PRJNA50763,<br />
PRJNA40707 - 5,39 6.114<br />
Escherichia coli MS 145-7<br />
PRJNA59467,<br />
PRJNA40703 - 5,12 5.642<br />
Escherichia coli MS 146-1<br />
PRJNA50897,<br />
PRJNA47241 - 4,74 5.071<br />
Escherichia coli MS 153-1 PRJNA47257 - 5,09 5.578<br />
Escherichia coli MS 16-3 PRJNA47259 - 4,95 5.394<br />
Escherichia coli MS 175-1<br />
PRJNA50639,<br />
PRJNA47263 - 4,67 4.984<br />
Escherichia coli MS 182-1<br />
PRJNA50641,<br />
PRJNA47265 - 4,98 5.433<br />
Escherichia coli MS 185-1<br />
PRJNA50657,<br />
PRJNA47267 - 4,94 5.296<br />
Escherichia coli MS 187-1<br />
PRJNA50629,<br />
PRJNA47269 - 4,38 4.605<br />
Escherichia coli MS 196-1<br />
PRJNA50655,<br />
PRJNA47271 - 5,21 5.713<br />
Escherichia coli MS 198-1<br />
PRJNA50625,<br />
PRJNA47273 - 5,24 5.724<br />
Escherichia coli MS 200-1<br />
PRJNA50645,<br />
PRJNA47275 - 5,04 5.445<br />
Escherichia coli MS 21-1<br />
PRJNA50631,<br />
PRJNA47205 - 5,28 5.860<br />
Escherichia coli MS 45-1<br />
PRJNA50643,<br />
PRJNA47207 - 4,99 5.346<br />
Escherichia coli MS 57-2 PRJNA47209 - 4,94 5.334<br />
Escherichia coli MS 60-1 PRJNA47211 - 5,2 5.759<br />
Escherichia coli MS 69-1<br />
PRJNA50653,<br />
PRJNA47213 - 5,21 5.592<br />
Escherichia coli MS 78-1<br />
PRJNA50771,<br />
PRJNA47217 - 4,75 5.104<br />
Escherichia coli MS 79-10 PRJNA40701 - 4,9 5.397<br />
PRJNA50623,<br />
Escherichia coli MS 84-1 PRJNA47219 - 5,29 5.828<br />
Escherichia coli MS 85-1 PRJNA40699 - 5,46 6.149<br />
PRJNA52343,<br />
Escherichia coli NC101 PRJNA47121 - 5,02 4.805<br />
Escherichia coli NCCP15647 PRJNA157365 - 5,15 -<br />
Escherichia coli NCCP15657 PRJNA157429 - 5,02 -<br />
Escherichia coli NCCP15658 PRJNA157427 - 5,46 -<br />
Escherichia coli O103:H2 str.<br />
CVM9450 PRJNA129421 - 5,39 5.477<br />
Escherichia coli O103:H25 str.<br />
CVM9340 PRJNA129419 - 5,26 5.340<br />
Escherichia coli O103:H25 str.<br />
NIPH-11060424 PRJNA74417 - 5,16 -<br />
Escherichia coli O104:H4 str.<br />
01-09591 PRJNA67931 - 5,49 5.630<br />
Escherichia coli O104:H4 str.<br />
04-8351 PRJNA68211 - 5,39 5.241<br />
Escherichia coli O104:H4 str.<br />
09-7901 PRJNA68213 - 5,29 5.138<br />
Escherichia coli O104:H4 str.<br />
11-3677 PRJNA68215 - 5,4 5.229<br />
Escherichia coli O104:H4 str.<br />
11-4404 PRJNA70733 - 5,39 5.245<br />
Escherichia coli O104:H4 str.<br />
11-4522 PRJNA70735 - 5,38 5.214<br />
Escherichia coli O104:H4 str.<br />
11-4623 PRJNA70737 - 5,4 5.245<br />
isolated from mammal (Sarcophilus harrisii - Tasmanian<br />
<strong>de</strong>vil)
83<br />
Escherichia coli O104:H4 str.<br />
11-4632 C1 PRJNA70739 - 5,38 5.226<br />
Escherichia coli O104:H4 str.<br />
11-4632 C2 PRJNA70741 - 5,39 5.225<br />
Escherichia coli O104:H4 str.<br />
11-4632 C3 PRJNA70743 - 5,37 5.201<br />
Escherichia coli O104:H4 str.<br />
11-4632 C4 PRJNA70745 - 5,39 5.234<br />
Escherichia coli O104:H4 str.<br />
11-4632 C5 PRJNA70747 - 5,39 5.246<br />
Escherichia coli O104:H4 str.<br />
C227-11 PRJNA68153 - 5,39 5.225<br />
Escherichia coli O104:H4 str.<br />
C227-11 PRJNA68253 - 5,54 5.536<br />
Escherichia coli O104:H4 str.<br />
C236-11 PRJNA68155 - 5,4 5.231<br />
Escherichia coli O104:H4 str.<br />
Ec11-5536 PRJNA70753 - - -<br />
Escherichia coli O104:H4 str.<br />
Ec11-5537 PRJNA70751 - - -<br />
Escherichia coli O104:H4 str.<br />
Ec11-5538 PRJNA70749 - - -<br />
Escherichia coli O104:H4 str.<br />
GOS1 PRJNA71263 - 5,31 -<br />
Escherichia coli O104:H4 str.<br />
GOS2 PRJNA71339 - 5,31 -<br />
Escherichia coli O104:H4 str.<br />
H112180280 PRJNA67929 - 5,38 -<br />
Escherichia coli O104:H4 str.<br />
H112180282 PRJNA68661 - 5,37 -<br />
Escherichia coli O104:H4 str.<br />
H112180283 PRJNA70805 - 5,34 -<br />
Escherichia coli O104:H4 str.<br />
H112180540 PRJNA70809 - 5,28 -<br />
Escherichia coli O104:H4 str.<br />
H112180541 PRJNA68163 - 5,05 -<br />
Escherichia coli O104:H4 str.<br />
LB226692 PRJNA67613 - 5,46 5.585<br />
Escherichia coli O104:H4 str.<br />
ON2010 PRJNA81621 - 5,1 -<br />
Escherichia coli O104:H4 str.<br />
ON2011 PRJNA81623 - 5,23 -<br />
Escherichia coli O104:H4 str.<br />
TY-2482 PRJNA67657 - 5,29 -<br />
Escherichia coli O111 str.<br />
CVM9455 PRJNA129407 - 6 6.546<br />
Escherichia coli O111:H11 str.<br />
CVM9534 PRJNA129415 - 5,46 5.738<br />
Escherichia coli O111:H11 str.<br />
CVM9545 PRJNA89667 - 5,61 6.164<br />
Escherichia coli O111:H11 str.<br />
CVM9553 PRJNA129417 - 5,59 5.987<br />
Escherichia coli O111:H8 str.<br />
CVM9570 PRJNA129413 - 5,51 5.884<br />
Escherichia coli O111:H8 str.<br />
CVM9574 PRJNA129397 - 5,36 5.633<br />
Escherichia coli O111:H8 str.<br />
CVM9602 PRJNA129393 - 5,1 5.176<br />
Escherichia coli O111:H8 str.<br />
CVM9634 PRJNA129401 - 5,77 6.081<br />
Escherichia coli O113:H21 str.<br />
CL-3 PRJNA72243 - 5,05 -<br />
Escherichia coli O121:H19 str.<br />
MT#2 PRJNA72249 - 5,26 -<br />
Escherichia coli O145:H28 str.<br />
4865/96 PRJNA72253 - 5,23 -<br />
Escherichia coli O157:H- str.<br />
493-89 PRJNA60059 - 5,05 4.946 p<br />
Escherichia coli O157:H- str.<br />
493-89 PRJNA72247 - 5,36 -<br />
Escherichia coli O157:H- str.<br />
H 2687 PRJNA60061 - 5,05 4.938<br />
Escherichia coli O157:H43 str.<br />
T22 PRJNA81821 - 4,33 4.670<br />
Escherichia coli O157:H7 str.<br />
1044 PRJEA61463 - 5,49 5.580<br />
Escherichia coli O157:H7 str.<br />
1125 PRJNA61473 - 5,57 5.683<br />
Escherichia coli O157:H7 str.<br />
EC1212 PRJEA61465 - 5,51 5.593<br />
ehec (isolated from German infant human, from HUS<br />
outbreak 1989)
84<br />
Escherichia coli O157:H7 str.<br />
EC4009 PRJNA42809 - 5,19 -<br />
Escherichia coli O157:H7 str.<br />
EC4024<br />
PRJNA54969,<br />
PRJNA27747 - 6,2 6.540<br />
Escherichia coli O157:H7 str.<br />
EC4042<br />
PRJNA54961,<br />
PRJNA27737 - 5,62 5.976<br />
Escherichia coli O157:H7 str.<br />
EC4045<br />
PRJNA54957,<br />
PRJNA27733 - 5,63 5.930<br />
Escherichia coli O157:H7 str.<br />
EC4076<br />
PRJNA54967,<br />
PRJNA27745 - 5,71 6.071<br />
Escherichia coli O157:H7 str.<br />
EC4084 PRJNA42813 - 5,3 -<br />
Escherichia coli O157:H7 str.<br />
EC4113<br />
PRJNA54965,<br />
PRJNA27743 - 5,66 5.826<br />
Escherichia coli O157:H7 str.<br />
EC4127 PRJNA42815 - 5,3 -<br />
Escherichia coli O157:H7 str.<br />
EC4191 PRJNA42817 - 5,2 -<br />
Escherichia coli O157:H7 str.<br />
EC4192 PRJNA42811 - 5,35 -<br />
Escherichia coli O157:H7 str.<br />
EC4196<br />
PRJNA54963,<br />
PRJNA27741 - 5,62 5.891<br />
Escherichia coli O157:H7 str.<br />
EC4205 PRJNA42819 - 5,29 -<br />
Escherichia coli O157:H7 str.<br />
EC4206<br />
PRJNA54959,<br />
PRJNA27735 - 5,63 6.062<br />
Escherichia coli O157:H7 str.<br />
EC4401<br />
PRJNA54971,<br />
PRJNA27749 - 5,73 6.001<br />
Escherichia coli O157:H7 str.<br />
EC4486<br />
PRJNA54973,<br />
PRJNA27751 - 5,93 6.189<br />
Escherichia coli O157:H7 str.<br />
EC4501<br />
PRJNA54975,<br />
PRJNA27753 - 5,68 5.947<br />
Escherichia coli O157:H7 str.<br />
EC508<br />
PRJNA54977,<br />
PRJNA27755 - 5,66 5.853<br />
Escherichia coli O157:H7 str.<br />
EC536 PRJNA42821 - 5,26 -<br />
Escherichia coli O157:H7 str.<br />
EC869<br />
PRJNA54979,<br />
PRJNA27757 - 5,73 5.926<br />
Escherichia coli O157:H7 str.<br />
FRIK2000<br />
PRJNA55943,<br />
PRJNA36543 - 5,41 5.383<br />
Escherichia coli O157:H7 str.<br />
FRIK966<br />
PRJNA55561,<br />
PRJNA32275 - 5,38 5.393<br />
Escherichia coli O157:H7 str.<br />
G5101 PRJNA60057 - 5,06 4.988<br />
Escherichia coli O157:H7 str.<br />
LSU-61 PRJNA60067 - 5,05 4.939<br />
Escherichia coli O25b:H4-<br />
ST131 str. EC958 PRJEA61443 - 5,16 -<br />
Escherichia coli O26:H11 str.<br />
CVM10021 PRJNA129425 - 5,49 5.752<br />
Escherichia coli O26:H11 str.<br />
CVM10026 PRJNA129427 - 5,57 5.869<br />
Escherichia coli O26:H11 str.<br />
CVM10030 PRJNA129429 - 5,49 5.743<br />
Escherichia coli O26:H11 str.<br />
CVM10224 PRJNA129431 - 5,34 5.581<br />
Escherichia coli O26:H11 str.<br />
CVM9942 PRJNA129423 - 5,62 5.991<br />
Escherichia coli O26:H11 str.<br />
CVM9952 PRJNA94343 - 5,5 5.701<br />
Escherichia coli O32:H37 str.<br />
P4 PRJNA91125 - 4,87 4.693<br />
Escherichia coli O45:H2 str.<br />
03-EN-705 PRJNA72251 - 5,3 -<br />
Escherichia coli O55:H7 str.<br />
3256-97 PRJNA60063 - 5,08 4.995<br />
Escherichia coli O55:H7 str.<br />
USDA 5905 PRJNA60065 - 5,11 4.980<br />
Escherichia coli O91:H21 str.<br />
B2F1 PRJNA72245 - 5,01 -<br />
Escherichia coli OK1180 PRJNA40289 - 5,55 5.910<br />
Escherichia coli OK1357 PRJNA40291 - 5,28 5.341<br />
PRJNA49051,<br />
Escherichia coli OP50 PRJNA41499 - 4,42 6.145<br />
Escherichia coli PA10 PRJNA65853 - 5,57 6.081<br />
Escherichia coli PA14 PRJNA65855 - 5,47 5.976<br />
Escherichia coli PA15 PRJNA65857 - 5,44 5.884<br />
Escherichia coli PA22 PRJNA65859 - 5,49 5.752<br />
Escherichia coli PA24 PRJNA65863 - 5,32 5.684
85<br />
Escherichia coli PA25 PRJNA65867 - 5,37 5.769<br />
Escherichia coli PA28 PRJNA65869 - 5,4 5.804<br />
Escherichia coli PA3 PRJNA65841 - 5,37 5.805<br />
Escherichia coli PA31 PRJNA65873 - 5,37 5.735<br />
Escherichia coli PA32 PRJNA65875 - 5,37 5.810<br />
Escherichia coli PA33 PRJNA65877 - 5,35 5.752<br />
Escherichia coli PA39 PRJNA65883 - 5,36 5.827<br />
Escherichia coli PA40 PRJNA65885 - 5,53 5.753<br />
Escherichia coli PA41 PRJNA65887 - 5,48 5.949<br />
Escherichia coli PA42 PRJNA65889 - 5,39 5.806<br />
Escherichia coli PA5 PRJNA65845 - 5,35 5.708<br />
Escherichia coli PA9 PRJNA65851 - 5,42 5.797<br />
Escherichia coli PCN033 PRJNA64999 - 5,06 4.966<br />
Escherichia coli RN587/1 PRJNA40279 - 5,06 5.108<br />
Escherichia coli SCI-07 PRJNA82801 - 4,97 4.758<br />
Escherichia coli STEC_7v PRJNA48269 - 5,2 5.220<br />
Escherichia coli STEC_94C PRJNA48271 - 5,03 5.244<br />
Escherichia coli STEC_B2F1 PRJNA48273 - 4,99 5.006<br />
Escherichia coli STEC_C165-<br />
02 PRJNA48275 - 5,01 5.019<br />
Escherichia coli<br />
STEC_DG131-3 PRJNA48277 - 5,3 5.609<br />
Escherichia coli STEC_EH250 PRJNA48279 - 5,21 5.353<br />
Escherichia coli STEC_H.1.8 PRJNA48281 - 5,39 5.815<br />
Escherichia coli<br />
STEC_MHI813 PRJNA48285 - 5,23 5.185<br />
Escherichia coli STEC_O31 PRJNA48267 - 5,2 5.250<br />
Escherichia coli STEC_S1191 PRJNA48287 - 5,15 5.260<br />
Escherichia coli TA007 PRJNA39063 - 5,25 5.217<br />
Escherichia coli TA124 PRJNA39075 - 4,92 4.714<br />
Escherichia coli TA143<br />
Escherichia coli TA206<br />
Escherichia coli TA271<br />
Escherichia coli TA280<br />
PRJNA52477,<br />
PRJNA39079 - 4,83 4.856<br />
PRJNA52479,<br />
PRJNA39085 - 5,06 5.177<br />
PRJNA52521,<br />
PRJNA39091 - 5,02 5.197<br />
PRJNA52523,<br />
PRJNA39093 - 5,26 5.477<br />
Escherichia coli TW06591 PRJNA65899 - 5,48 5.650<br />
Escherichia coli TW07793 PRJNA51133 - 4,64 4.595<br />
Escherichia coli TW07945 PRJNA65901 - 5,36 5.701<br />
Escherichia coli TW09098 PRJNA65907 - 5,49 5.911<br />
Escherichia coli TW09109 PRJNA65909 - 5,58 5.881<br />
Escherichia coli TW09195 PRJNA65911 - 5,47 6.084<br />
Escherichia coli TW10119 PRJNA65913 - 5,55 5.873<br />
Escherichia coli TW10246 PRJNA65903 - 5,45 5.681<br />
Escherichia coli TW10509 PRJNA39103 - 5,35 5.149<br />
Escherichia coli TW10598 PRJNA59743 - 5,24 -<br />
Escherichia coli TW10722 PRJNA59745 - 5,69 -<br />
Escherichia coli TW10828 PRJNA59747 - 5,28 -<br />
Escherichia coli TW11039 PRJNA65905 - 5,6 5.955<br />
Escherichia coli TW11681 PRJNA59749 - 5,31 -<br />
Escherichia coli TW14301 PRJNA65921 - 5,3 5.649<br />
Escherichia coli TW14313 PRJNA65919 - 5,33 5.722<br />
Escherichia coli TW14425 PRJNA59751 - 5,21 -<br />
Escherichia coli TX1999 PRJNA40287 - 5,25 5.465<br />
PRJNA52603,<br />
Escherichia coli W<br />
PRJNA42709 - 4,94 4.772<br />
Escherichia coli W26 PRJNA88641 - 5,12 4.920<br />
Escherichia coli WV_060327 PRJNA61477 - 4,68 4.618<br />
Escherichia coli XH001 PRJNA70787 1 4,84 4.716<br />
Escherichia coli XH140A PRJNA70725 1 4,41 4.246<br />
Escherichia coli cloneA_i1 PRJNA63489 - 4,76 4.727<br />
isolated from mammal (Dasyurus geoffroii - western<br />
quoll/chudchit, marsupial)<br />
isolated from mammal (Antechinus bellus - fawn<br />
antechinus, a small carnivorous marsupial)<br />
isolated from mammal (Perameles nasuta - long-nosed<br />
bandicoot, marsupial)<br />
isolated from mammal (Dasyurus viverrinus - eastern<br />
quoll/eastern native cat, marsupial)<br />
isolated from mammal (Dasyurus viverrinus - eastern<br />
quoll/eastern native cat, marsupial)
86<br />
Supplementary Table S4. Chromosome size (Kb’s) of the Mexican E.coli<br />
phylogenetic groups <strong>de</strong>fined by the Clermont assignation method<br />
95% Confi<strong>de</strong>nce<br />
Clermont group<br />
Standard Standard Interval<br />
N Mean<br />
assignation<br />
<strong>de</strong>viation error Lower Upper<br />
Minimum Maximum<br />
limit limit<br />
A 47 4.822,602 241,3156 35,1995 4.751,749 4.893,455 4.247,3 5.391,8<br />
B1 41 5.068,654 393,0560 61,3850 4.944,590 5.192,717 4.438,1 5.907,5<br />
B2 16 4.677,038 363,7672 90,9418 4.483,200 4.870,875 4.007,0 5.427,0<br />
D 22 5.033,732 525,2087 111,9749 4.800,867 5.266,596 4.158,0 6.097,1<br />
Total 126 4.921,046 392,0905 34,9302 4.851,915 4.990,177 4.007,0 6.097,1
87<br />
Supplementary Table S5. Chromosome size of sequenced Escherichia coli strains<br />
isolated from animals<br />
Organism BioProject Plasmids Size (Mb) Gene Host<br />
Escherichia coli<br />
1.2741 PRJNA51085 - 5,69 5.914 Cow (O2:H4)<br />
Escherichia coli<br />
2.3916 PRJNA51123 - 5,64 6.179 Pig<br />
Escherichia coli<br />
2.4168 PRJNA51127 - 4,74 4.804 Water<br />
Escherichia coli<br />
3.2303 PRJNA51129 - 4,95 5.149 Water<br />
Escherichia coli<br />
3.2608 PRJNA51105 - 5,45 5.670 Horse<br />
Escherichia coli<br />
3.3884 PRJNA51125 - 5,23 5.311 Cow<br />
Escherichia coli<br />
3003 PRJNA51131 - 4,92 4.982 Water<br />
Escherichia coli<br />
4.0522 PRJNA51109 - 5,83 6.308 Cow<br />
Escherichia coli<br />
4.0967 PRJNA51121 - 5,87 6.266 Rabbit<br />
Escherichia coli<br />
5.0588 PRJNA51089 - 5 5.137 Cow<br />
Escherichia coli<br />
AA86 PRJNA65321 1 4,98 4.819 Healthy cow feces<br />
Escherichia coli<br />
AI27 PRJNA89369 - 4,9 4.750 Porcine feces in South Korea<br />
Escherichia coli<br />
B088<br />
PRJNA47003,<br />
PRJNA38905 - 4,94 4.671 Bird (Circus assimilis)<br />
Escherichia coli<br />
B093 PRJNA38907 - 5,19 4.990 Bird (Strepera graculina)<br />
Escherichia coli<br />
B185<br />
Escherichia coli<br />
B354<br />
PRJNA47001,<br />
PRJNA38915 - 5,11 4.797 Bird (Turdus merula)<br />
PRJNA46999,<br />
PRJNA38917 - 4,83 4.724 Bird (Monarca trivirgatus)<br />
Escherichia coli<br />
B799 PRJNA38929 - 5,3 5.203 Bird (Sericornis frontalis)<br />
Escherichia coli<br />
E101 PRJNA38935 - 5,18 5.015<br />
Escherichia coli<br />
M605<br />
Escherichia coli<br />
M718<br />
PRJNA52483,<br />
PRJNA39039 - 5,45 5.750<br />
PRJNA52481,<br />
PRJNA39043 - 5,37 5.514<br />
Escherichia coli<br />
M919 PRJNA39047 - 5,25 5.136<br />
Escherichia coli<br />
TA124 PRJNA39075 - 4,92 4.714<br />
Escherichia coli<br />
TA143<br />
PRJNA52477,<br />
PRJNA39079 - 4,83 4.856<br />
Environment (Lake Ginn<strong>de</strong>rra,<br />
ACT, Australia)<br />
Mammal (Nyctophilus geoffroyibat)<br />
Mammal (Sarcophilus harrisii -<br />
Tasmanian <strong>de</strong>vil)<br />
Mammal (Sarcophilus harrisii -<br />
Tasmanian <strong>de</strong>vil)<br />
Mammal (Dasyurus geoffroii -<br />
western quoll/chudchit,<br />
marsupial)<br />
Mammal (Antechinus bellus -<br />
fawn antechinus, a small<br />
carnivorous marsupial)
88<br />
Escherichia coli<br />
TA206<br />
Escherichia coli<br />
TA271<br />
Escherichia coli<br />
TA280<br />
PRJNA52479,<br />
PRJNA39085 - 5,06 5.177<br />
PRJNA52521,<br />
PRJNA39091 - 5,02 5.197<br />
PRJNA52523,<br />
PRJNA39093 - 5,26 5.477<br />
Mammal (Perameles nasuta -<br />
long-nosed bandicoot, marsupial)<br />
Mammal (Dasyurus viverrinus -<br />
eastern quoll/eastern native cat,<br />
marsupial)<br />
Mammal (Dasyurus viverrinus -<br />
eastern quoll/eastern native cat,<br />
marsupial)
89<br />
6. Artículo 3<br />
“Dinámica evolutiva <strong>de</strong>l pangenoma <strong>de</strong> Escherichia coli y adaptación a diferentes<br />
nichos ecológicos”<br />
6.1. Resumen<br />
El pangenoma <strong>de</strong> una especie bacteriana consiste en el genoma “central” (genes<br />
compartidos por todos los aislados) y el genoma flexible (genes compartidos por subpoblaciones<br />
y genes específicos a <strong>de</strong>terminadas cepas). Este último se encuentra en su<br />
<strong>mayo</strong>ría compuesto por genes adquiridos horizontalmente, los cuales codifican nuevas<br />
funciones metabólicas. Debido a lo anterior, se asume que el genoma flexible es el que<br />
permite a las bacterias adaptarse a nuevos nichos, ignorando así el papel <strong>de</strong>l genoma<br />
central en el origen y evolución <strong>de</strong> adaptaciones tales como la patogénesis y el<br />
comensalismo. Para examinar este supuesto, llevamos a cabo un estudio <strong>de</strong> genómica <strong>de</strong><br />
poblaciones en Escherichia coli, bacteria con diferentes estilos <strong>de</strong> vida. Al comparar la<br />
dinámica evolutiva tanto <strong>de</strong>l genoma central como <strong>de</strong>l flexible <strong>de</strong> los dos “eco-grupos”<br />
en las cuales se dividió la muestra, encontramos que las cepas patógenas presentan<br />
<strong>mayo</strong>r diversidad genética que las cepas no patógenas, no solamente a nivel <strong>de</strong>l genoma<br />
flexible sino también a nivel <strong>de</strong>l genoma central. Asimismo, encontramos pocos loci en<br />
<strong>de</strong>sequilibrio <strong>de</strong> ligamiento lo que sugiere a E. coli como especie sexual. Con respecto a<br />
los patrones <strong>de</strong> la selección natural, las cepas patógenas mostraron señales <strong>de</strong> selección<br />
positiva en genes con diversas funciones (genes <strong>de</strong> transporte/unión, metabolismo<br />
energético y transcripción), al contrario <strong>de</strong> las cepas no patógenas en las cuales,<br />
predominó la selección negativa. Finalmente, encontramos que los niveles <strong>de</strong> diversidad<br />
genética, clonalidad y selección son heterogéneos a lo largo <strong>de</strong>l cromosoma. Solamente<br />
pocas regiones <strong>de</strong>l cromosoma mostraron patrones similares en ambos ecogrupos. Así,<br />
concluimos que la adaptación <strong>de</strong> E. coli a diferentes nichos ocurre no solamente por la<br />
adquisición horizontal <strong>de</strong> genes sino también por la evolución <strong>de</strong>l genoma central.
90<br />
Dinámica evolutiva <strong>de</strong>l pangenoma <strong>de</strong> Escherichia coli y adaptación a<br />
diferentes nichos ecológicos<br />
Sánchez-Reyes, L 1,a ., González-González, A 1 ., Eguiarte, L 1 ., Souza, V 1<br />
1 Departamento <strong>de</strong> <strong>Ecología</strong> Evolutiva, <strong>Instituto</strong> <strong>de</strong> <strong>Ecología</strong>, Universidad Nacional<br />
Autónoma <strong>de</strong> México, Apartado Postal 70-275, México, D.F. 04510, México<br />
a Dirección actual: Departamento <strong>de</strong> Botánica, <strong>Instituto</strong> <strong>de</strong> Biología, Universidad<br />
Nacional Autónoma <strong>de</strong> México, D.F., México.<br />
Running title: Population genomics of E. coli<br />
Status: en preparación para ser enviado a la revista BMC Genomics.
91<br />
1<br />
2<br />
3<br />
4<br />
5<br />
6<br />
7<br />
8<br />
9<br />
10<br />
11<br />
12<br />
13<br />
14<br />
15<br />
16<br />
17<br />
18<br />
19<br />
20<br />
21<br />
22<br />
23<br />
24<br />
25<br />
26<br />
27<br />
28<br />
29<br />
30<br />
31<br />
Abstract<br />
The pan-genome of a bacterial species consists of a core genome (genes shared by all<br />
isolates) and a flexible genome (genes shared by subpopulations and strain-specific genes).<br />
Given that flexible genome is mainly composed by horizontally acquired genes encoding<br />
new metabolic functions, the i<strong>de</strong>a that the flexible genome is what allows bacterial<br />
adaptation to new niches is pervasive, thus ignoring the role of the core genome in the<br />
origin and evolution of adaptations, such as pathogenesis and commensalism. To evaluate<br />
this assumption, we conducted a population genomics study in Escherichia coli, a bacterial<br />
species with different lifestyles. When comparing the evolutionary dynamics of the core<br />
and flexible genome between the two "eco-groups" in which the sample was divi<strong>de</strong>d, we<br />
found that pathogenic strains (isolated from poultry and from extra-intestinal and intestinal<br />
samples in humans) had more genetic diversity than non-pathogenic strains (free-living and<br />
commensal in humans), not only within the flexible genome, but also within the central<br />
genome. Moreover, few loci were found in linkage disequilibrium, indicating that E. coli is<br />
a sexual species. Concerning the patterns of natural selection, the pathogenic strains<br />
showed signs of positive selection in genes with diverse functions (genes of<br />
transport/binding, energy metabolism and transcription), unlike non-pathogenic strains, in<br />
which negative selection predominated. Finally, an analysis of diversity among the syntenic<br />
blocks (LCBs) of the core genome revealed that the patterns of genetic diversity, clonality<br />
and selection were heterogeneous along the chromosome. Only a few LCB's showed<br />
similar patterns in both eco-groups. We conclu<strong>de</strong> that adaptation of E. coli to different<br />
niches occurs not only by the horizontal acquisition of genes, but also by the evolution of<br />
the core genome and its regulation.
92<br />
32<br />
33<br />
34<br />
35<br />
36<br />
37<br />
38<br />
39<br />
40<br />
41<br />
42<br />
43<br />
44<br />
45<br />
46<br />
47<br />
48<br />
49<br />
50<br />
51<br />
52<br />
53<br />
54<br />
55<br />
56<br />
57<br />
58<br />
59<br />
60<br />
61<br />
62<br />
1. Introducción<br />
La comparación <strong>de</strong> genomas entre diferentes especies y <strong>de</strong>ntro <strong>de</strong> individuos <strong>de</strong> la misma<br />
especie, ha permitido la i<strong>de</strong>ntificación <strong>de</strong> mecanismos genéticos tales como la duplicación,<br />
pérdida y ganancia <strong>de</strong> genes así como <strong>de</strong> re-arreglos cromosómicos los cuales en su<br />
conjunto promueven la variabilidad tanto en el contenido y estructura <strong>de</strong> los genomas (Mira<br />
et al. 2002). Es así que para <strong>de</strong>scribir el total <strong>de</strong> la información genética <strong>de</strong> una especie se<br />
utiliza el concepto <strong>de</strong> pangenoma el cual se encuentra conformado principalmente por un<br />
conjunto <strong>de</strong> genes compartidos por todas las cepas a la que se le llama genoma central y por<br />
un conjunto <strong>de</strong> genes o regiones genómicas presentes solamente en ciertos aislados al que<br />
se le llama genoma flexible (Tettelin et al. 2005).<br />
Generalmente se asume que el genoma central es aquel que codifica para las<br />
funciones metabólicas básicas comunes al nicho ecológico y que el genoma flexible<br />
producto <strong>de</strong> transferencia horizontal <strong>de</strong> genes principalmente, codifica las funciones<br />
especializadas las cuales en <strong>de</strong>terminados casos aumentan la a<strong>de</strong>cuación en ambientes<br />
particulares constituyendo así un mecanismo <strong>de</strong> adaptación bacteriana (Dobrindt et al.<br />
2004). Es así que la i<strong>de</strong>a <strong>de</strong> que la plasticidad ecológica y la adaptación en las bacterias se<br />
<strong>de</strong>ben al efecto <strong>de</strong> la transferencia horizontal <strong>de</strong> genes ha tomado especial fuerza, sobre<br />
todo para explicar la existencia <strong>de</strong> bacterias que son generalmente comensales <strong>de</strong>l humano,<br />
pero que también pue<strong>de</strong>n llegar a ser patógenas al adquirir genes <strong>de</strong> virulencia, como es el<br />
caso <strong>de</strong> Escherichia coli (Nataro y Kaper 1998).<br />
Asimismo, la comparación <strong>de</strong> genomas <strong>de</strong> diferentes patotipos ha confirmado que<br />
cepas comensales comparten gran parte <strong>de</strong> los factores <strong>de</strong> virulencia (Rasko et al. 2008) lo<br />
que sugiere que los elementos que antes se consi<strong>de</strong>raban como diagnósticos <strong>de</strong> la<br />
patogénesis en realidad no son estrictamente patogénicos y que pudieran ser utilizados por<br />
cepas comensales para procesos <strong>de</strong> colonización y a<strong>de</strong>cuación. Entonces la adquisición <strong>de</strong><br />
ciertos factores <strong>de</strong> virulencia no implican forzosamente la transformación inmediata <strong>de</strong> una<br />
cepa a-virulenta en patógena. Lo que quiere <strong>de</strong>cir que <strong>de</strong>ben <strong>de</strong> existir otros factores<br />
implicados en la evolución <strong>de</strong> la patogénesis bacteriana (Johnson y Russo 2002).<br />
Entonces ¿las diferencias ecológicas se podrán ver reflejadas en los elementos <strong>de</strong>l genoma<br />
que no están sujetos a transferencia horizontal
93<br />
63<br />
64<br />
65<br />
66<br />
67<br />
68<br />
69<br />
70<br />
71<br />
72<br />
73<br />
74<br />
75<br />
76<br />
77<br />
78<br />
79<br />
80<br />
81<br />
82<br />
83<br />
84<br />
85<br />
86<br />
87<br />
88<br />
89<br />
90<br />
91<br />
92<br />
93<br />
Para respon<strong>de</strong>r a esta pregunta, realizamos un estudio <strong>de</strong> genómica <strong>de</strong> poblaciones<br />
en don<strong>de</strong> analizamos la dinámica evolutiva <strong>de</strong> los diferentes componentes <strong>de</strong>l pangenoma<br />
arrojado por 12 genomas completos <strong>de</strong> Escherichia coli representativos <strong>de</strong> los diferentes<br />
estilos <strong>de</strong> vida: comensales, <strong>de</strong> vida libre, patógena extra-intestinal y patógena intestinal.<br />
Al comparar el genoma <strong>de</strong> diferentes aislados <strong>de</strong> una misma especie, la genómica <strong>de</strong><br />
poblaciones permite estudiar a fondo el papel que juegan tanto la selección natural como la<br />
<strong>de</strong>riva génica, mutación y recombinación en la estructuración <strong>de</strong> las poblaciones.<br />
Permitiendo así la i<strong>de</strong>ntificación y separación <strong>de</strong> los efectos que tienen en la divergencia <strong>de</strong><br />
las poblaciones bacterianas, los procesos históricos promovidos por la <strong>de</strong>riva génica, <strong>de</strong> los<br />
contemporáneos o ecológicos, mol<strong>de</strong>ados por la selección natural (Luikart et al., 2003).<br />
Gracias a lo cual, se vuelve factible el i<strong>de</strong>ntificar los patrones evolutivos que subyacen a la<br />
a<strong>de</strong>cuación y adaptación a nuevos nichos (Black et al, 2001; Luikart et al., 2003; Na<strong>de</strong>au y<br />
Jiggins, 2010).<br />
2. Material y Métodos<br />
2.1. Muestra<br />
En la Tabla 1 se enlistan los números <strong>de</strong> acceso <strong>de</strong> las 12 cepas <strong>de</strong> Escherichia coli que se<br />
utilizaron en este análisis. La muestra se encuentra conformada por aislados representativos<br />
<strong>de</strong> diferentes estilos <strong>de</strong> vida: comensales (4 cepas), <strong>de</strong> vida libre (1 cepa), patógena extraintestinal<br />
(4 cepas) y patógena intestinal (3 cepas) cuyos genomas se encuentran<br />
secuenciados con una cobertura ≥ 5x, el mínimo necesario para obtener un ensamblado<br />
correcto y una <strong>mayo</strong>r seguridad sobre la información <strong>de</strong> secuencia (Blattner et al. 1997;<br />
Rasko et al. 2008).<br />
2.3. Alineación<br />
Los cromosomas se alinearon con el algoritmo implementado en el programa MAUVE<br />
versión 2.1.1 para Linux (Darling et al. 2004). Este método <strong>de</strong> alineación múltiple utiliza
94<br />
94<br />
95<br />
96<br />
97<br />
98<br />
99<br />
100<br />
101<br />
102<br />
103<br />
104<br />
105<br />
106<br />
107<br />
108<br />
109<br />
110<br />
111<br />
112<br />
113<br />
114<br />
115<br />
116<br />
117<br />
118<br />
119<br />
120<br />
121<br />
122<br />
123<br />
124<br />
comparaciones locales y globales para i<strong>de</strong>ntificar regiones ortólogas conservadas y<br />
<strong>de</strong>limitar puntos <strong>de</strong> quiebre exactos <strong>de</strong> re-arreglos <strong>de</strong> secuencia a las que se les llama subalineación<br />
o bloques localmente colineares (LCBs; Locally Colinear Blocks). Gracias a lo<br />
cual, este método <strong>de</strong> alineación permite i<strong>de</strong>ntificar eventos <strong>de</strong> re-arreglo cromosómico,<br />
inversiones y translocaciones, al <strong>de</strong>tectar bloques <strong>de</strong> colinearidad local y su posición<br />
relativa en cada genoma (Darling et al. 2004). Para <strong>de</strong>tectar errores en el alineamiento, se<br />
realizó una revisión “a mano” <strong>de</strong> cada sub-alineación, con ayuda <strong>de</strong>l programa BIOEDIT<br />
(Hall 1999) versión 7.0.5.<br />
2.4. Delimitación <strong>de</strong> los componentes <strong>de</strong>l “pangenoma” en E. coli.<br />
La manera clásica <strong>de</strong> <strong>de</strong>scribir el pangenoma <strong>de</strong> una especie es a partir <strong>de</strong> la i<strong>de</strong>ntificación<br />
<strong>de</strong> proteínas ortólogas y la <strong>de</strong>terminación <strong>de</strong> regiones conservadas en todos los individuos<br />
(genoma central) ó presentes únicamente en algunos individuos (genoma flexible) <strong>de</strong> una<br />
muestra, mediante comparaciones recíprocas <strong>de</strong> tipo BLAST y sus variantes (Tettelin et al.<br />
2005; Nandi et al. 2010). A diferencia <strong>de</strong> estos estudios, en este trabajo se <strong>de</strong>scribió el<br />
pangenoma <strong>de</strong> E. coli a partir <strong>de</strong>l alineamiento y no a partir <strong>de</strong> unida<strong>de</strong>s funcionales, como<br />
son los genes. Para esto se siguió el método <strong>de</strong> Darling et al. (2004), quienes <strong>de</strong>finen al<br />
genoma central como aquella región <strong>de</strong>l alineamiento que presenta más <strong>de</strong> 50 columnas sin<br />
gaps, que no se encuentren intercaladas por regiones <strong>de</strong> 50 ó más gaps consecutivos en<br />
cualquiera <strong>de</strong> los genomas. Por exclusión, las regiones <strong>de</strong>l alineamiento que no cumplan<br />
con esto, forman parte <strong>de</strong>l genoma flexible. Sin embargo, hay discrepancia en cuanto a la<br />
longitud mínima que pue<strong>de</strong>n tener las regiones <strong>de</strong>l genoma central, y se ha propuesto que<br />
pudieran ser <strong>de</strong> tamaño menor a 50 nucleótidos (Darling et al. 2004; Di<strong>de</strong>lot et al. 2009).<br />
En el presente estudio, se consi<strong>de</strong>ró que una región era parte <strong>de</strong>l genoma central si<br />
el alineamiento presentaba al menos 10 columnas <strong>de</strong> nucleótidos sin gaps, que no se<br />
encontraran intercaladas por 10 ó más gaps en cualquiera <strong>de</strong> los individuos. Las regiones<br />
que no cumplieran con estas características se consi<strong>de</strong>raron como parte <strong>de</strong>l genoma<br />
flexible.<br />
2.5. Genómica <strong>de</strong> poblaciones
95<br />
125<br />
126<br />
127<br />
128<br />
129<br />
130<br />
131<br />
132<br />
133<br />
134<br />
135<br />
136<br />
137<br />
138<br />
139<br />
140<br />
141<br />
142<br />
143<br />
144<br />
145<br />
146<br />
147<br />
148<br />
149<br />
150<br />
151<br />
152<br />
153<br />
154<br />
Se estimó diversidad con el parámetro <strong>de</strong> diversidad nucleotídica π (pi) y el parámetro <strong>de</strong><br />
mutación poblacional θ (theta), se buscó evi<strong>de</strong>ncia <strong>de</strong> selección natural con 3 pruebas <strong>de</strong><br />
neutralidad diferentes (D <strong>de</strong> Tajima; Tajima, 1983; D* y F* <strong>de</strong> Fu-Li; Fu y Li, 1993) y se<br />
estimaron niveles <strong>de</strong> <strong>de</strong>sequilibrio <strong>de</strong> ligamiento con el estimador Zns (Kelly, 1997). Para<br />
no restringir el análisis a unida<strong>de</strong>s funcionales, como son los genes, se tomó como unidad<br />
<strong>de</strong> análisis una longitud <strong>de</strong> 1000 pares <strong>de</strong> bases, a lo que se consi<strong>de</strong>ró como loci <strong>de</strong> análisis.<br />
Todos los estimados <strong>de</strong> genética <strong>de</strong> poblaciones se calcularon con el programa VARISCAN<br />
versión 2.0.2 (Vilella et al. 2005).<br />
2.7. Análisis funcional y estadístico<br />
Para estudiar la evolución <strong>de</strong>l estilo <strong>de</strong> vida <strong>de</strong> E. coli, la muestra se clasificó <strong>de</strong> acuerdo a<br />
las características ecológicas <strong>de</strong> los individuos (Tabla 1). Bajo este criterio, dividimos la<br />
muestra en dos grupos funcionales, a los que llamamos eco-grupos. Uno fue integrado por<br />
las cepas <strong>de</strong> E. coli no-patógenas: las cepas <strong>de</strong> K12 MG1655, W3110, y ATCC8973, la<br />
cepa silvestre HS y la cepa <strong>de</strong> vida libre SMS3-5. Y el otro eco-grupo se integró por las<br />
cepas <strong>de</strong> E. coli patógenas: <strong>de</strong> ave APEC O1, intestinales EHEC (O157:H7) Sakai y<br />
EDL933 y ETEC E24377 y las extra-intestinales UPEC UTI89, 536 y CFT073.<br />
Los parámetros <strong>de</strong> genética <strong>de</strong> poblaciones que se <strong>de</strong>scribieron previamente, fueron<br />
estimados para el total <strong>de</strong> la muestra <strong>de</strong> E. coli y para cada eco-grupo por separado. Las<br />
comparaciones <strong>de</strong> parámetros estimados, entre componentes <strong>de</strong>l pangenoma y entre ecogrupos<br />
se realizaron con la prueba <strong>de</strong> Wilcoxon. Esta prueba permite comparaciones <strong>de</strong><br />
datos no-paramétricos entre dos grupos no in<strong>de</strong>pendientes por lo que se pue<strong>de</strong> utilizar para<br />
examinar diferentes regiones <strong>de</strong>l genoma <strong>de</strong>ntro <strong>de</strong> una misma población <strong>de</strong> acuerdo a<br />
Andolfatto (2005). Igualmente, se realizó una corrección <strong>de</strong> Bonferroni para comparaciones<br />
múltiples. Los análisis estadísticos se llevaron a cabo con el programa JMP 7.0.1 (<strong>Instituto</strong><br />
SAS, 1997).
96<br />
155<br />
156<br />
157<br />
158<br />
159<br />
160<br />
161<br />
162<br />
163<br />
164<br />
165<br />
166<br />
167<br />
168<br />
169<br />
170<br />
171<br />
172<br />
173<br />
174<br />
175<br />
176<br />
177<br />
178<br />
179<br />
180<br />
181<br />
182<br />
183<br />
184<br />
185<br />
Finalmente, se <strong>de</strong>terminaron las regiones funcionales presentes en cada uno <strong>de</strong> los<br />
loci bajo selección. En el caso <strong>de</strong> que se <strong>de</strong>tectaran genes, se les asignó una categoría<br />
funcional <strong>de</strong> acuerdo al sistema <strong>de</strong> clasificación <strong>de</strong>l JCVI (J. Craig Venter Institute),<br />
actualmente disponible en la página http://cmr.jcvi.org (Davidsen et al. 2010), usando como<br />
genoma <strong>de</strong> referencia las cepas <strong>de</strong> E. coli K12 MG1655 y UTI CFT073. Se calcularon las<br />
proporciones <strong>de</strong> genes presentes en cada categoría funcional, para <strong>de</strong>terminar si las<br />
diferencias adaptativas entre eco-grupos se acumulaban en algún tipo particular <strong>de</strong> genes.<br />
3. Resultados y Discusión<br />
3.1. Variación en la estructura cromosómica <strong>de</strong> E. coli<br />
El número <strong>de</strong> bloques <strong>de</strong> colinearidad local (LCBs por sus siglas en inglés: Locally<br />
Colinear Blocks) nos da un aproximado <strong>de</strong>l número <strong>de</strong> eventos <strong>de</strong> re-arreglo cromosómico<br />
que han ocurrido en una muestra <strong>de</strong> genomas. En nuestra muestra <strong>de</strong> E. coli encontramos<br />
evi<strong>de</strong>ncia <strong>de</strong> al menos 21 eventos <strong>de</strong> re-arreglo cromosómico, lo cual es ligeramente menor<br />
a lo que se ha reportado para muestras <strong>de</strong> E. coli y Shigella (34 LCBs en 6 cepas <strong>de</strong><br />
Shigella; Mau et al. 2006) (Figura 1; Tabla S1). Esta diferencia se pue<strong>de</strong> explicar por la<br />
presencia <strong>de</strong> un número elevado <strong>de</strong> secuencias <strong>de</strong> inserción en cepas <strong>de</strong> Shigella, cuya<br />
presencia favorece la ocurrencia <strong>de</strong> re-arreglos cromosómicos (Touchon et al. 2009).<br />
El número <strong>de</strong> re-arreglos que arroja la muestra <strong>de</strong> E. coli aquí estudiada sugiere que<br />
el cromosoma <strong>de</strong> E. coli es tan plástico como el <strong>de</strong>l patógeno oportunista Neisseria<br />
meningitidis (10 LCBs en 20 cepas; Budroni et al., 2011). Pero más recombinante en<br />
comparación con otras especies <strong>de</strong> bacterias con hábito patógeno estricto, como son<br />
Mycobacterium tuberculosis (ningún LCB en 6 cepas; Cubillos-Ruiz et al. 2008),<br />
Burkhol<strong>de</strong>ria pseudomallei (12 LCBs en 11 cepas; Nandi et al. 2010) y el género Brucella<br />
(10 LCBs en 10 cepas; Wattam et al. 2009). Aunque el número <strong>de</strong> LCBs <strong>de</strong>tectado en E.<br />
coli fue menor a lo que se ha <strong>de</strong>scrito en otras bacterias patógenas oportunistas como<br />
Legionella pneumophila (16 LCBs en 5 cepas; D’Auria et al. 2010), el género Yersinia (98
97<br />
186<br />
187<br />
188<br />
189<br />
190<br />
191<br />
192<br />
193<br />
194<br />
195<br />
196<br />
197<br />
198<br />
199<br />
200<br />
201<br />
202<br />
203<br />
204<br />
205<br />
206<br />
207<br />
208<br />
209<br />
210<br />
211<br />
212<br />
213<br />
214<br />
215<br />
216<br />
LCBs en 11 cepas; Chen et al. 2010), así como en la bacteria <strong>de</strong> vida libre Rhodobacter<br />
sphaeroi<strong>de</strong>s (382 LCBs en 3 cepas; Choudhary et al. 2007).<br />
Estas observaciones nos sugieren que la evolución por reorganización cromosómica no es<br />
una característica exclusiva <strong>de</strong> las bacterias patógenas (Rasko et al. 2008), como se había<br />
sugerido previamente (Hacker y Kaper 2000) y que inclusive pudieran ser más estables en<br />
cuanto a estructura cromosómica que las bacterias <strong>de</strong> vida libre, lo que se pue<strong>de</strong> explicar<br />
por presiones selectivas que mantienen ór<strong>de</strong>nes particulares <strong>de</strong> las regiones genómicas, y<br />
que eliminan aquellas cepas con re-arreglos que no son adaptativos (Mira et al., 2002).<br />
La ausencia <strong>de</strong> diferencias en la estructura cromosómica <strong>de</strong> bacterias patógenas <strong>de</strong><br />
E. coli como es el caso <strong>de</strong> los aislados enterohemorrágicos, y en particular el serotipo<br />
O157:H7 (Tabla 1) pue<strong>de</strong> ser explicado por la estructura epidémica <strong>de</strong> esta especie<br />
(Maynard-Smith et al. 1993), en don<strong>de</strong> <strong>de</strong>terminados linajes clonales se expan<strong>de</strong>n al<br />
interior <strong>de</strong> las poblaciones. A la larga, ésta situación aumenta la probabilidad <strong>de</strong> que el<br />
intercambio genético ocurra entre aislados idénticos generando así poca o nula variación en<br />
la estructura <strong>de</strong>l cromosoma.<br />
Al comparar el número <strong>de</strong> re-arreglos entre individuos <strong>de</strong> un mismo eco-grupo,<br />
observamos que resulta ser parecido en ambos eco-grupos (Tabla 2). Esto sugiere que la<br />
estructura <strong>de</strong>l cromosoma se conserva al interior <strong>de</strong> los eco-grupos y que la frecuencia <strong>de</strong><br />
los eventos <strong>de</strong> re-arreglos cromosómicos no se encuentra asociado al estilo <strong>de</strong> vida. Sin<br />
embargo, el número <strong>de</strong> re-arreglos es <strong>mayo</strong>r cuando se comparan cepas <strong>de</strong> diferente ecogrupo<br />
los cuales llegan a ser hasta 9 entre las cepas K12 8739ATCC y UTI89 (Tabla 2). La<br />
única excepción notable es el número <strong>de</strong> re-arreglos (sólo uno), encontrado entre la cepa<br />
ETEC E24377A patógena y la K12 MG1655 no-patógena. Este dato sugiere que ambas<br />
cepas son similares, como ya se ha propuesto en trabajos previos (Chen et al. 2006), por lo<br />
menos al nivel <strong>de</strong> la estructura cromosómica.<br />
En general, los re-arreglos encontrados en ambos grupos son <strong>de</strong> diferente<br />
naturaleza. Entre las cepas no-patógenas predominan las inversiones <strong>de</strong> regiones<br />
cromosómicas <strong>de</strong> tamaño gran<strong>de</strong> (hasta 1 Mb en la cepa SMS-3-5), las cuales fueron
98<br />
217<br />
218<br />
219<br />
220<br />
221<br />
222<br />
223<br />
224<br />
225<br />
226<br />
227<br />
228<br />
229<br />
230<br />
231<br />
232<br />
233<br />
234<br />
235<br />
236<br />
237<br />
238<br />
239<br />
240<br />
241<br />
242<br />
243<br />
244<br />
245<br />
246<br />
247<br />
<strong>de</strong>tectadas alre<strong>de</strong>dor <strong>de</strong>l origen y término <strong>de</strong> replicación, hecho que se consi<strong>de</strong>ra como<br />
señal <strong>de</strong> que hay una ten<strong>de</strong>ncia a conservar la simetría en la estructura <strong>de</strong>l cromosoma<br />
(Mira et al. 2002) en este grupo <strong>de</strong> cepas <strong>de</strong> E. coli, probablemente para conservar procesos<br />
celulares básicos como la replicación ( Touchon et al. 2009).<br />
Entre las cepas patógenas, los re-arreglos correspon<strong>de</strong>n a inversiones en regiones <strong>de</strong><br />
extensión mucho más pequeña, siendo la inversión más gran<strong>de</strong> la que se encuentra en la<br />
cepa O157:H7 EDL933 con un tamaño <strong>de</strong> 300 kb (Figura 1). Entonces la estructura <strong>de</strong>l<br />
cromosoma es cohesiva <strong>de</strong>ntro <strong>de</strong> los eco-grupos, pero diferente entre ellos. Es <strong>de</strong>cir que la<br />
naturaleza <strong>de</strong> los eventos <strong>de</strong> re-arreglo cromosómico es similar entre individuos con estilos<br />
<strong>de</strong> vida semejantes. Sin embargo, aparentemente la frecuencia con la que ocurren los<br />
eventos <strong>de</strong> re-arreglo es parecida en ambos eco-grupos. Es <strong>de</strong>cir que el estilo <strong>de</strong> vida no se<br />
correlaciona con una <strong>mayo</strong>r ó menor plasticidad estructural <strong>de</strong>l cromosoma en E. coli. Esto<br />
es contrario a lo que se ha propuesto en trabajos previos don<strong>de</strong> se compara la frecuencia <strong>de</strong><br />
re-arreglos entre diferentes especies (Mira et al. 2002). Dado que el presente estudio<br />
<strong>de</strong>scribe la estructura cromosómica <strong>de</strong>ntro <strong>de</strong> una misma especie, la cohesividad estructural<br />
refleja la cohesividad <strong>de</strong> la especie, como ha sido sugerido por Touchon et al. (2009).<br />
Finalmente, a pesar <strong>de</strong> la aparente homogeneidad en la estructura <strong>de</strong>l cromosoma<br />
entre individuos <strong>de</strong>l mismo eco-grupo, los re-arreglos observados entre aislados <strong>de</strong> una<br />
misma cepa, como se encontró en el presente estudio (entre las cepas K12 MG1655 y K12<br />
W3110 <strong>de</strong>l ecogrupo <strong>de</strong> E. coli no-patógena y entre las cepas O157:H7 EDL933 y<br />
O157:H7 Sakai <strong>de</strong>l ecogrupo patógeno (Tabla 2), así como en el trabajo <strong>de</strong> Ferenci et al.<br />
(2009), nos indica que el cromosoma <strong>de</strong> estas bacterias posee un alto potencial <strong>de</strong><br />
diversidad estructural.<br />
3.2. Variación en el repertorio genético <strong>de</strong>l cromosoma <strong>de</strong> E. coli<br />
El tamaño <strong>de</strong> la región correspondiente al genoma central <strong>de</strong> la muestra (3.6 Mb) es <strong>de</strong>l<br />
mismo or<strong>de</strong>n <strong>de</strong> magnitud con respecto a lo que se ha <strong>de</strong>scrito en trabajos previos en la<br />
especie E. coli (3.4 Mb en 6 genomas; Mau et al. 2006). Sin embargo en el presente trabajo
99<br />
248<br />
249<br />
250<br />
251<br />
252<br />
253<br />
254<br />
255<br />
256<br />
257<br />
258<br />
259<br />
260<br />
261<br />
262<br />
263<br />
264<br />
265<br />
266<br />
267<br />
268<br />
269<br />
270<br />
271<br />
272<br />
273<br />
274<br />
275<br />
276<br />
277<br />
278<br />
la región <strong>de</strong>l genoma central es ligeramente más extensa probablemente <strong>de</strong>bido a que no se<br />
incluyeron cepas <strong>de</strong> Shigella en este análisis. Esto se explica por el hecho <strong>de</strong> que mientras<br />
más divergentes sean dos individuos ó grupos <strong>de</strong> individuos, la proporción <strong>de</strong> genes que<br />
compartirán será menor (Mushegian y Koonin 1996). Dado que las cepas <strong>de</strong> Shigella<br />
constituyen un subgrupo parafilético <strong>de</strong> E. coli y altamente divergente <strong>de</strong>l resto <strong>de</strong> las cepas<br />
<strong>de</strong> esta especie (Pupo et al. 2000), se espera que la comparación <strong>de</strong> contenido genómico<br />
resulte en una menor cantidad <strong>de</strong> genes compartidos entre E. coli y Shigella que entre<br />
individuos <strong>de</strong> E. coli solamente.<br />
Por otro lado, encontramos que las regiones <strong>de</strong>l genoma flexible, producto <strong>de</strong><br />
eventos <strong>de</strong> transferencia horizontal ó <strong>de</strong> <strong>de</strong>leción genómica, son abundantes y representan<br />
la <strong>mayo</strong>r parte <strong>de</strong>l pangenoma <strong>de</strong> esta muestra <strong>de</strong> E. coli (Figura S1). Esto, aunado a los<br />
altos niveles <strong>de</strong> i<strong>de</strong>ntidad nucleotídica encontrados en el genoma central (≥ 0.96; Tabla S2)<br />
apoyarían la i<strong>de</strong>a <strong>de</strong> que la transferencia horizontal y el flujo génico son los principales<br />
procesos que generan la diversidad en la especie (Darling et al. 2004).<br />
Al comparar los elementos <strong>de</strong>l genoma flexible compartidos por los individuos <strong>de</strong><br />
cada eco-grupo, encontramos que las cepas no-patógenas tienen <strong>mayo</strong>r número <strong>de</strong> regiones<br />
<strong>de</strong>l genoma flexible que las patógenas (3.3% contra 1.3%). Este resultado pareciera<br />
contra<strong>de</strong>cir a la teoría clásica <strong>de</strong> evolución <strong>de</strong> la patogénesis, pues se ha sugerido que son<br />
los elementos <strong>de</strong>l genoma flexible los que han permitido a las bacterias la adaptación al<br />
nicho patógeno. En ese caso las cepas patógenas <strong>de</strong>berían poseer una poza <strong>de</strong> genes<br />
flexibles más amplia que aquellas cepas que carecen <strong>de</strong> potencial patogénico. Sin embargo,<br />
no encontramos tal patrón. Esto pudiera ser explicado por dos motivos. Por una parte los<br />
elementos genéticos que permiten la patogénesis en E. coli son muy diversos y las<br />
combinaciones <strong>de</strong> éstos elementos que permiten la colonización <strong>de</strong> diferentes regiones <strong>de</strong><br />
un hospe<strong>de</strong>ro <strong>de</strong> manera exitosa son muy gran<strong>de</strong>s (Kuhnert et al. 2000; Tenaillon et al.<br />
2010), por lo que en teoría no se necesita un repertorio genético particular para que las<br />
bacterias posean capacidad patogénica. Asimismo, se ha propuesto que las cepas patógenas<br />
pue<strong>de</strong>n usar diferentes genes con funciones similares para el proceso <strong>de</strong> infección (Mokady<br />
et al. 2005).
100<br />
279<br />
280<br />
281<br />
282<br />
283<br />
284<br />
285<br />
286<br />
287<br />
288<br />
289<br />
290<br />
291<br />
292<br />
293<br />
294<br />
295<br />
296<br />
297<br />
298<br />
299<br />
300<br />
301<br />
302<br />
303<br />
304<br />
305<br />
306<br />
307<br />
308<br />
309<br />
Por otra parte, hay numerosos estudios <strong>de</strong> genómica comparada y <strong>de</strong> evolución<br />
experimental han encontrado que las cepas comensales comparten también una gran parte<br />
<strong>de</strong> factores genéticos asociados al proceso <strong>de</strong> infección y patogénesis (Rasko et al. 2008;<br />
Touchon et al. 2009; Tenaillon et al. 2010), por lo que se ha propuesto que probablemente<br />
algunos <strong>de</strong> los factores antes conocidos como <strong>de</strong> virulencia más bien funcionan como<br />
elementos <strong>de</strong> a<strong>de</strong>cuación para ambos nichos (Levin et al. 1996; Le Gall et al. 2007). De<br />
esta manera, las cepas comensales podrían estar funcionando como un reservorio <strong>de</strong><br />
elementos genéticos con potencial patogénico (Rasko et al. 2008). Estas i<strong>de</strong>as constituyen<br />
un primer marco teórico para proponer que la patogénesis no sólo está <strong>de</strong>terminada por la<br />
adquisición ó perdida <strong>de</strong> genes mediante transferencia horizontal. Entonces, probablemente<br />
las cepas patógenas <strong>de</strong> nuestra muestra comparten menos factores genéticos <strong>de</strong>l genoma<br />
flexible que las no-patógenas <strong>de</strong>bido a que el número <strong>de</strong> genes que pue<strong>de</strong>n estar<br />
involucrados en el proceso <strong>de</strong> patogénesis general es muy gran<strong>de</strong> y variable (Johnson et al.<br />
2006b). Ahora, si los factores antes conocidos como <strong>de</strong> virulencia se encuentran también en<br />
las cepas comensales (Rasko et al. 2008), <strong>de</strong>bemos preguntarnos si existen otras regiones<br />
<strong>de</strong>l genoma que promuevan la patogénesis en E. coli.<br />
3.3. Diversidad genética en el cromosoma <strong>de</strong> E. coli<br />
La diversidad nucleotídica promedio <strong>de</strong>l genoma central <strong>de</strong> E. coli con valor <strong>de</strong> π =<br />
<strong>0.0</strong>217819 ± <strong>0.0</strong>002824, fue <strong>mayo</strong>r en relación a lo reportado para regiones codificantes <strong>de</strong>l<br />
genoma <strong>de</strong> otras especies <strong>de</strong> bacterias patógenas como Staphylococcus aureus (π =<br />
<strong>0.0</strong>0010; π = <strong>0.0</strong>0847; Nübel et al. 2008 y Takuno et al., 2012 respectivamente),<br />
Mycobacterium tuberculosis (π = <strong>0.0</strong>0024; Dos Vultos et al. 2008), Salmonella typhi (π =<br />
<strong>0.0</strong>0006; Roumagnac et al. 2009) e inclusive <strong>de</strong> una muestra diferente <strong>de</strong> genomas <strong>de</strong> E.<br />
coli (8 individuos) y Shigella (6 individuos) que solamente analizan regiones codificantes<br />
(π = <strong>0.0</strong>15; Chattopadhay et al. 2009).<br />
En bacterias, la inexistencia <strong>de</strong> un proceso <strong>de</strong> recombinación sexual acoplado a la<br />
reproducción, el paradigma <strong>de</strong> diversidad clonal (Selan<strong>de</strong>r y Levin 1980) y la extensiva
101<br />
310<br />
311<br />
312<br />
313<br />
314<br />
315<br />
316<br />
317<br />
318<br />
319<br />
320<br />
321<br />
322<br />
323<br />
324<br />
325<br />
326<br />
327<br />
328<br />
329<br />
330<br />
331<br />
332<br />
333<br />
334<br />
335<br />
336<br />
337<br />
338<br />
339<br />
340<br />
diversidad en el repertorio genético, generada principalmente por eventos <strong>de</strong> transferencia<br />
horizontal <strong>de</strong> genes, han promovido la i<strong>de</strong>a <strong>de</strong> que la diversidad en el genoma central<br />
bacteriano está <strong>de</strong>terminada por la mutación y la <strong>de</strong>riva génica, y por lo tanto los loci<br />
centrales <strong>de</strong>ben comportarse <strong>de</strong> manera neutral, tener baja ó nula recombinación (ser<br />
clonales) y no encontrarse bajo presiones selectivas. Adicionalmente, ya que se consi<strong>de</strong>ra<br />
que la adaptación en bacterias está <strong>de</strong>terminada por la naturaleza y función <strong>de</strong> los genes que<br />
han sido adquiridos ó perdidos por transferencia horizontal y que forman parte <strong>de</strong>l genoma<br />
flexible, el genoma central <strong>de</strong>bería estar conformado por elementos genéticos esenciales<br />
para la realización <strong>de</strong> las funciones biológicas básicas, por lo que se espera que su<br />
diversidad sea más ó menos homogénea y reducida en relación al genoma flexible<br />
(Hochhut et al. 2006).<br />
En el presente trabajo se encontró que la diversidad nucleotídica <strong>de</strong> los loci <strong>de</strong>l<br />
genoma central <strong>de</strong> E. coli fue más bien heterogénea y presentó una varianza gran<strong>de</strong><br />
(V(π)=<strong>0.0</strong>0032863; Tabla S3). Los valores abarcaron un rango muy amplio, <strong>de</strong>s<strong>de</strong><br />
diversidad nula (π = 0) en varios loci tanto codificantes como no-codificantes, hasta una<br />
diversidad <strong>de</strong> π = 0.224242 en una región <strong>de</strong>l gen tynA que codifica para una oxidasa<br />
activada en condiciones <strong>de</strong> anaerobiosis, cuya diversidad es similar a lo que se ha<br />
registrado a nivel genómico entre individuos <strong>de</strong> diferentes especies, como el género<br />
Yersinia en don<strong>de</strong> se reporta una diversidad genómica <strong>de</strong> π = 0.27 (Chen et al. 2010) y a lo<br />
que se ha <strong>de</strong>scrito para genes <strong>de</strong> virulencia en E. coli, como por ejemplo en la isla <strong>de</strong><br />
patogénesis <strong>de</strong>l locus <strong>de</strong> esfacelamiento enterocítico LEE, don<strong>de</strong> la diversidad máxima se<br />
reporta para el gen sepZ y es <strong>de</strong> π = 0.24 (Castillo et al. 2005).<br />
3.4. Patrones <strong>de</strong> <strong>de</strong>sequilibrio <strong>de</strong> ligamiento: estructura clonal ó panmíctica<br />
La prueba <strong>de</strong> <strong>de</strong>sequilibrio <strong>de</strong> ligamiento Zns se utiliza como una medida <strong>de</strong>l grado <strong>de</strong><br />
clonalidad que pue<strong>de</strong> existir en una población (Maynard- Smith 1993) ya que se ha visto<br />
que es inversamente proporcional a la presencia <strong>de</strong> recombinación (Dawson et al. 2002;<br />
Hedrick 2005). Cuando los valores son significativamente diferentes <strong>de</strong> 0 indican presencia<br />
<strong>de</strong> <strong>de</strong>sequilibrio <strong>de</strong> ligamiento, i.e. clonalidad. Valores <strong>de</strong> 0 indican ausencia <strong>de</strong>
102<br />
341<br />
342<br />
343<br />
344<br />
345<br />
346<br />
347<br />
348<br />
349<br />
350<br />
351<br />
352<br />
353<br />
354<br />
355<br />
356<br />
357<br />
358<br />
359<br />
360<br />
361<br />
362<br />
363<br />
364<br />
365<br />
366<br />
367<br />
368<br />
369<br />
370<br />
371<br />
<strong>de</strong>sequilibrio <strong>de</strong> ligamiento i.e. recombinación. En nuestra muestra <strong>de</strong> E. coli, <strong>de</strong> los 4,122<br />
loci <strong>de</strong>l genoma central analizados, solamente 202 loci fueron significativamente diferentes<br />
<strong>de</strong> 0 en la prueba Zns (promedio Zns=0.3642279 ± <strong>0.0</strong>020288). Estos 202 loci representan<br />
el 4.9% <strong>de</strong> loci <strong>de</strong>l genoma central. Es <strong>de</strong>cir que solamente una porción muy pequeña <strong>de</strong>l<br />
genoma central está en <strong>de</strong>sequilibrio <strong>de</strong> ligamiento (i.e., es clonal) (Figura 2 d; Tabla S3).<br />
Utilizando otra aproximación estadística, Di<strong>de</strong>lot y colaboradores (2012) sugieren que la<br />
tasa <strong>de</strong> recombinación es casi homogénea a lo largo <strong>de</strong>l genoma <strong>de</strong> E. coli a excepción <strong>de</strong><br />
tres sitios don<strong>de</strong> la tasa <strong>de</strong> recombinación es mucho <strong>mayo</strong>r (un sitio alre<strong>de</strong>dor <strong>de</strong>l operón<br />
rfb, un sitio alre<strong>de</strong>dor <strong>de</strong> fimA y un sitio alre<strong>de</strong>dor <strong>de</strong> aroC). Asimismo, en una muestra <strong>de</strong><br />
6 genomas enterobacterianos, 4 <strong>de</strong> E. coli (la K12 MG1655, dos cepas EHEC O157:H7<br />
Sakai y O157:H7 EDL933 y la cepa CFT073 <strong>de</strong> UTI) y 2 <strong>de</strong> Shigella, se ha presentado<br />
evi<strong>de</strong>ncia <strong>de</strong> recombinación homóloga en un porcentaje apreciable <strong>de</strong> las regiones <strong>de</strong>l<br />
genoma central (7.5% <strong>de</strong> 3.4 Mb, correspondiente a 251 kb), en regiones no-codificantes y<br />
entre fragmentos <strong>de</strong> genes involucrados en los procesos <strong>de</strong> recombinación, transporte,<br />
quimiotaxis y motilidad, principalmente (Mau et al. 2006).<br />
3.5. Selección natural a nivel molecular<br />
Bajo el mo<strong>de</strong>lo <strong>de</strong> evolución neutral <strong>de</strong> Kimura (1989), se predice que la <strong>mayo</strong>r parte <strong>de</strong> la<br />
diversidad <strong>de</strong>l genoma <strong>de</strong>be ser generada por mutación y eliminada ó mantenida por la<br />
<strong>de</strong>riva génica. Por lo que solamente algunas regiones estarán afectadas por selección<br />
negativa (purificadora), y la selección positiva (diversificadora) <strong>de</strong>be ser prácticamente<br />
nula. En nuestra muestra, efectivamente sólo i<strong>de</strong>ntificamos algunos loci en los cuales las<br />
pruebas <strong>de</strong> selección aplicadas resultaron significativas, (215 loci correspondientes al 5.2%<br />
<strong>de</strong>l total <strong>de</strong> loci). Este porcentaje <strong>de</strong> regiones bajo selección en el genoma central es similar<br />
a lo encontrado por Chattopadhay et al. (2009), aunque ellos se limitan a analizar regiones<br />
codificantes (300 genes ortólogos correspondientes al 5.6% <strong>de</strong>l repertorio génico total) en<br />
una muestra <strong>de</strong> E. coli y Shigella (Figura S2).<br />
A pesar <strong>de</strong> que los loci bajo selección fueron en general escasos, la ten<strong>de</strong>ncia <strong>de</strong><br />
éstos fue hacia valores positivos (196 loci correspondientes al 4.8% <strong>de</strong>l total <strong>de</strong> loci), y la
103<br />
372<br />
373<br />
374<br />
375<br />
376<br />
377<br />
378<br />
379<br />
380<br />
381<br />
382<br />
383<br />
384<br />
385<br />
386<br />
387<br />
388<br />
389<br />
390<br />
391<br />
392<br />
393<br />
394<br />
395<br />
396<br />
397<br />
398<br />
399<br />
400<br />
401<br />
402<br />
fracción <strong>de</strong> loci bajo selección negativa fue muy pequeña (19 loci correspondientes al 0.4%<br />
<strong>de</strong>l total). Este patrón, que contradice lo que se espera bajo neutralidad, ha sido reportado<br />
en estudios <strong>de</strong> selección en regiones codificantes a nivel genómico, en diferentes muestras<br />
<strong>de</strong> genomas <strong>de</strong> E. coli (Charlesworth y Eyre-Walker 2006; Chen et al. 2006; Petersen et al.<br />
2007; Chattopadhay et al. 2009), en la bacteria patógena Listeria monocytogenes (Orsi et al.<br />
2008) y en los endosimbiontes <strong>de</strong> insectos Buchnera sp. y Blochmannia sp. (Toft et al.<br />
2009).<br />
La baja señal <strong>de</strong> clonalidad (que implica un efecto extendido <strong>de</strong> la recombinación en<br />
el genoma) y la <strong>mayo</strong>r proporción <strong>de</strong> regiones bajo selección positiva que <strong>de</strong> regiones bajo<br />
selección negativa nos inclinan a conjeturar que el cromosoma <strong>de</strong> E. coli podría no estar<br />
siguiendo el mo<strong>de</strong>lo neutro <strong>de</strong> evolución genómica (Tabla S3). Sabemos que bajo el<br />
mo<strong>de</strong>lo neutro sólo la <strong>de</strong>riva génica y la mutación darían cuenta <strong>de</strong> la diversidad a nivel <strong>de</strong>l<br />
genoma (Kimura 1989). Y estas fuerzas evolutivas <strong>de</strong>ben actuar <strong>de</strong> manera homogénea en<br />
todo el genoma, a menos que haya selección ó recombinación. De tal manera que si los<br />
patrones <strong>de</strong> diversidad no son homogéneos, y esto se consi<strong>de</strong>ra como evi<strong>de</strong>ncia suficiente<br />
<strong>de</strong> que la <strong>de</strong>riva génica y la mutación no están en equilibrio, entonces las otras fuerzas<br />
<strong>de</strong>ben estar <strong>de</strong>sequilibrándolo, ya sea la selección ó la recombinación. Dado que en nuestro<br />
caso no fueron muchas regiones las que presentaron evi<strong>de</strong>ncia <strong>de</strong> selección, lo más<br />
probable es que el cromosoma no se esté comportando neutralmente, no tanto porque haya<br />
mucha selección, sino porque hay mucha recombinación.<br />
Una posible explicación a estos <strong>de</strong>scubrimientos la da Charlesworth (2009), quien<br />
ha sugerido que el tamaño efectivo pue<strong>de</strong> llegar a variar <strong>de</strong> una región a otra <strong>de</strong>l genoma.<br />
Como sabemos, el tamaño efectivo va directamente relacionado con la <strong>de</strong>riva génica.<br />
Entonces si el tamaño efectivo pue<strong>de</strong> variar, el equilibrio <strong>de</strong>riva - mutación también y<br />
pudiera ser que las diferencias en diversidad observadas no están generadas por el efecto <strong>de</strong><br />
la selección ó <strong>de</strong> la recombinación solamente. Finalmente, las interacciones entre las<br />
diferentes fuerzas evolutivas probablemente sean más complejas <strong>de</strong> lo que se ha pensado,<br />
sobre todo a nivel genómico, y se requiera <strong>de</strong> un mo<strong>de</strong>lo diferente para po<strong>de</strong>r <strong>de</strong>scribirlas.
104<br />
403<br />
404<br />
405<br />
406<br />
407<br />
408<br />
409<br />
410<br />
411<br />
412<br />
413<br />
414<br />
415<br />
416<br />
417<br />
418<br />
419<br />
420<br />
421<br />
422<br />
423<br />
424<br />
425<br />
426<br />
427<br />
428<br />
429<br />
430<br />
431<br />
432<br />
433<br />
Entre las múltiples funciones <strong>de</strong> los genes bajo selección positiva en el genoma<br />
central <strong>de</strong> E. coli, <strong>de</strong>stacan las categorías relacionadas con el proceso <strong>de</strong> transcripción y con<br />
la toxicidad, en particular con el estrés oxidativo. En cuanto a las categorías <strong>de</strong> genes<br />
involucrados en la transcripción tenemos la modificación <strong>de</strong> bases <strong>de</strong> tARN y rARN, la<br />
sín<strong>tesis</strong> <strong>de</strong> ARN polimerasa ADN-<strong>de</strong>pendiente y reguladores <strong>de</strong> la transcripción (más<br />
específicamente el represor hdfR que se encuentra en la categoría funcional <strong>de</strong><br />
Transcripción – Otros). Y asociados a la toxicidad celular tenemos la categoría <strong>de</strong><br />
biosín<strong>tesis</strong> <strong>de</strong> cofactores - glutatión y análogos - riboflavina, FMN y FAD y la categoría <strong>de</strong><br />
procesos celulares – <strong>de</strong>toxificación. En esta última categoría se encuentran los genes <strong>de</strong> la<br />
catalasa hidroperoxidasa I katG, <strong>de</strong> la bacterioferritina bfr que aparentemente confiere<br />
resistencia frente a hidroperóxidos (Abdul-Tehrani et al. 1999) y el represor transcripcional<br />
arsR <strong>de</strong>l operón ars, que confiere resistencia a antimonio y arsénico (Carlin et al. 1995).<br />
Por un lado, la presencia <strong>de</strong> selección diversificadora en los genes asociados al<br />
manejo <strong>de</strong> la toxicidad pue<strong>de</strong> indicarnos la existencia <strong>de</strong> un proceso <strong>de</strong> adaptación a las<br />
diferencias en concentración <strong>de</strong> oxígeno que existen entre el medio interno <strong>de</strong>l hospe<strong>de</strong>ro y<br />
el ambiente externo, entre los cuales transita esta especie (Savageau 1983). Por otro lado, la<br />
existencia <strong>de</strong> diversidad adaptativa en genes asociadas a la transcripción, y el número<br />
gran<strong>de</strong> <strong>de</strong> regiones, aparentemente, no-codificantes también con evi<strong>de</strong>ncia <strong>de</strong> selección<br />
positiva (13 loci correspondientes al 0.3% <strong>de</strong>l total), podrían apoyar la i<strong>de</strong>a <strong>de</strong> que uno <strong>de</strong><br />
los elementos clave en el proceso adaptativo, es la evolución <strong>de</strong> la expresión génica y sus<br />
re<strong>de</strong>s regulatorias (King y Wilson 1975; Carroll et al. 2001). Evi<strong>de</strong>ncia <strong>de</strong> selección<br />
positiva en regiones no-codificantes <strong>de</strong>l genoma ha sido presentada <strong>de</strong> manera amplia en el<br />
género Drosophila, don<strong>de</strong> se ha visto que algunos tipos <strong>de</strong> regiones no-codificantes son<br />
más diversas que el resto <strong>de</strong>l genoma, encontrándose bajo selección positiva, lo que se ha<br />
interpretado como prueba <strong>de</strong> que la regulación transcripcional es un elemento importante en<br />
la evolución <strong>de</strong> este género <strong>de</strong> insectos (Andolfatto 2005).<br />
Asimismo, Alm et al. (2006) estudiaron la adquisición histórica <strong>de</strong> genes asociados<br />
a la transducción <strong>de</strong> señales (histidin-cinasas), involucrados en la regulación <strong>de</strong> la<br />
expresión genética, y encontraron que en diversas especies bacterianas, la introducción <strong>de</strong>
105<br />
434<br />
435<br />
436<br />
437<br />
438<br />
439<br />
440<br />
441<br />
442<br />
443<br />
444<br />
445<br />
446<br />
447<br />
448<br />
449<br />
450<br />
451<br />
452<br />
453<br />
454<br />
455<br />
456<br />
457<br />
458<br />
459<br />
460<br />
461<br />
462<br />
463<br />
464<br />
nuevos genes <strong>de</strong> histidin-cinasas a los genomas (ya sea por transferencia horizontal <strong>de</strong><br />
genes ó por expansión <strong>de</strong> familias génicas <strong>de</strong>ntro <strong>de</strong> los linajes) se asocia a eventos <strong>de</strong><br />
expansión poblacional. Consi<strong>de</strong>ran que el aumento en el tamaño <strong>de</strong> la población es<br />
evi<strong>de</strong>ncia <strong>de</strong> que éstas se han adaptado a nuevas condiciones <strong>de</strong>bido a la adquisición <strong>de</strong><br />
nuevas funciones <strong>de</strong> regulación <strong>de</strong> la expresión génica y <strong>de</strong> nuevos patrones metabólicos ó<br />
fisiológicos. La evolución al nivel <strong>de</strong> estos genes es muy rápida, pues una sola mutación en<br />
uno <strong>de</strong> estos genes modifica la expresión <strong>de</strong> más <strong>de</strong> 100 genes (Giraud et al. 2008). Incluso<br />
hay evi<strong>de</strong>ncia experimental <strong>de</strong> adaptación generada por una sola mutación en regulacióncis<br />
en Salmonella (Osborne et al. 2009).<br />
En cuanto a los genes con evi<strong>de</strong>ncia <strong>de</strong> selección negativa, se esperaba que<br />
correspondieran a funciones <strong>de</strong>l metabolismo básico y a la biosín<strong>tesis</strong> <strong>de</strong> estructuras<br />
celulares esenciales para la supervivencia. Efectivamente, los encontramos agrupados en las<br />
categorías funcionales <strong>de</strong> metabolismo energético - aminoácidos y aminas, anaeróbico y<br />
ruta <strong>de</strong> las pentosas/fosfato; procesos celulares – división celular, quimiotaxis y motilidad y<br />
producción <strong>de</strong> toxinas y resistencia; proteínas <strong>de</strong> transporte y unión – aminoácidos,<br />
péptidos y aminas; biosín<strong>tesis</strong> <strong>de</strong> cofactores - pantotenato y coenzimaA; <strong>de</strong>stino <strong>de</strong><br />
proteínas - modificación <strong>de</strong> proteínas y reparación; envoltura celular – otros (don<strong>de</strong> se<br />
encuentra el gen fhuA <strong>de</strong> proteína <strong>de</strong> membrana externa para transporte <strong>de</strong> ferricromo, el<br />
gen skp <strong>de</strong> chaperona periplásmica y el gen <strong>de</strong> proteína <strong>de</strong> membrana externa ompN); y la<br />
categoría <strong>de</strong> sín<strong>tesis</strong> <strong>de</strong> proteínas – factores <strong>de</strong> traducción y otros (don<strong>de</strong> se encuentran los<br />
ARN ribosomales) (Figura S2, Figura S3A y S3B).<br />
3.6. Diversidad ecológica a nivel molecular en E. coli<br />
Los dos eco-grupos aquí <strong>de</strong>finidos presentaron una estructura cromosómica diferente entre<br />
sí, aunque conservada al interior <strong>de</strong> cada grupo (Tabla 2). A un nivel más fino, la<br />
diversidad genética también fue diferente (Tabla 3). El eco-grupo <strong>de</strong> cepas patógenas<br />
registró <strong>mayo</strong>r diversidad tanto en el genoma central como en el genoma flexible con<br />
respecto al eco-grupo <strong>de</strong> las cepas no-patógenas. El rango <strong>de</strong> diversidad nucleotídica π en<br />
los loci <strong>de</strong>l genoma central fue similar en ambos eco-grupos, abarcando <strong>de</strong> 0-<strong>0.0</strong>004 hasta
106<br />
465<br />
466<br />
467<br />
468<br />
469<br />
470<br />
471<br />
472<br />
473<br />
474<br />
475<br />
476<br />
477<br />
478<br />
479<br />
480<br />
481<br />
482<br />
483<br />
484<br />
485<br />
486<br />
487<br />
488<br />
489<br />
490<br />
491<br />
492<br />
493<br />
494<br />
0.20571 en E. coli no-patógena, y <strong>de</strong> 0-<strong>0.0</strong>002857 hasta 0.20635 en E. coli patógena. Estos<br />
rangos son mucho más amplios <strong>de</strong> lo que se ha <strong>de</strong>scrito para genes <strong>de</strong> mantenimiento en la<br />
especie (π = <strong>0.0</strong>04 a <strong>0.0</strong>13; Wirth et al. 2006), y los valores máximos inclusive se<br />
encuentran <strong>de</strong>ntro <strong>de</strong>l rango <strong>de</strong> diversidad que se ha <strong>de</strong>scrito para algunos genes asociados<br />
a virulencia (π = <strong>0.0</strong>3 a 0.24; Castillo et al. 2005). En el genoma flexible, los rangos <strong>de</strong><br />
diversidad π estimada fueron más amplios, yendo <strong>de</strong> 0 a 0.214285 en las no-patógenas, y <strong>de</strong><br />
0 a 0.36 en las patógenas. Los valores máximos, tanto <strong>de</strong> genoma central como <strong>de</strong> genoma<br />
flexible <strong>de</strong> ambos eco-grupos, correspondieron a regiones no-codificantes, adyacentes a<br />
regiones <strong>de</strong>l genoma flexible, en el caso <strong>de</strong>l genoma central, y a regiones variables en el<br />
caso <strong>de</strong>l genoma flexible. Se ha encontrado que la <strong>mayo</strong>r diversidad <strong>de</strong>ntro <strong>de</strong>l genoma se<br />
da en las regiones adyacentes a regiones variables, sujetas a transferencia horizontal. Estas<br />
regiones altamente variables funcionarían como anclas a la recombinación, tanto homóloga<br />
como ilegítima, promoviendo la acumulación <strong>de</strong> nuevos alelos y <strong>de</strong> diversidad a<br />
comparación <strong>de</strong> otras regiones <strong>de</strong>l genoma (Touchon et al. 2009).<br />
Se ha <strong>de</strong>scrito previamente que las cepas patógenas <strong>de</strong> E. coli tienen menor<br />
diversidad que las cepas comensales, pero tales patrones se han observado en muestras <strong>de</strong><br />
patotipos particulares y asociadas a una sola especie <strong>de</strong> hospe<strong>de</strong>ro, como por ejemplo en<br />
cepas causantes <strong>de</strong> septicemia (Maslow et al. 1995), <strong>de</strong> meningitis neonatal NMEC (Bingen<br />
et al. 1998), y cepas <strong>de</strong>l patotipo ETEC en cerdos (Wu et al. 2007). Por lo tanto los valores<br />
<strong>de</strong> diversidad en cepas patógenas encontrados en este estudio respon<strong>de</strong>n a un muestreo más<br />
amplio en dos aspectos, primero con respecto a la muestra que correspon<strong>de</strong> a cepas <strong>de</strong><br />
diferentes patotipos, y en segundo con relación al marcador que consta <strong>de</strong> numerosos loci<br />
cromosómicos. Pudiera ser entonces que, por una parte la diversidad <strong>de</strong> todos los patotipos<br />
en conjunto es efectivamente superior a la <strong>de</strong> las cepas comensales y <strong>de</strong> vida libre. Y por<br />
otra parte, pudieran ser las regiones no-codificantes, que sí se analizan en este estudio, las<br />
que están aumentando la diversidad en las cepas patógenas. Para probar esto, es necesario<br />
más a<strong>de</strong>lante, analizar <strong>de</strong> manera más fina la diversidad en regiones codificantes y nocodificantes<br />
a nivel genómico.
107<br />
495<br />
496<br />
497<br />
498<br />
499<br />
500<br />
501<br />
502<br />
503<br />
504<br />
505<br />
506<br />
507<br />
508<br />
509<br />
510<br />
511<br />
512<br />
513<br />
514<br />
515<br />
516<br />
517<br />
518<br />
519<br />
520<br />
521<br />
522<br />
523<br />
524<br />
525<br />
Pero hay otros fenómenos que pudieran explicar porque la diversidad nucleotídica<br />
en las cepas patógenas resultó ser <strong>mayo</strong>r, entre ellos la recombinación homóloga (Perna et<br />
al. 1998), la evolución por duplicación génica (Jordan 2002) ó el efecto <strong>de</strong> bacteriófagos<br />
(Inouye et al. 1991; Rodríguez-Valera et al. 2009), los cuales pue<strong>de</strong>n imponer un efecto <strong>de</strong><br />
selección <strong>de</strong>pendiente <strong>de</strong> la frecuencia en E. coli, lo que favorecería el mantenimiento <strong>de</strong><br />
alelos <strong>de</strong> restricción-modificación raros para contrarrestar a los bacteriófagos, lo que a su<br />
vez promovería la recombinación tanto legítima como ilegítima (Levin 1981).<br />
Efectivamente, en este trabajo, el eco grupo <strong>de</strong> E. coli patógenas fue<br />
significativamente menos clonal que el eco grupo <strong>de</strong> E. coli no-patógenas (Tabla 3; Figura<br />
2d). Estos resultados concuerdan con lo previamente reportado en la literatura. Y hay varios<br />
estudios en los que se reporta que las variantes patógenas <strong>de</strong> una misma especie son más<br />
recombinantes que las menos patógenas (Hendrickson y Lawrence 2006). Esto se pue<strong>de</strong><br />
explicar <strong>de</strong>s<strong>de</strong> un punto <strong>de</strong> vista adaptativo, si consi<strong>de</strong>ramos que la recombinación permite<br />
generar nuevas combinaciones alélicas que pudieran ser beneficiosas en nichos nuevos, aún<br />
cuando fueran ligeramente menos adaptativas en el nicho original. Al menos<br />
experimentalmente, se ha visto que la recombinación es capaz <strong>de</strong> acelerar la adaptación en<br />
E. coli (Cooper 2007).<br />
Por otra parte, la presencia <strong>de</strong> selección se consi<strong>de</strong>ra como señal <strong>de</strong> la ocurrencia <strong>de</strong><br />
un proceso adaptativo. Por lo que diferentes patrones en diferentes grupos <strong>de</strong> individuos se<br />
pue<strong>de</strong> consi<strong>de</strong>rar como un indicador <strong>de</strong> que las presiones ambientales están jugando un<br />
papel en el mol<strong>de</strong>o <strong>de</strong> la diversidad a nivel molecular. Dado que encontramos gran<strong>de</strong>s<br />
diferencias en los patrones <strong>de</strong> selección entre cepas no-patógenas y cepas patógenas <strong>de</strong> E.<br />
coli, po<strong>de</strong>mos pensar que es la selección lo que está generando diferentes patrones en la<br />
diversidad <strong>de</strong>l genoma central en don<strong>de</strong> la selección natural promueve la diversificación <strong>de</strong><br />
este componente <strong>de</strong>l genoma en las cepas patógenas a comparación <strong>de</strong> las cepas no<br />
patógenas (Figura 2a y 2b, Figura 3A y 3B; Figura 4A y 4B).<br />
Se sabe que un factor que pue<strong>de</strong> favorecer la aparición, mantenimiento y transición<br />
<strong>de</strong> bacterias comensales/oportunistas a patógenas/virulentas en un ambiente <strong>de</strong>terminado es
108<br />
526<br />
527<br />
528<br />
529<br />
530<br />
531<br />
532<br />
533<br />
534<br />
535<br />
536<br />
537<br />
538<br />
539<br />
540<br />
541<br />
542<br />
543<br />
544<br />
545<br />
546<br />
547<br />
548<br />
549<br />
550<br />
551<br />
552<br />
553<br />
554<br />
555<br />
556<br />
la disponibilidad elevada <strong>de</strong> recursos en el ambiente (We<strong>de</strong>kind et al. 2010), sobre todo si<br />
el tamaño efectivo es gran<strong>de</strong> (Stevens et al. 2007). En el caso <strong>de</strong> E. coli la capacidad <strong>de</strong><br />
colonizar y vivir en ambientes nuevos distintos al colon como el sistema urinario y sistema<br />
nervioso, pulmones, en don<strong>de</strong> hay menor competencia por los recursos y por lo tanto <strong>mayo</strong>r<br />
disponibilidad <strong>de</strong> ellos, es lo que probablemente favoreció el surgimiento <strong>de</strong> las cepas<br />
patógenas y lo que ha permitido que permanezcan evolutivamente, como grupos diferentes<br />
<strong>de</strong> las comensales.<br />
Adicionalmente, <strong>de</strong>ntro <strong>de</strong>l eco-grupo <strong>de</strong> las cepas patógenas analizamos la<br />
diversidad <strong>de</strong>l subgrupo <strong>de</strong> cepas patógenas intestinales y <strong>de</strong>l subgrupo <strong>de</strong> patógenas extraintestinales<br />
por separado. Encontramos que la diversidad fue <strong>mayo</strong>r en el grupo <strong>de</strong> E. coli<br />
patógenas extra- intestinales (π = <strong>0.0</strong>125736 ± <strong>0.0</strong>002437) que en las cepas patógenas<br />
intestinales (π = <strong>0.0</strong>090948 ± <strong>0.0</strong>001952). Chattopadhay et al. (2009) reportan valores <strong>de</strong><br />
diversidad promedio <strong>de</strong> genes en los genomas <strong>de</strong> cepas <strong>de</strong> UPEC (CFT, 536, UTI89) y E.<br />
coli patógena <strong>de</strong> ave (APEC01) <strong>de</strong> <strong>0.0</strong>04 ± <strong>0.0</strong>01, menor a lo que nosotros encontramos en<br />
todo el genoma central, que incluye no solamente genes sino también regiones nocodificantes,<br />
solamente en las cepas CFT, 536 y UTI89. De acuerdo a la clasificación<br />
filogenética tradicional <strong>de</strong> E. coli (Selan<strong>de</strong>r et al. 1986), las cepas extra-intestinales se<br />
encuentran en el grupo B2 (Johnson et al. 2006a, 2006b; Touchon et al. 2009), y las 3 cepas<br />
que usamos en el presente estudio están asignadas a dicho grupo (Chen et al. 2006). De<br />
acuerdo a estudios recientes (Jaureguy et al. 2008; Touchon et al. 2009), este linaje B2 sería<br />
el más antiguo, lo que pue<strong>de</strong> explicar por qué las cepas <strong>de</strong> este grupo <strong>de</strong> E. coli patógena<br />
son las que tienen la <strong>mayo</strong>r diversidad acumulada. A<strong>de</strong>más <strong>de</strong> esta explicación “histórica”,<br />
cabe señalar que las cepas urinarias poseen un gran número y diversidad <strong>de</strong> islas <strong>de</strong><br />
patogénesis, factores <strong>de</strong> virulencia y a<strong>de</strong>cuación provenientes hasta <strong>de</strong> otras especies a lo<br />
largo <strong>de</strong> su genoma (Le Gall et al. 2007; Rasko et al. 2008). Lo anterior pareciera indicar<br />
que en estas cepas hay una <strong>mayo</strong>r frecuencia <strong>de</strong> eventos <strong>de</strong> transferencia horizontal,<br />
sugiriendo que son más recombinantes que las cepas intestinales. Sería interesante saber si<br />
la recombinación es algo que ya estaba presente en estas cepas antes <strong>de</strong> que comenzaran a<br />
invadir el nicho <strong>de</strong> patogénesis extra-intestinal, ó sí es una característica que surgió en<br />
consecuencia <strong>de</strong> la colonización y adaptación a ese nuevo nicho.
109<br />
557<br />
558<br />
559<br />
560<br />
561<br />
562<br />
563<br />
564<br />
565<br />
566<br />
567<br />
568<br />
569<br />
570<br />
571<br />
572<br />
573<br />
574<br />
575<br />
576<br />
577<br />
578<br />
579<br />
580<br />
581<br />
582<br />
583<br />
584<br />
585<br />
586<br />
587<br />
Finalmente, cabe señalar que los resultados obtenidos representan sólo un fragmento<br />
<strong>de</strong> la diversidad total <strong>de</strong> la especie y es solamente un vistazo a la historia evolutiva <strong>de</strong> una<br />
fracción <strong>de</strong> las poblaciones <strong>de</strong> E. coli. Dado que el grupo <strong>de</strong> cepas patógenas analizado es<br />
en su <strong>mayo</strong>ría representativo <strong>de</strong> los patotipos <strong>de</strong> naturaleza epidémica (EHEC y UPEC;<br />
Johnson et al. 2002), las características <strong>de</strong> la muestra y en específico <strong>de</strong> las cepas patógenas<br />
aquí presentadas podrían estar reflejando la dinámica evolutiva <strong>de</strong> un conjunto particular <strong>de</strong><br />
cepas, cuyo genotipo, al originarse y expandirse clonalmente en el tiempo y en el espacio<br />
(clonas epidémicas) reflejan un comportamiento diferente con respecto a E. coli en general<br />
(Maynard-Smith 1993). Posteriormente tendríamos que verificar si las diferencias en el<br />
patrón <strong>de</strong> diversidad en el genoma central se mantienen aún agregando cepas <strong>de</strong> patotipos<br />
no-clonales, como las ETEC, las EPEC ó las EAEC, y más cepas comensales y <strong>de</strong> vida<br />
libre <strong>de</strong> E. coli.<br />
4. Conclusiones<br />
Con este estudio proponemos que la adaptación al nicho patógeno <strong>de</strong> E. coli no está<br />
<strong>de</strong>terminada únicamente por los elementos <strong>de</strong>l genoma flexible sino que el genoma central<br />
juega un papel importante en este proceso <strong>de</strong>bido a las huellas <strong>de</strong> la acción <strong>de</strong> selección<br />
natural y <strong>de</strong> la recombinación <strong>de</strong>tectadas lo que sugiere un proceso <strong>de</strong> adaptación ecológica<br />
a la patogénesis a nivel <strong>de</strong> los elementos <strong>de</strong>l genoma central. Asimismo, encontramos que<br />
los patrones <strong>de</strong> diversidad <strong>de</strong>l genoma central <strong>de</strong> E. coli no concuerdan en su totalidad con<br />
el mo<strong>de</strong>lo <strong>de</strong> evolución neutral <strong>de</strong>l genoma sino que existe un dinámica diferencial entre la<br />
acción <strong>de</strong> la selección natural y la recombinación homóloga a lo largo <strong>de</strong>l genoma. Sin<br />
embargo, es necesario en futuros análisis evaluar también el papel <strong>de</strong> la <strong>de</strong>riva génica -en<br />
términos <strong>de</strong> la variación en el tamaño efectivo poblacional- en la evolución <strong>de</strong> la<br />
patogénesis.
110<br />
588<br />
5. Agra<strong>de</strong>cimientos<br />
589<br />
590<br />
591<br />
592<br />
593<br />
594<br />
595<br />
596<br />
597<br />
Al Biól. Tobías Portillo, por el apoyo brindado en el uso <strong>de</strong>l cluster computacional<br />
KanBalan, DGSCA, <strong>UNAM</strong>, México, D.F. y en los aspectos bioinformáticos <strong>de</strong> este<br />
trabajo. Al Dr. José Luis Puente García, Dr. Arturo Carlos II Becerra Bracho y Dr. León<br />
Patricio Martínez Castilla por los constructivos y fructíferos comentarios al presente<br />
estudio. Este trabajo fue financiado el proyecto PAPIIT/DGAPA IN219109. Durante la<br />
elaboración <strong>de</strong> este trabajo Sánchez-Reyes, L recibió la beca <strong>de</strong> ayudante SNI <strong>de</strong> Luis E.<br />
Eguiarte Fruns <strong>de</strong>ntro <strong>de</strong>l proyecto: “Transferencia horizontal en bacterias entéricas<br />
diarréicas y la evolución <strong>de</strong> la patogénesis”.<br />
598<br />
599<br />
6. Referencias<br />
600<br />
601<br />
602<br />
603<br />
604<br />
605<br />
606<br />
607<br />
608<br />
609<br />
610<br />
611<br />
612<br />
613<br />
614<br />
615<br />
616<br />
617<br />
618<br />
619<br />
Abdul-Tehrani H, Hudson AJ, Chang YS, Timms AR, Hawkins C, Williams JM, Harrison PM, Guest JR,<br />
Andrews SC. 1999. Ferritin mutants of Escherichia coli are iron <strong>de</strong>ficient and growth impaired, and fur<br />
mutants are iron <strong>de</strong>ficient. J Bacteriol 181(5);1415-28.<br />
Altschul SF, Gish W, Miller W, Myers EW, Lipman DJ. 1990. Basic local alignment search tool. J. Mol. Biol.<br />
215:403-410.<br />
An<strong>de</strong>rson KL, JE Whitlock, VJ Harwood. 2005. Persistence and differential survival of fecal indicator<br />
bacteria in subtropical waters and sediments. Appl Environ Microbiol. 71(6):3041-8.<br />
Andolfatto P. 2005. Adaptive evolution of non-coding DNA in Drosophila. Nature. 437(7062):1149-52.<br />
Begun DJ, AK Holloway, K Stevens, LW Hillier, YP Poh, MW Hahn, PM Nista, CD Jones, AD Kern, CN<br />
Dewey, L Pachter, E Myers, CH Langley. 2007. Population genomics: whole-genome analysis of<br />
polymorphism and divergence in Drosophila simulans. PLoS Biol. 5(11):e310.<br />
Black, W.C. Baer, C.F., Antolin, M.F., DuTeau, N.M. 2001. Population genomics: genome-wi<strong>de</strong> sampling of<br />
insect populations. Annu. Rev. Entomol. 46, 441-469.<br />
Blattner FR, GIII Plunkett, CA Bloch, NT Perna, V Burland, M Riley, J Collado-Vi<strong>de</strong>s, JD Glasner, CK<br />
Ro<strong>de</strong>, GF Mayhew, J Gregor, NW Davis, HA Kirkpatrick, MA Goe<strong>de</strong>n, DJ Rose, B Mau, Y Shao. 1997. The<br />
complete genome sequence of Escherichia coli K-12. Science. 277: 1453–1462.<br />
Brown EW, JE LeClerc, B Li, WL Payne, TA Cebula. 2001. Phylogenetic evi<strong>de</strong>nce for horizontal transfer of<br />
mutS alleles among naturally occurring Escherichia coli strains. J Bacteriol. 183(5):1631-44.
111<br />
620<br />
621<br />
622<br />
623<br />
624<br />
625<br />
626<br />
627<br />
628<br />
629<br />
630<br />
631<br />
632<br />
633<br />
634<br />
635<br />
636<br />
637<br />
638<br />
639<br />
640<br />
641<br />
642<br />
643<br />
644<br />
645<br />
646<br />
647<br />
648<br />
649<br />
650<br />
651<br />
652<br />
Budroni, S, E Siena, JC Dunning Hotopp, KL Seib, D Serruto, Ch Nofroni et al. 2011. Neisseria meningitidis<br />
is structured in cla<strong>de</strong>s associated with restriction modification systems that modulate homologous<br />
recombination. Proc. Natl. Sci. Acad. 108(11): 4494-4499.<br />
Carlin A, Shi W, Dey S, Rosen BP. 1995. The ars operon of Escherichia coli confers arsenical and antimonial<br />
resistance. J Bacteriol. 177(4):981-6.<br />
Carroll SB, Grenier JK, Weatherbee SD. 2001. From DNA to Diversity: Molecular Genetics and the<br />
Evolution of Animal Design. Blackwell Science, Mal<strong>de</strong>n, Massachusetts.<br />
Castillo A, LE Eguiarte, V Souza. 2005. A genomic population genetics analysis of the pathogenic enterocyte<br />
effacement island in Escherichia coli: the search for the unit of selection. Proc Natl Acad Sci U S A.<br />
102(5):1542-7.<br />
Charlesworth B. 2009. Fundamental concepts in genetics: effective population size and patterns of molecular<br />
evolution and variation. Nat Rev Genet. 10(3):195-205.<br />
Chattopadhay S, Weissman SJ, Minin VN, Russo TA, Dykhuizen DE, Sokurenko EV. 2009. High frequency<br />
of hotspot mutations in core genes of Escherichia coli due to short-term positive selection. Proc Natl Acad Sci<br />
U S A. 106(30):12412-7.<br />
Chen PE, C Cook, AC Stewart, N Nagarajan, DD Sommer, M Pop, B Thomason, MP Kiley Thomason, S<br />
Lentz, N Nolan, S Sozhamannan, A Sulakvelidze, A Mateczun, L Du, ME Zwick, TD Read. 2010. Genomic<br />
characterization of the Yersinia genus. Genome Biol. 11(1): R1.<br />
Chen Q, SJ Savarino, MM Venkatesan. 2006. Subtractive hybridization and optical mapping of the<br />
enterotoxigenic Escherichia coli H10407 chromosome: isolation of unique sequences and <strong>de</strong>monstration of<br />
significant similarity to the chromosome of E. coli K-12. Microbiology. 152(Pt 4):1041-54.<br />
Choudhary M, X Zanhua, YX Fu, S Kaplan. 2007. Genome Analyses of Three Strains of Rhodobacter<br />
sphaeroi<strong>de</strong>s: Evi<strong>de</strong>nce of Rapid Evolution of Chromosome II. Journal of Bacteriology 189(5):1914–1921.<br />
Cubillos-Ruiz A, Morales J, Zambrano MM. 2008. Analysis of the genetic variation in Mycobacterium<br />
tuberculosis strains by multiple genome alignments. BMC Res Notes. 1:110.<br />
Darling ACE, B Mau, FR Blattner, NT Perna. 2004. Mauve: Multiple Alignment of Conserved Genomic<br />
Sequence With Rearrangements. Genome Res. 14: 1394-1403.<br />
D'Auria, N Jiménez-Hernán<strong>de</strong>z, F Peris-Bondia, A Moya, A Latorre. 2010. Legionella pneumophila<br />
pangenome reveals strain-specific virulence factors. BMC Genomics. 11: 181.<br />
Davidsen T, Beck E, Ganapathy A, Montgomery R, Zafar N, Yang Q, Madupu R, Goetz P, Galinsky K,<br />
White O, Sutton G. 2010. The comprehensive microbial resource. Nucleic Acids Res. 01(38): D340-5.<br />
Dawson E, GR Abecasis, S Bumpstead, Y Chen, S Hunt, DM Beare, J Pabial, T Dibling, E Tinsley, S Kirby,<br />
D Carter, M Papaspyridonos, S Livingstone, R Ganske, E Lõhmussaar, J Zernant, N Tõnisson, M Remm, R
112<br />
653<br />
654<br />
655<br />
656<br />
657<br />
658<br />
659<br />
660<br />
661<br />
662<br />
663<br />
664<br />
665<br />
666<br />
667<br />
668<br />
669<br />
670<br />
671<br />
672<br />
673<br />
674<br />
675<br />
676<br />
677<br />
678<br />
679<br />
680<br />
681<br />
682<br />
683<br />
Mägi, T Puurand, J Vilo, A Kurg, K Rice, P Deloukas, R Mott, A Metspalu, DR Bentley, LR Cardon, I<br />
Dunham. 2002. A first-generation linkage disequilibrium map of human chromosome 22. Nature.<br />
418(6897):544-8.<br />
Di<strong>de</strong>lot X, A Darling, D Falush. 2009. Inferring genomic flux in bacteria. Genome Res. 19:306-317<br />
Di<strong>de</strong>lot X, Méric G, Falush D, Dariling AE. 2012. Impact of homologous and non-homologous recombination<br />
in the genomic evolution of Escherichia coli. BMC Genomics, 13:256.<br />
Dixit SM, Gordon DM, Wu XY, Chapman T, Kailasapathy K, Chin JJ. 2004. Diversity analysis of<br />
commensal porcine Escherichia coli - associations between genotypes and habitat in the porcine<br />
gastrointestinal tract. Microbiology. 150(Pt 6):1735-40.<br />
Dobrindt U, B Hochhut, U Hentschel, J Hacker. 2004. Genomic Islands in Pathogenic and Environmental<br />
Microorganisms. Nature Reviews 2:414<br />
Dobrindt U, J Hacker. 2008. Targeting virulence traits: potential strategies to combat extraintestinal<br />
pathogenic E. coli infections. Curr Opin Microbiol. 11(5):409-13.<br />
Doolittle WF. 1999a. Lateral genomics. Trends Cell Biol. 9(12):M5-8<br />
Doolittle WF. 1999b. Phylogenetic classification and the Universal Tree. Science. 284(5423):2124-2128.<br />
Dos Vultos T, O Mestre, J Rauzier, M Golec, N Rastogi, V Rasolofo, T Tonjum, C Sola, I Matic, B Gicquel.<br />
2008. Evolution and Diversity of Clonal Bacteria: The Paradigm of Mycobacterium tuberculosis. PLoS ONE<br />
3(2): e1538.<br />
Dziva F, Stevens MP. 2008. Colibacillosis in poultry: unravelling the molecular basis of virulence of avian<br />
pathogenic Escherichia coli in their natural hosts. Avian Pathol. 37(4):355-66. Review.<br />
Ebert D, JJ Bull. 2003. Challenging the tra<strong>de</strong>-off mo<strong>de</strong>l for the evolution of virulence: is virulence<br />
management feasible Trends Microbiol. 11:15 - 20.<br />
Ferenci T, Zhou Z, Betteridge T, Ren Y, Liu Y, Feng L, Reeves PR, Wang L 2009. Genomic Sequencing<br />
Reveals Regulatory Mutations and Recombinational Events in the Wi<strong>de</strong>ly Used MC4100 Lineage of<br />
Escherichia coli K-12. J. Bacteriol. 191: 4025-4029.<br />
Fu YX, WH Li. 1993. Statistical tests of neutrality of mutations. Genetics 133:693-709.<br />
González-González A, Sánchez-Reyes LL, Delgado G, Eguiarte LE, Souza V. 2013. Hierarchical clustering<br />
of genetic diversity associated to different levels of mutation and recombination in Escherichia coli: A study<br />
based on Mexican isolates. Infection, Genetics and Evolution. 13, 187-197.<br />
Groisman EA, H Ochman. 1996. Pathogenicity islands: bacterial evolution in quantum leaps. Cell 87: 791–<br />
794.
113<br />
684<br />
685<br />
686<br />
687<br />
688<br />
689<br />
690<br />
691<br />
692<br />
693<br />
694<br />
695<br />
696<br />
697<br />
698<br />
699<br />
700<br />
701<br />
702<br />
703<br />
704<br />
705<br />
706<br />
707<br />
708<br />
709<br />
710<br />
711<br />
712<br />
713<br />
714<br />
715<br />
Hacker J, JB Kaper. 2000. Pathogenicity islands and the evolution of microbes. Annu Rev Microbiol. 54:641–<br />
679.<br />
Hall TA. 1999. BioEdit: a user-friendly biological sequence alignment editor and analysis program for<br />
Windows 95/98/NT. Nucl. Acids. Symp. Ser. 41:95-98.<br />
Hansson S, D Caugant, U Jodal, C Svanborg-E<strong>de</strong>n. 1989. Untreated asymptomatic bacteriuria in girls: I-<br />
stability of urinary isolates. BMJ 298:853-855.<br />
Hedrick PW. 2005. Genetics of Populations. 3 ed. Jones & Bartlett Publishers, Sudbury, Massachusetts.<br />
Hellmann I, Ebersberger I, Ptak SE, Paabo S, Przeworski M. 2003. A neutral explanation for the correlation<br />
of diversity with recombination rates in humans. Am. J. Hum. Genet. 72:1527–1535.<br />
Hochhut B, C Wil<strong>de</strong>, G Balling, B Mid<strong>de</strong>ndorf, U Dobrindt, E Brzuszkiewicz, G Gottschalk, E Carniel, J<br />
Hacker. 2006. Role of pathogenicity island-associated integrases in the genome plasticity of uropathogenic<br />
Escherichia coli strain 536. Mol Microbiol. 61(3):584-95.<br />
Inouye S, Sunshine MG, Six EW, Inouye M. 1991. Retronphage phi R73: an E. coli phage that contains a<br />
retroelement and integrates into a tRNA gene. Science. 1991 May 17;252(5008):969-71.<br />
Jaureguy F, L Landraud, V Passet, L Diancourt, E Frapy, G Guigon, E Carbonnelle, O Lortholary, O<br />
Clermont, E Denamur, B Picard, X Nassif, S Brisse. 2008. Phylogenetic and genomic diversity of human<br />
bacteremic Escherichia coli strains. BMC Genomics. 9: 560.<br />
Johnson JR, TA Russo. 2002. Extraintestinal pathogenic Escherichia coli: “The other bad E coli”. Journal of<br />
Laboratory and Clinical Medicine. 139(3):155-162.<br />
Johnson TJ, Wannemeuhler YM, Scaccianoce JA, Johnson SJ, Nolan LK. 2006b. Complete DNA sequence,<br />
comparative genomics, and prevalence of an IncHI2 plasmid occurring among extraintestinal pathogenic<br />
Escherichia coli isolates. Antimicrob Agents Chemother. 50(11):3929-33.<br />
Johnson TJ, Y Wannemuehle, SJ Johnson, AL Stell, C Doetkott, JR Johnson, KS Kim, L Spanjaard, LK<br />
Nolan. 2008. Comparison of extraintestinal pathogenic Escherichia coli strains from human and avian sources<br />
reveals a mixed subset representing potential zoonotic pathogens. Appl Environ Microbiol. 74(22):7043-50.<br />
Kaper JB, JP Nataro, HL Mobley. 2004. Pathogenic Escherichia coli. Nat. Rev. Microbiol. 2:123-40.<br />
Kelly JK. 1997. A test of neutrality based on interlocus associations. Genetics. 146:1197-1206.<br />
Kimura M. 1989. The neutral theory of molecular evolution and the world view of the neutralists. Genome.<br />
31(1):24-31.<br />
King MC, Wilson AC. 1975. Evolution at two levels in humans and chimpanzees. Science 188:107–116.<br />
Kuhnert P, P Boerlin, J Frey. 2000. Target genes for virulence assessment of Escherichia coli isolates from<br />
water, food and the environment. FEMS Microbiol. Rev. 24:107–117.50.
114<br />
716<br />
717<br />
718<br />
719<br />
720<br />
721<br />
722<br />
723<br />
724<br />
725<br />
726<br />
727<br />
728<br />
729<br />
730<br />
731<br />
732<br />
733<br />
734<br />
735<br />
736<br />
737<br />
738<br />
739<br />
740<br />
741<br />
742<br />
743<br />
744<br />
745<br />
746<br />
747<br />
Lawrence JG. 2001. Catalyzing bacterial speciation: correlating lateral transfer with genetic headroom. Syst.<br />
Biol. 50:479- 496.<br />
Le Gall T, Clermont O, Gouriou S, Picard B, Nassif X, Denamur E, Tenaillon O. 2007. Extraintestinal<br />
virulence is a coinci<strong>de</strong>ntal by-product of commensalism in B2 phylogenetic group Escherichia coli strains.<br />
Mol Biol Evol. 24(11):2373-84.<br />
Levin BR. 1981. Periodic selection, infectious gene exchange and the genetic structure of E. coli populations.<br />
Genetics. 99(1):1-23.<br />
Levin BR. 1996. The evolution and maintenance of virulence in microparasites. Emerg Infect Dis. 2:93–102.<br />
Luikart G, PR England, D Tallmon, S Jordan, P Taberlet. 2003. The power and promise of population<br />
genomics: from genotyping to genome typing. Nat Rev Genet. 4(12):981-94.<br />
Maslow JN, Whittam TS, Gilks CF, et al. 1995. Clonal relationships among bloodstream isolates of<br />
Escherichia coli. Infect Immun. 63: 2409-27.<br />
Mau B, JD Glasner, AE Darling, NT Perna. 2006. Genome-wi<strong>de</strong> <strong>de</strong>tection and analysis of homologous<br />
recombination among sequenced strains of Escherichia coli. Genome Biol. 7(5):R44.<br />
Maynard Smith J, NH Smith, M O’Rourke, BG Spratt. 1993. How clonal are bacteria Proc Natl. Acad. Sci.<br />
USA 90:4384–4388.<br />
Maynard-Smith J, CG Dowson, BG Spratt. 1991. Localized sex in bacteria. Nature. 349(6304):29-31.<br />
Mira A, L Klasson, SG An<strong>de</strong>rsson. 2002. Microbial genome evolution: sources of variability. Curr Opin<br />
Microbiol. 5(5):506-12.<br />
Mokady D, U Gophna, EZ Ron. 2005. Extensive gene diversity in septicemic Escherichia coli strains. J. Clin.<br />
Microbiol. 43:66–73.<br />
Mushegian AR, EV Koonin. 1996. A minimal gene set for cellular life <strong>de</strong>rived by comparison of complete<br />
bacterial genomes. Proc Natl Acad Sci U S A. 93(19):10268-73.<br />
Nandi T, Ong C, Singh AP, Bod<strong>de</strong>y J, Atkins T, Sarkar-Tyson M, Essex-Lopresti AE, Chua HH, Pearson T,<br />
Kreisberg JF, Nilsson C, Ariyaratne P, Ronning C, Losada L, Ruan Y, Sung WK, Woods D, Titball RW,<br />
Beacham I, Peak I, Keim P, Nierman WC, Tan P. 2010. A genomic survey of positive selection in<br />
Burkhol<strong>de</strong>ria pseudomallei provi<strong>de</strong>s insights into the evolution of acci<strong>de</strong>ntal virulence. PLoS Pathog.<br />
6(4):e1000845.<br />
Nataro JP, JB Kaper. 1998. Diarrheagenic Escherichia coli. Clin Microbiol Rev 11:142-201.<br />
Na<strong>de</strong>au, N.J., Jiggins, C.D. 2010. A gol<strong>de</strong>n age for evolutionary genetics Genomic studies of adaptation in<br />
natural populations. Trends Genet. 26, 484-492.
115<br />
748<br />
749<br />
750<br />
751<br />
752<br />
753<br />
754<br />
755<br />
756<br />
757<br />
758<br />
759<br />
760<br />
761<br />
762<br />
763<br />
764<br />
765<br />
766<br />
767<br />
768<br />
769<br />
770<br />
771<br />
772<br />
773<br />
774<br />
775<br />
776<br />
777<br />
778<br />
779<br />
780<br />
Ochman H, JG Lawrence, EA Groisman. 2000. Lateral gene transfer and the nature of bacterial innovation.<br />
Nature. 405(6784):299-304.<br />
Ochman H, NA Moran. 2001. Genes lost and genes found: the molecular evolution of bacterial pathogenesis<br />
and symbiosis. Science 292: 1096-1098.<br />
Orsi RH, Q Sun, M Wiedmann. 2008. Genome-wi<strong>de</strong> analyses reveal lineage specific contributions of positive<br />
selection and recombination to the evolution of Listeria monocytogenes. BMC Evol Biol. 8: 233.<br />
Pérez-Losada M, EB Browne, A Madsen, T Wirth, RP Viscidi, KA Crandall. 2006. Population genetics of<br />
microbial pathogens estimated from multilocus sequence typing (MLST) data. Infect Genet Evol. 6(2):97-<br />
112. Epub 2005 Mar 24.<br />
Perna NT, GF Mayhew, G Pósfai, S Elliott, MS Donnenberg, JB Kaper, FR Blattner. 1998. Molecular<br />
Evolution of a Pathogenicity Island from Enterohemorrhagic Escherichia coli O157:H7. Infect Immun. 1998<br />
August; 66(8): 3810–3817.<br />
Petersen L, Bollback JP, Dimmic M, Hubisz M, Nielsen R. 2007. Genes un<strong>de</strong>r positive selection in<br />
Escherichia coli. Genome Res 17: 1336-1343.<br />
Pupo GM, Lan R, Reeves PR. 2000. Multiple in<strong>de</strong>pen<strong>de</strong>nt origins of Shigella clones of Escherichia coli and<br />
convergent evolution of many of their characteristics. Proc Natl Acad Sci U S A. 97(19):10567-72.<br />
Rasko DA, Rosovitz MJ, Myers GS, Mongodin EF, Fricke WF, Gajer P, Crabtree J, Sebaihia M, Thomson<br />
NR, Chaudhuri R, Hen<strong>de</strong>rson IR, Sperandio V, Ravel J. 2008. The pangenome structure of Escherichia coli:<br />
comparative genomic analysis of E. coli commensal and pathogenic isolates. J Bacteriol. 190(20):6881-93.<br />
Resch AM, Carmel L, Marino-Ramirez L, Ogurtsov AY, Shabalina SA, et al. 2007. Wi<strong>de</strong>spread positive<br />
selection in synonymous sites of mammalian genes. Mol Biol Evol 24: 1821–18.<br />
Rodríguez-Valera F. 2002. Approaches to prokaryotic biodiversity: a population genetics perspective.<br />
Environ Microbiol. 4(11):628-33.<br />
Roos V, GC Ulett, MA Schembri, P Klemm. 2006. The asymptomatic bacteriuria Escherichia coli strain<br />
83972 outcompetes uropathogenic E. coli strains in human urine. Infect Immun. 74:615–624.<br />
Roselius K, Stephan W, Stadler T. 2005. The relationship of nucleoti<strong>de</strong> polymorphism, recombination rate<br />
and selection in wild tomato species. Genetics. 171:753-763.<br />
Roumagnac P, Weill FX, Dolecek C, Baker S, Brisse S, Chinh NT, Le TA, Acosta CJ, Farrar J, Dougan G,<br />
Achtman M. 2006. Evolutionary history of Salmonella typhi. Science. 314(5803):1301-4.<br />
Routman E, RD Miller, J Philips-Conroy, DL Hartl. 1985. Antibiotic resistance and population structure in<br />
Escherichia coli from free-ranging African yellow baboons. Appl. Envir. Microbiol. 50:749-754.<br />
Savageau MA. 1983. Escherichia coli habitats, cell types, and molecular mechanisms of gene control. Am Nat<br />
122:732–744.
116<br />
781<br />
782<br />
783<br />
784<br />
785<br />
786<br />
787<br />
788<br />
789<br />
790<br />
791<br />
792<br />
793<br />
794<br />
795<br />
796<br />
797<br />
798<br />
799<br />
800<br />
801<br />
802<br />
803<br />
804<br />
805<br />
806<br />
807<br />
808<br />
809<br />
810<br />
811<br />
812<br />
813<br />
Sawyer SA, Parsch J, Zhang Z, Hartl DL. 2007. Prevalence of positive selection among nearly neutral amino<br />
acid replacements in Drosophila. Proc Natl Acad Sci USA. 104:6504-6510.<br />
Selan<strong>de</strong>r RK, BR Levin. 1980. Genetic diversity and structure in Escherichia coli populations. Science<br />
210:545-547.<br />
Selan<strong>de</strong>r RK, Caugant DA, Ochman H, Musser JM, Gilmour MN, Whittam TS. 1986. Methods of multilocus<br />
enzyme electrophoresis for bacterial population genetics and systematics. Appl Environ Microbiol.<br />
51(5):873–884.<br />
Shapiro JA, Huang W, Zhang C, Hubisz MJ, Lu J, Turissini DA, Fang S, Wang HY, Hudson RR, Nielsen R,<br />
Chen Z, Wu CI. 2007. Adaptive genic evolution in the Drosophila genomes. Proc Natl Acad Sci U S A.<br />
104(7):2271-6.<br />
Skyberg JA, TJ Johnson, JR Johnson, C Clabots, CM Logue, LK Nolan. 2006. Acquisition of avian<br />
pathogenic Escherichia coli plasmids by a commensal E. coli isolate enhances its abilities to kill chicken<br />
embryos, grow in human urine, and colonize the murine kidney. Infection and Immunity. 74:6287-6292.<br />
Sokurenko EV, DL Hasty, DE Dykhuzien. 1999. Pathoadaptive mutations: gene loss and variation in bacterial<br />
pathogens. Trends Microbiol. 5:191–195.<br />
Sokurenko EV, HS Courtney, J Maslow, A Siitonen, DL Hasty. 1995. Quantitative differences in<br />
adhesiveness of type 1 fimbriated Escherichia coli due to structural differences in fimH genes. J. Bacteriol.<br />
177:3680–3686.<br />
Sokurenko EV, V Chesnokova, DE Dykhuzien, I Ofek, XR Wu, KA Krogfelt, C Struve, M A Schembri, DL<br />
Hasty. 1998. Pathogenic adaptation of Escherichia coli by natural variation of the FimH adhesin. Proc. Natl.<br />
Acad. Sci. USA 95:8922–8926.<br />
Souza V, Rocha M, Valera A, Eguiarte LE. 1999. Genetic structure of natural populations of Escherichia coli<br />
in wild hosts on different continents. Appl Environ Microbiol. 65(8):3373-85.<br />
Souza V, Rocha M, Valera A, Eguiarte LE. 1999. Genetic structure of natural populations of Escherichia coli<br />
in wild hosts on different continents. Appl Environ Microbiol. 65(8):3373-85.<br />
Stoebel DM. 2005. Lack of Evi<strong>de</strong>nce for Horizontal Transfer of the lac Operon into Escherichia coli. Mol<br />
Biol Evol. 22(3):683-690.<br />
Takuno S, Kado T, Sugino RP, Nakhleh L, Innan H. 2012. Population genomics in bacteria: a case study of<br />
Staphylococcus aureus. Mol. Biol. Evol. 29 (2): 797-809.<br />
Tenaillon O, Skurnik D, Picard B, Denamur E. 2010. The population genetics of commensal Escherichia coli.<br />
Nat Rev Microbiol. 8(3):207-17.<br />
Tettelin H, Masignani V, Cieslewicz MJ, Donati C, Medini D, Ward NL, Angiuoli SV, Crabtree J, Jones AL,<br />
Durkin AS, Deboy RT, Davidsen TM, Mora M, Scarselli M, Margarit y Ros I, Peterson JD, Hauser CR,
117<br />
814<br />
815<br />
816<br />
817<br />
818<br />
819<br />
820<br />
821<br />
822<br />
823<br />
824<br />
825<br />
826<br />
827<br />
828<br />
829<br />
830<br />
831<br />
832<br />
833<br />
834<br />
835<br />
836<br />
837<br />
838<br />
839<br />
840<br />
841<br />
842<br />
843<br />
844<br />
845<br />
846<br />
Sundaram JP, Nelson WC, Madupu R, Brinkac LM, Dodson RJ, Rosovitz MJ, Sullivan SA, Daugherty SC,<br />
Haft DH, Selengut J, Gwinn ML, Zhou L, Zafar N, Khouri H, Radune D, Dimitrov G, Watkins K, O'Connor<br />
KJ, Smith S, Utterback TR, White O, Rubens CE, Grandi G, Madoff LC, Kasper DL, Telford JL, Wessels<br />
MR, Rappuoli R, Fraser CM. 2005. Genome analysis of multiple pathogenic isolates of Streptococcus<br />
agalactiae: implications for the microbial "pan-genome". Proc Natl Acad Sci U S A. 102(39):13950-5.<br />
Erratum in: Proc Natl Acad Sci U S A. 2005 Nov 8;102(45):16530.<br />
Touchon M, Hoe<strong>de</strong> C, Tenaillon O, Barbe V, Baeriswyl S, Bi<strong>de</strong>t P, Bingen E, Bonacorsi S, Bouchier C,<br />
Bouvet O, Calteau A, Chiapello H, Clermont O, Cruveiller S, Danchin A, Diard M, Dossat C, Karoui ME,<br />
Frapy E, Garry L, Ghigo JM, Gilles AM, Johnson J, Le Bouguénec C, Lescat M, Mangenot S, Martinez-<br />
Jéhanne V, Matic I, Nassif X, Oztas S, Petit MA, Pichon C, Rouy Z, Ruf CS, Schnei<strong>de</strong>r D, Tourret J,<br />
Vacherie B, Vallenet D, Médigue C, Rocha EP, Denamur E. 2009. Organised genome dynamics in the<br />
Escherichia coli species results in highly diverse adaptive paths. PLoS Genet. 5(1):e1000344.<br />
Vilella AJ, Blanco-Garcia A, Hutter S, Rozas J. 2005. VariScan: Analysis of evolutionary patterns from largescale<br />
DNA sequence polymorphism data. Bioinformatics 21:2791-2793.<br />
Wattam AR, KP Williams, EE Sny<strong>de</strong>r, NF Almeida, M Shukla, AW Dickerman, OR Crasta, R Kenyon, J Lu,<br />
JM Shallom, H Yoo, TA Ficht, RM Tsolis, C Munk, R Tapia, CS Han, JC Detter, D Bruce, TS Brettin, BW<br />
Sobral, SM Boyle, JC Setubal.2009. Analysis of Ten Brucella Genomes Reveals Evi<strong>de</strong>nce for Horizontal<br />
Gene Transfer Despite a Preferred Intracellular Lifestyle. J Bacteriol. 2009 June; 191(11): 3569–3579.<br />
We<strong>de</strong>kind C, MO Gessner, F Vazquez, M Maerki, D Steiner. 2010. Elevated resource availability sufficient to<br />
turn opportunistic into virulent fish pathogens. Ecology 91(5):1251-6.<br />
Weissman SJ, Beskhlebnaya V, Chesnokova V, Chattopadhyay S, Stamm WE, Hooton TM, Sokurenko EV.<br />
2007. Differential stability and tra<strong>de</strong>-off effects of pathoadaptive mutations in the Escherichia coli FimH<br />
adhesin. Infect Immun. 75(7):3548-55. Erratum in: Infect Immun. 2009 Apr;77(4):1720.<br />
Welch RA, Burland V, Plunkett G 3rd, Redford P, Roesch P, Rasko D, Buckles EL, Liou SR, Boutin A,<br />
Hackett J, Stroud D, Mayhew GF, Rose DJ, Zhou S, Schwartz DC, Perna NT, Mobley HL, Donnenberg MS,<br />
Blattner FR. 2002. Extensive mosaic structure revealed by the complete genome sequence of uropathogenic<br />
Escherichia coli. Proc Natl Acad Sci U S A. 2002 Dec 24;99(26):17020-4.<br />
Whittam TS. 1989. Clonal dynamics of Escherichia coli in its natural habitat. Antonie Leeuwenhoek 55:23–<br />
32.<br />
Wiles TJ, Kulesus RR, Mulvey MA. 2008. Origins and virulence mechanisms of uropathogenic Escherichia<br />
coli. Exp Mol Pathol. 85(1):11-9.<br />
Wiles TJ, Kulesus RR, Mulvey MA. 2008. Origins and virulence mechanisms of uropathogenic Escherichia<br />
coli. Exp Mol Pathol. 85(1):11-9.
118<br />
847<br />
848<br />
849<br />
850<br />
851<br />
852<br />
853<br />
854<br />
855<br />
856<br />
857<br />
858<br />
Wirth T, Falush D, Lan R, Colles F, Mensa P, Wieler LH, Karch H, Reeves PR, Mai<strong>de</strong>n MC, Ochman H,<br />
Achtman M. 2006. Sex and virulence in Escherichia coli: an evolutionary perspective. Mol Microbiol.<br />
60(5):1136-51.<br />
Wooley RE, PS Gibbs, TP Brown, JR Glisson, WL Steffens, JJ Maurer. 1998. Colonisation of the chicken<br />
trachea by an avirulent avian Escherichia coli transformed with plasmid pHK11. Avian Diseases. 42:194-198.<br />
Wu XY, Chapman T, Trott DJ, Bettelheim K, Do TN, Driesen S, Walker MJ, Chin J. 2007. Comparative<br />
analysis of virulence genes, genetic diversity, and phylogeny of commensal and enterotoxigenic Escherichia<br />
coli isolates from weaned pigs. Appl Environ Microbiol. 73(1):83-91.<br />
Yan F, DB Polk. 2004. Commensal bacteria in the gut: learning who our friends are. Curr Opin Gastroenterol.<br />
20:565–571.<br />
Zhang Z, Schwartz S, Wagner L, Miller W. 2000. A greedy algorithm for aligning DNA sequences. J Comput<br />
Biol. 7(1-2):203-14.
119<br />
Información suplementaria<br />
2. Material y Métodos<br />
Alineación <strong>de</strong> los cromosomas <strong>de</strong> E. coli<br />
Una <strong>de</strong>ficiencia <strong>de</strong>l algoritmo <strong>de</strong> MAUVE 2.1.1, es que no siempre alinea<br />
correctamente las regiones <strong>de</strong>l genoma flexible (Darling et al. 2010). Esto ocurre <strong>de</strong>bido<br />
a que estas regiones están flanqueadas por regiones conservadas <strong>de</strong>l genoma, las cuales<br />
usualmente fungen como anclas par el alineamiento. Dado que el programa asume que<br />
todas las regiones entre dos anclas adyacentes son homólogas y por lo tanto las alinea,<br />
cuando las secuencias <strong>de</strong>l genoma flexible son diferentes entre subgrupos ó individuos<br />
<strong>de</strong> la muestra, el programa genera un alineamiento “forzado” entre secuencias nohomólogas<br />
(Darling et al. 2004).<br />
Para <strong>de</strong>tectar errores en el alineamiento, se realizó una revisión “a mano” <strong>de</strong><br />
cada sub-alineamiento, con ayuda <strong>de</strong>l programa BIOEDIT (Hall 1999) versión 7.0.5.<br />
Se registraron las coor<strong>de</strong>nadas <strong>de</strong> las regiones <strong>de</strong>l sub-alineamiento que parecían mal<br />
alineadas ó forzadas y se hizo un nuevo archivo <strong>de</strong> BIOEDIT para cada una <strong>de</strong> estas<br />
regiones, para trabajarlas por separado y evitar modificar las <strong>de</strong>más regiones bien<br />
alineadas.<br />
Para <strong>de</strong>terminar si las regiones estaban mal alineadas ó simplemente eran muy<br />
divergentes, se utilizó el algoritmo <strong>de</strong> BLASTn versión 2.2.14 (Altschul et al. 1990;<br />
Zhang et al. 2000). Si se obtenía una E ≤ 10-70 y una similitud <strong>de</strong>l 50% en al menos<br />
50% <strong>de</strong> la secuencia, se consi<strong>de</strong>raba que las secuencias eran homólogas y que el<br />
alineamiento era correcto (sensu Di<strong>de</strong>lot et al. 2009). Las regiones alineadas<br />
incorrectamente se realinearon por separado con el programa CLUSTALW (versión<br />
1.8.4) con los parámetros dados por omisión.<br />
Referencias:<br />
Altschul SF, Gish W, Miller W, Myers EW, Lipman DJ. 1990. Basic local alignment search tool. J. Mol.<br />
Biol. 215:403-410.<br />
Darling ACE, B Mau, FR Blattner, NT Perna. 2004. Mauve: Multiple Alignment of Conserved Genomic<br />
Sequence With Rearrangements. Genome Res. 14: 1394-1403.<br />
Di<strong>de</strong>lot X, A Darling, D Falush. 2009. Inferring genomic flux in bacteria. Genome Res. 19:306-317<br />
Hall TA. 1999. BioEdit: a user-friendly biological sequence alignment editor and analysis program for<br />
Windows 95/98/NT. Nucl. Acids. Symp. Ser. 41:95-98.
120<br />
Tabla 1. Genomas completos analizados en este estudio<br />
Hábitat<br />
Intestinal<br />
De vida<br />
libre<br />
Intestinal/<br />
Extraintestinal<br />
Intestinal<br />
Características<br />
ecológicas<br />
Comensal<br />
Adaptada al<br />
laboratorio<br />
Comensal<br />
silvestre<br />
No-patógena<br />
Patógena<br />
APEC<br />
Patógena<br />
ETEC<br />
Patógena<br />
EHEC<br />
Patógena<br />
EHEC<br />
Cepa/<br />
plásmido<br />
K12<br />
MG1655<br />
Grupo<br />
filogenético<br />
(<strong>de</strong><br />
acuerdo a<br />
Wirth et<br />
al. 2006)<br />
Serotipo<br />
Tamaño<br />
<strong>de</strong>l<br />
replicón<br />
(Mb)<br />
Contenido<br />
GC<br />
Número<br />
<strong>de</strong><br />
plásmidos<br />
Número <strong>de</strong><br />
acceso<br />
NCBI<br />
A N.E. O16 4.639675 50% - NC_000913<br />
K12 W3110 A N.E. O16 4.646332 50% - AC_000091<br />
K12<br />
ATCC8739<br />
A N.E. O16 4.746218 50% - NC_010468<br />
HS A O9 4.643538 50% - NC_009800<br />
D<br />
B2<br />
O19:H34<br />
O1:K1:H7<br />
- O139:H28<br />
- O157:H7<br />
- O157:H7<br />
5.068389<br />
0.130440<br />
<strong>0.0</strong>08909<br />
<strong>0.0</strong>04074<br />
<strong>0.0</strong>03565<br />
5.082025<br />
0.241387<br />
0.174241<br />
4.979619<br />
<strong>0.0</strong>79237<br />
<strong>0.0</strong>34367<br />
<strong>0.0</strong>70609<br />
<strong>0.0</strong>06199<br />
<strong>0.0</strong>74224<br />
<strong>0.0</strong>05033<br />
5.528445<br />
<strong>0.0</strong>92077<br />
5.498450<br />
<strong>0.0</strong>92721<br />
<strong>0.0</strong>03306<br />
50%<br />
50%<br />
46%<br />
49%<br />
43%<br />
50%<br />
46%<br />
49%<br />
50%<br />
47%<br />
51%<br />
50%<br />
52%<br />
49%<br />
49%<br />
50%<br />
47%<br />
50%<br />
47%<br />
43%<br />
4 NC_010498<br />
2 NC_008563<br />
6 NC_009801<br />
1 NC_002655<br />
2 NC_002695<br />
SMS-3-5<br />
pSMS35_130<br />
pSMS35_8<br />
pSMS35_4<br />
pSMS35_3<br />
APEC-O1<br />
pAPEC-O1-<br />
R<br />
pAPEC-O1-<br />
ColBM<br />
E24377A<br />
pETEC_80<br />
pETEC_35<br />
pETEC_73<br />
pETEC_6<br />
pETEC_74<br />
pETEC_5<br />
EDL933<br />
pO157<br />
Sakai<br />
pO157<br />
pOSAK1<br />
Patógena,<br />
UTI 536 B2 O6:K15:H31 4.938920 50% - NC_008253<br />
UPEC<br />
Extraintestinal<br />
UTI CFT073 B2 O6:K2:H1<br />
50% - NC_004431<br />
Patógena,<br />
UPEC<br />
5.231428<br />
Patógena UTI89<br />
5.065741 50%<br />
B2<br />
O18:K1:H7<br />
UPEC<br />
pUTI89<br />
0.114230 51%<br />
1 NC_007946<br />
N.E. No expresado (Stevenson y col. 1994).<br />
Referencia<br />
Blattner y<br />
col. 1997<br />
Hayashi y<br />
col. 2006<br />
Joint<br />
Genome<br />
Institute<br />
2008<br />
Rasko y<br />
col. 2008<br />
Fricke y<br />
col. 2008<br />
Johnson y<br />
col. 2007<br />
Rasko y<br />
col. 2008<br />
Perna y<br />
col. 2001<br />
Hayashi y<br />
col. 2001<br />
Hochhut y<br />
col. 2006<br />
Welch y<br />
col. 2002<br />
Chen y col.<br />
2006
121<br />
Tabla 2. Número mínimo <strong>de</strong> rearreglos cromosómicos <strong>de</strong>tectados por el programa MAUVE<br />
entre pares <strong>de</strong> los 12 cromosomas <strong>de</strong> E. coli analizados.<br />
Cepa 1 2 3 4 5 6 7 8 9 10 11 12<br />
1 k12 MG1655 0 - - - - - - - - - - -<br />
2 k12 W3110 1* 0 - - - - - - - - - -<br />
3 k12 8739ATCC 4* 4* 0 - - - - - - - - -<br />
4 HS 3 1 4 0 - - - - - - - -<br />
5 SMS-3-5 1 2 4 2 0 - - - - - - -<br />
6 APEC-O1 3 4 7 2 4 0 - - - - - -<br />
7 ETEC E24377A 1 2 5 2 2 2 0 - - - - -<br />
8 O157 EDL933 4 4 8 5 5 4 3 0 - - - -<br />
9 O157 Sakai 3 3 7 4 4 3 2 1* 0 - - -<br />
10 UTI 536 4 5 7 3 6 1 3 4 3 0 - -<br />
11 UTI CFT073 3 5 7 3 6 1 3 4 3 0 0 -<br />
12 UTI 89 5 6 9 4 5 1 3 4 3 2 2 0<br />
*Rearreglos entre cepas distintas <strong>de</strong> la misma clona<br />
Las celdas sombreadas correspon<strong>de</strong>n al número <strong>de</strong> eventos <strong>de</strong> recombinación entre individuos <strong>de</strong>l<br />
mismo eco-grupo.
122<br />
Tabla 3. Diversidad, pruebas <strong>de</strong> selección natural y <strong>de</strong>sequilibrio <strong>de</strong> ligamiento en los<br />
componentes <strong>de</strong>l pangenoma <strong>de</strong>l cromosoma <strong>de</strong> E. coli, en los dos ecogrupos y en la<br />
muestra total.<br />
Componente <strong>de</strong>l pangenoma<br />
Genoma flexible<br />
Ecogrupo Parámetro Genoma central<br />
(compartido por el ecogrupo)<br />
Nopatógenas<br />
Patógenas<br />
TOTAL<br />
N 1 4,122 543<br />
2<br />
N P 4,058 477<br />
N DL<br />
3<br />
2,628 231<br />
π 1 <strong>0.0</strong>148857 <strong>0.0</strong>251052<br />
θ 1 <strong>0.0</strong>157071 <strong>0.0</strong>264413<br />
D <strong>de</strong> Tajima 2 -0.454711** -0.467283**<br />
D* <strong>de</strong> Fu-Li 2 -0.498445** -0.5052**<br />
F* <strong>de</strong> Fu-Li 2 -0.522249** -0.523444**<br />
Hd 3 0.7501213 0.6338858<br />
Zns 3 0.7282182* 0.7732863*<br />
N 4,122 254<br />
N P 4,085 219<br />
N DL 3,992 177<br />
π 1 <strong>0.0</strong>208802 <strong>0.0</strong>444992<br />
θ 1 <strong>0.0</strong>184001 <strong>0.0</strong>388579<br />
D <strong>de</strong> Tajima 2 0.7365571** 0.6695001**<br />
D* <strong>de</strong> Fu-Li 2 0.5570546** 0.4874307**<br />
F* <strong>de</strong> Fu-Li 2 0.6593397** 0.5790057**<br />
Hd 3 0.8732007 0.6882265<br />
Zns 3 0.6347493* 0.6694768*<br />
N 4,122 -<br />
N P 4,096 -<br />
N DL 4,037 -<br />
π 1 <strong>0.0</strong>217819 -<br />
θ 1 <strong>0.0</strong>195899 -<br />
D <strong>de</strong> Tajima 2 0.4484568** -<br />
D* <strong>de</strong> Fu-Li 2 0.3270199** -<br />
F* <strong>de</strong> Fu-Li 2 0.4089824** -<br />
Hd 3 0.9079772 -<br />
Zns 3 0.3642279*<br />
1, 2, 3<br />
Promedio. Estimado sobre 1 número <strong>de</strong> loci <strong>de</strong>l genoma central (N), 2 número <strong>de</strong> loci polimórficos (N P )<br />
y 3 número <strong>de</strong> loci con sitios informativos para la prueba Zns (N DL ), <strong>de</strong> cada LCB.<br />
* loci significativos positivos en la prueba <strong>de</strong> neutralidad; * loci significativos negativos en la prueba <strong>de</strong><br />
neutralidad; * loci significativos en la prueba <strong>de</strong> <strong>de</strong>sequilibrio <strong>de</strong> ligamiento Zns.
Figura 1. Alineamiento múltiple <strong>de</strong>l cromosoma <strong>de</strong> E. coli. Cada renglón correspon<strong>de</strong> a la secuencia<br />
cromosómica <strong>de</strong> un individuo. En la parte superior <strong>de</strong>l renglón se indican las coor<strong>de</strong>nadas <strong>de</strong>l cromosoma,<br />
don<strong>de</strong> el 1 correspon<strong>de</strong> al inicio <strong>de</strong>l reloj cromosomal (0’). Cada LCB esta representado por un color<br />
diferente. Los LCBs homólogos están conectados entre individuos por una línea <strong>de</strong> su mismo color. Las<br />
regiones sin color <strong>de</strong>ntro y entre LCBs representan regiones que son parte <strong>de</strong>l genoma flexible. La altura <strong>de</strong><br />
las barras <strong>de</strong> color al interior <strong>de</strong> los LCBs es proporcional a la similitud <strong>de</strong> secuencia promedio <strong>de</strong> la región.<br />
oriC – posición <strong>de</strong>l origen <strong>de</strong> replicación; Ter – posición <strong>de</strong>l término <strong>de</strong> replicación.<br />
123
Figura 2. Proporción <strong>de</strong> loci significativos* en las pruebas <strong>de</strong> A) D <strong>de</strong> Tajima, B) D* <strong>de</strong> Fu-Li, C) F* <strong>de</strong> Fu-Li y D)<br />
<strong>de</strong>sequilibrio <strong>de</strong> ligamiento Zns, en los diferentes ecogrupos <strong>de</strong> E. coli.<br />
* Significativos a p
125<br />
a)<br />
b)<br />
c)<br />
Figura S1 a) Distribución <strong>de</strong> regiones <strong>de</strong>l genoma central y <strong>de</strong>l genoma flexible en el alineamiento<br />
consenso <strong>de</strong> cromosoma <strong>de</strong> E. coli. Los LCBs se or<strong>de</strong>naron <strong>de</strong> acuerdo al cromosoma <strong>de</strong> la cepa K12<br />
MG1655. Los colores que representan cada LCB son los mismos que asignó el programa MAUVE, como<br />
se ve en la Figura 3. Adicionalmente asignamos un número a cada LCB, el cual se indica en el interior<br />
<strong>de</strong>l círculo cromosomal, comenzando por el LCB ver<strong>de</strong> oscuro, don<strong>de</strong> se encuentra el origen <strong>de</strong><br />
replicación oriC. b) Proporción <strong>de</strong> sitios <strong>de</strong>l alineamiento correspondientes al genoma central y al<br />
genoma flexible compartido por los individuos <strong>de</strong> un mismo ecogrupo. c) Proporción <strong>de</strong> sitios <strong>de</strong>l<br />
alineamiento correspondientes al genoma flexible, relativa al número <strong>de</strong> sitios analizados en cada<br />
ecogrupo.
126<br />
Figura S2. Proporción <strong>de</strong> genes con evi<strong>de</strong>ncia <strong>de</strong> selección positiva y selección negativa en el genoma<br />
central <strong>de</strong> la muestra total <strong>de</strong> E. coli, <strong>de</strong>ntro <strong>de</strong> las diferentes categorías funcionales. Se incluyeron genes<br />
presentes en loci que fueran significativos (a p
127<br />
Figura S3 A. Proporción <strong>de</strong> genes con evi<strong>de</strong>ncia <strong>de</strong> selección positiva y selección negativa <strong>de</strong>ntro <strong>de</strong> las<br />
diferentes categorías funcionales, en el ecogrupo <strong>de</strong> E. coli no-patógenas, A. en el genoma central y B. en<br />
el genoma flexible. Se incluyeron genes que tuvieran evi<strong>de</strong>ncia <strong>de</strong> selección (significativos a p
128<br />
B.<br />
Figura S3B. Continuación.
129<br />
A.<br />
Figura S4 A. Proporción <strong>de</strong> genes con evi<strong>de</strong>ncia <strong>de</strong> selección positiva y selección negativa <strong>de</strong>ntro <strong>de</strong> las<br />
diferentes categorías funcionales, en el ecogrupo <strong>de</strong> E. coli patógenas, A. en el genoma central y B. en el<br />
genoma flexible. Se incluyeron genes que tuvieran evi<strong>de</strong>ncia <strong>de</strong> selección (significativos a p
130<br />
B.<br />
Figura S4 B. Continuación.
131<br />
Tabla S1. Tamaño <strong>de</strong> los 21 bloques localmente colineares (LCBs) i<strong>de</strong>ntificados en E. coli, y proporción <strong>de</strong> los componentes <strong>de</strong>l pangenoma, genoma central y genoma<br />
flexible, en cadauno <strong>de</strong> ellos.<br />
El porcentaje es relativo al total <strong>de</strong> sitios <strong>de</strong>l alineamiento final (11, 505,324 sitios). oriC - origen <strong>de</strong> replicación; 0’ - inicio <strong>de</strong>l reloj cromosomal; Ter - término <strong>de</strong><br />
replicación.
132<br />
Tabla S2. Matriz <strong>de</strong> i<strong>de</strong>ntidad nucleotídica <strong>de</strong> las regiones <strong>de</strong>l genoma central <strong>de</strong> los 12 cromosomas <strong>de</strong> E. coli.<br />
Cepa 1 2 3 4 5 6 7 8 9 10 11 12<br />
1 k12 MG1655<br />
2 k12 W3110<br />
3 k12 8739ATCC<br />
4 HS<br />
5 SMS-3-5<br />
6 APEC-O1<br />
7 ETEC E24377A<br />
8 O157 EDL933<br />
9 O157 Sakai<br />
10 UTI 536<br />
11 UTI CFT073<br />
12 UTI 89<br />
1.00 - - - - - - - - - - -<br />
0.999 1.00 - - - - - - - - - -<br />
0.992 0.992 1.00 - - - - - - - - -<br />
0.99 0.99 0.993 1.00 - - - - - - - -<br />
0.976 0.976 0.976 0.975 1.00 - - - - - - -<br />
0.973 0.973 0.973 0.973 0.976 1.00 - - - - - -<br />
0.987 0.987 0.987 0.988 0.976 0.973 1.00 - - - - -<br />
0.983 0.983 0.983 0.982 0.975 0.972 0.982 1.00 - - - -<br />
0.983 0.983 0.983 0.982 0.975 0.972 0.982 0.999 1.00 - - -<br />
0.973 0.973 0.973 0.973 0.977 0.991 0.973 0.972 0.972 1.00 - -<br />
0.973 0.973 0.973 0.973 0.976 0.991 0.973 0.972 0.972 0.991 1.00 -<br />
0.973 0.973 0.973 0.973 0.976 0.999 0.973 0.972 0.972 0.991 0.992 1.00
133<br />
Tabla S3. Diversidad, pruebas <strong>de</strong> selección natural y <strong>de</strong>sequilibrio <strong>de</strong> ligamiento en el genoma central <strong>de</strong> losbloques localmente colineares (LCBs) <strong>de</strong>l cromosoma <strong>de</strong> E. coli,<br />
en los dos ecogrupos y en la muestra total.<br />
Ecogrupo<br />
Bloques Localmente Colineares (LCBs)<br />
Parámetro 1 abc 2 3 abc 4 5 6 bc 7 abc 8 abc 9 abc 10 11 abc 12 abc 13 abc 14 15 bc 16 bc 17 abc 18 19 abc 20 bc 21 abc<br />
π 1 <strong>0.0</strong>136 0.1282 <strong>0.0</strong>148 <strong>0.0</strong>088 <strong>0.0</strong>076 <strong>0.0</strong>107 <strong>0.0</strong>193 <strong>0.0</strong>182 <strong>0.0</strong>157 <strong>0.0</strong>190 <strong>0.0</strong>108 <strong>0.0</strong>147 <strong>0.0</strong>127 <strong>0.0</strong>056 <strong>0.0</strong>131 <strong>0.0</strong>121 <strong>0.0</strong>202 <strong>0.0</strong>126 <strong>0.0</strong>134 <strong>0.0</strong>107 <strong>0.0</strong>171<br />
θ 1 <strong>0.0</strong>143 0.1026 <strong>0.0</strong>164 <strong>0.0</strong>080 <strong>0.0</strong>079 <strong>0.0</strong>108 <strong>0.0</strong>196 <strong>0.0</strong>190 <strong>0.0</strong>164 <strong>0.0</strong>214 <strong>0.0</strong>117 <strong>0.0</strong>161 <strong>0.0</strong>132 <strong>0.0</strong>067 <strong>0.0</strong>126 <strong>0.0</strong>127 <strong>0.0</strong>216 <strong>0.0</strong>152 <strong>0.0</strong>144 <strong>0.0</strong>127 <strong>0.0</strong>178<br />
No-patógenas<br />
Patógenas<br />
TOTAL<br />
Hd 1 0.7602 0.7000 0.6833 0.9000 0.7167 0.8325 0.8494 0.8077 0.7615 0.6000 0.6976 0.7466 0.7601 0.4000 0.8833 0.8600 0.7508 0.4000 0.7285 0.4722 0.7260<br />
Zns 2 0.7367* 0.9893* 0.7776* 0.5640 0.7941* 0.6994* 0.6641* 0.7272* 0.7505* - 0.7291* 0.7086* 0.7245* - 0.8147* 0.8576* 0.7230* - 0.7506* 0.4468 0.7256*<br />
D <strong>de</strong> Tajima 3 -0.4327* 1.8218* -0.645* 0.3854 -0.1688 -0.2927* -0.1474* -0.3295 -0.4202** -0.6116 -0.5287** -0.5555* -0.437* -0.9726 0.283 -0.2483 -0.5* -1.0711 -0.5527** -0.8918 -0.4783**<br />
D* <strong>de</strong> Fu-Li 3 -0.4597* 1.7346* -0.6724* 0.3854* -0.1688 -0.3927** -0.2203** -0.4079* -0.4671** -0.6116 -0.5566* -0.5846* -0.4779** -0.9726 0.283 -0.2483 -0.5527* -1.0711 -0.5885** -0.9296* -0.5213**<br />
F* <strong>de</strong> Fu-Li 3 -0.4841* 1.8661* -0.7125* 0.3947 -0.195 -0.3941* -0.2207** -0.4202* -0.4904** -0.6136 -0.586* -0.6175* -0.5005** -0.9544 0.2896 -0.2621 -0.579* -1.0826 -0.6195** -0.9552* -0.5462**<br />
π 1 <strong>0.0</strong>183 0.1260 <strong>0.0</strong>226 <strong>0.0</strong>122 <strong>0.0</strong>143 <strong>0.0</strong>135 <strong>0.0</strong>234 <strong>0.0</strong>204 <strong>0.0</strong>226 <strong>0.0</strong>462 <strong>0.0</strong>178 <strong>0.0</strong>227 <strong>0.0</strong>165 <strong>0.0</strong>073 <strong>0.0</strong>262 <strong>0.0</strong>162 <strong>0.0</strong>304 <strong>0.0</strong>332 <strong>0.0</strong>207 <strong>0.0</strong>164 <strong>0.0</strong>214<br />
θ 1 <strong>0.0</strong>163 <strong>0.0</strong>907 <strong>0.0</strong>198 <strong>0.0</strong>113 <strong>0.0</strong>135 <strong>0.0</strong>122 <strong>0.0</strong>204 <strong>0.0</strong>183 <strong>0.0</strong>198 <strong>0.0</strong>519 <strong>0.0</strong>156 <strong>0.0</strong>198 <strong>0.0</strong>146 <strong>0.0</strong>057 <strong>0.0</strong>223 <strong>0.0</strong>141 <strong>0.0</strong>269 <strong>0.0</strong>460 <strong>0.0</strong>184 <strong>0.0</strong>128 <strong>0.0</strong>187<br />
Hd 1 0.8748 0.6905 0.8800 0.8980 0.7302 0.8274 0.8735 0.8695 0.8758 0.9048 0.8656 0.8793 0.8869 0.8095 0.8056 0.8476 0.8813 0.7857 0.8784 0.7513 0.8637<br />
Zns 2 0.6214* 1* 0.6366* 0.5485* 0.5619* 0.5456* 0.6374* 0.6370* 0.6304* 0.5819 0.6514* 0.6569* 0.6228* 0.5333 0.7615* 0.6731 0.5968* 0.16 0.6302* 0.6864* 0.6522*<br />
D <strong>de</strong> Tajima 3 0.6959* 2.1622* 0.8278* 0.4304* <strong>0.0</strong>101 0.5584* 0.7677* 0.6807* 0.7388* -0.4867* 0.7305** 0.795** 0.7337* 1.1684 0.9284 0.8914 0.6532* -1.5262* 0.7138** 0.8953* 0.8323**<br />
D* <strong>de</strong> Fu-Li 3 0.5551 1.5549 0.6087 <strong>0.0</strong>69 -0.2678 0.3898 0.5685* 0.5012* 0.5769 -0.6396* 0.5466* 0.6035* 0.5715 1.1781 0.6834 0.5609 0.5132 -1.5916* 0.5282* 0.6283 0.6526*<br />
F* <strong>de</strong> Fu-Li 3 0.6482 1.8623 0.7258 0.1642 -0.2237 0.4726 0.6766 0.5977* 0.6769 -0.6661* 0.648* 0.7134* 0.6715 1.2596 0.8151 0.7007 0.6016 -1.7311* 0.6291* 0.7534 0.7653*<br />
π 1 <strong>0.0</strong>194 0.1211 <strong>0.0</strong>242 <strong>0.0</strong>112 <strong>0.0</strong>138 <strong>0.0</strong>140 <strong>0.0</strong>245 <strong>0.0</strong>222 <strong>0.0</strong>235 <strong>0.0</strong>698 <strong>0.0</strong>179 <strong>0.0</strong>235 <strong>0.0</strong>176 <strong>0.0</strong>078 <strong>0.0</strong>263 <strong>0.0</strong>174 <strong>0.0</strong>309 <strong>0.0</strong>591 <strong>0.0</strong>211 <strong>0.0</strong>155 <strong>0.0</strong>234<br />
θ 1 <strong>0.0</strong>173 <strong>0.0</strong>753 <strong>0.0</strong>212 <strong>0.0</strong>104 <strong>0.0</strong>133 <strong>0.0</strong>130 <strong>0.0</strong>219 <strong>0.0</strong>205 <strong>0.0</strong>207 <strong>0.0</strong>526 <strong>0.0</strong>162 <strong>0.0</strong>210 <strong>0.0</strong>164 <strong>0.0</strong>092 <strong>0.0</strong>215 <strong>0.0</strong>143 <strong>0.0</strong>287 <strong>0.0</strong>373 <strong>0.0</strong>190 <strong>0.0</strong>124 <strong>0.0</strong>210<br />
Hd 1 0.9129 0.7879 0.9088 0.9221 0.7652 0.9030 0.9233 0.9078 0.9145 0.9091 0.8944 0.9124 0.9186 0.7879 0.9053 0.9182 0.9155 0.7803 0.9085 0.7534 0.8979<br />
Zns 2 0.3538* 0.9114* 0.3720* 0.3228 0.3022 0.3670* 0.3482* 0.3477* 0.3581* 0.4974 0.3701* 0.3755* 0.3519* 0.1 0.4031 0.3434 0.3493* 0.8386* 0.3670* 0.4646* 0.3891*<br />
D <strong>de</strong> Tajima 3 0.6069* 2.6428* 0.6768** 0.9278* 1.2632* 0.6813 0.625** 0.598** 0.5983* 1.3515 0.5378** 0.5549** 0.5006** 0.5399 0.9263 0.9362* 0.5721* 2.4716* 0.5919** 0.7314* 0.6936*<br />
D* <strong>de</strong> Fu-Li 3 0.5841** 1.3821* 0.6013** 0.8401* 1.1599* 0.6843* 0.5826** 0.5993** 0.5364* 0.7204 0.5287* 0.4983** 0.4778** 0.4589 0.8389 0.8164 0.5743* 1.214* 0.5378** 0.6795* 0.6149*<br />
F* <strong>de</strong> Fu-Li 3 0.6565* 1.9471* 0.6914** 0.9784* 1.3521* 0.7604* 0.6661** 0.6708** 0.6173* 1.0032 0.5872* 0.571** 0.5349** 0.5425 0.9815 0.9653* 0.647* 1.7505* 0.6156** 0.772 0.7104**
134<br />
1,2,3 Promedio estimado sobre 1 número <strong>de</strong> loci <strong>de</strong>l genoma central (N), 2 número <strong>de</strong> loci con sitios informativos para la pruea ZnS (N DL ) y 3<br />
número <strong>de</strong> loci polimórficos (N P ), <strong>de</strong> cada LCB.<br />
a, b, c En estos LCBs los ecogrupos son significativamente diferentes en a diversidad genética π y θ (excepto el LCB 3, que no fue distinto en el<br />
parámetro θ), b en los valores <strong>de</strong> D <strong>de</strong> Tarima, D* y F* <strong>de</strong> Fu-Li y c en diversidad Hd y en los valores <strong>de</strong> <strong>de</strong>sequilibrio <strong>de</strong> ligamiento Zns (p <strong>de</strong><br />
Wilcoxon).<br />
- LCBs en los que no se estimó la prueba Zns por falta <strong>de</strong> sitios informativos.<br />
Presencia <strong>de</strong> loci significativos *positivos ó negativos en la prueba <strong>de</strong> neutralidad; * loci significativos en la prueba <strong>de</strong> <strong>de</strong>sequilibrio <strong>de</strong><br />
ligamiento Zns.
135<br />
7. Discusión y conclusiones<br />
Los trabajos seminales <strong>de</strong> genética <strong>de</strong> poblaciones realizados para E. coli se realizaron<br />
utilizando principalmente aislados patogénicos, por razones obvias para el humano,<br />
aunque posteriormente se utilizaron aislados “naturales” (Caugant et al., 1981; Selan<strong>de</strong>r<br />
et al., 1987). Debido a estos trabajos, durante mucho tiempo se asumió que E. coli era<br />
una especie clonal y que evolucionaba por eventos <strong>de</strong> selección periódica cada que un<br />
alelo benéfico confería <strong>mayo</strong>r a<strong>de</strong>cuación a la especie (Levin, 1981). Sin embargo, esta<br />
conclusión <strong>de</strong> clonalidad fue obtenida utilizando la técnica <strong>de</strong> electroforesis <strong>de</strong> enzimas<br />
multilocus (MLEE: Multi Locus Enzyme Electrophoresis), la cual a pesar <strong>de</strong> arrojar<br />
ciertos niveles <strong>de</strong> diversidad genética no es el marcador molecular apropiado para<br />
explorar con precisión, la presencia <strong>de</strong> la recombinación homóloga. Esto <strong>de</strong>bido a que la<br />
técnica MLEE analiza el fenotipo <strong>de</strong> los genes bajos estudio y los algoritmos utilizados<br />
para analizar este tipo <strong>de</strong> información como es el Índice <strong>de</strong> asociación (Haubold y<br />
Hudson, 2000) subestiman los niveles <strong>de</strong> recombinación que se dan en las poblaciones<br />
(Maynard-Smith et al., 1993).<br />
Al mismo tiempo se fue extendiendo el estudio <strong>de</strong> genética <strong>de</strong> poblaciones a<br />
otras especies bacterianas principalmente patógenas. Debido a que generalmente los<br />
aislados patogénicos correspon<strong>de</strong>n a clonas epidémicas con serotipos <strong>de</strong>finidos y <strong>de</strong><br />
origen reciente, una sobre representación <strong>de</strong> <strong>de</strong>terminados genotipos en las poblaciones<br />
fue <strong>de</strong>tectado y esto, aunado al hecho <strong>de</strong> que las bacterias se divi<strong>de</strong>n por fisión binaria,<br />
alimentó la i<strong>de</strong>a <strong>de</strong> que las especies bacterianas eran clonales. Este supuesto comienza a<br />
per<strong>de</strong>r fuerza en la medida en la que comienzan a aparecer las secuencias <strong>de</strong> ADN <strong>de</strong><br />
ciertos genes utilizados en los estudios <strong>de</strong> MLEE, al igual que el <strong>de</strong>sarrollo <strong>de</strong><br />
algoritmos matemáticos para interpretar esta información. Es así, que se <strong>de</strong>muestra que<br />
no todas las especies bacterianas patógenas, a pesar <strong>de</strong> compartir un mismo estilo <strong>de</strong><br />
vida, presentan el mismo tipo <strong>de</strong> estructura poblacional ni niveles <strong>de</strong> recombinación<br />
(Figura 8 ) (Spratt et al., 2001; Pérez-Losada et al., 2006; Vos y Di<strong>de</strong>lot 2009). Esta<br />
variación se <strong>de</strong>be a que tanto las especies patógenas obligadas como oportunistas y<br />
comensales como es el caso <strong>de</strong> E. coli, presentan una amplia gama <strong>de</strong> especies<br />
hospe<strong>de</strong>ras, rangos <strong>de</strong> hospe<strong>de</strong>ros, virulencia, sitios <strong>de</strong> infección, mecanismos <strong>de</strong><br />
evasión al sistema inmune así como <strong>de</strong> transmisión <strong>de</strong> hospe<strong>de</strong>ro a hospe<strong>de</strong>ro. Sin<br />
embargo, los patógenos obligados son los más clonales en comparación <strong>de</strong> los
136<br />
oportunistas, comensales y bacterias <strong>de</strong> vida libre los cuales presentan un espectro<br />
amplio <strong>de</strong> tasas <strong>de</strong> recombinación y mutación (Figura 9). Cabe señalar, que altos<br />
niveles <strong>de</strong> clonalidad no implica necesariamente una estasis evolutiva total ya que<br />
pue<strong>de</strong>n existir en las poblaciones, genotipos mutadores (Tad<strong>de</strong>i et al., 1997) así como<br />
una variación histórica en las tasas <strong>de</strong> mutación (Cui et al., 2013) lo cual genera<br />
diversidad disponible para que se <strong>de</strong> el cambio evolutivo. Esto nos sugiere que la<br />
evolución <strong>de</strong> la patogénesis en diferentes especies bacterianas pue<strong>de</strong> presentar<br />
diferentes procesos <strong>de</strong> adaptación y diversificación. Por lo tanto, en esta <strong>tesis</strong> consi<strong>de</strong>ro<br />
a la patogénesis como una efectiva (aunque <strong>de</strong>safortunada para otros) estrategia más <strong>de</strong><br />
supervivencia por parte <strong>de</strong> las bacterias, al igual que el comensalismo o la simbiosis. De<br />
esta manera, estudiar a una especie que presente diferentes estilos <strong>de</strong> vida así como una<br />
versatilidad en los nichos ecológicos en los que habita, arrojará información más amplia<br />
concerniente a los procesos y mecanismos que promueven la diversificación <strong>de</strong> los<br />
linajes bacterianos.<br />
Tomando en cuenta lo anterior, el objetivo <strong>de</strong> este trabajo fue <strong>de</strong>scribir los<br />
diferentes mecanismos genéticos y procesos evolutivos que promueven la<br />
diversificación y diferenciación genética <strong>de</strong> E. coli en términos <strong>de</strong> la historia<br />
filogenética y versatilidad ecológica <strong>de</strong> esta especie.<br />
7.1 Los niveles <strong>de</strong> diversidad genética <strong>de</strong>l genoma central <strong>de</strong> Escherichia coli son<br />
producto principalmente <strong>de</strong> la recombinación.<br />
El análisis <strong>de</strong> genética <strong>de</strong> poblaciones realizado en este estudio utilizando siete genes<br />
constitutivos sugiere que en promedio, la recombinación homóloga tiene más impacto<br />
que la mutación puntual en la diversificación genética <strong>de</strong> toda la muestra <strong>de</strong> E. coli<br />
(Capítulo 4). Lo mismo encontramos cuando analizamos el genoma central completo <strong>de</strong><br />
12 aislados <strong>de</strong> E. coli si consi<strong>de</strong>ramos los altos niveles <strong>de</strong> diversidad nucleotídica,<br />
rearreglos cromosómicos y regiones bajo equilibrio <strong>de</strong> ligamiento encontrados (Capítulo<br />
6).
137<br />
Figura 7. Impacto <strong>de</strong> la recombinación homóloga en la estructura poblacional bacteriana<br />
En una población bacteriana en don<strong>de</strong> la recombinación es prácticamente inexistente, la<br />
diversificación <strong>de</strong> las clonas es lenta ya que <strong>de</strong>pen<strong>de</strong> completamente <strong>de</strong> la acumulación <strong>de</strong><br />
mutaciones puntuales. Asimismo, existen niveles <strong>de</strong> <strong>de</strong>sequilibrio <strong>de</strong> ligamiento altos y la<br />
población es altamente clonal consistiendo en linajes que evolucionan in<strong>de</strong>pendientemente. En<br />
tanto aumenta la contribución <strong>de</strong> la recombinación en el cambio evolutivo <strong>de</strong> los loci neutrales,<br />
las clonas comienzan a ser transitorias hasta que las altas tasas <strong>de</strong> recombinación con respecto a<br />
las <strong>de</strong> mutación evitan la emergencia <strong>de</strong> clonas <strong>de</strong>bido a que los genomas diversifican muy<br />
rápido. No obstante, pue<strong>de</strong> existir <strong>de</strong>sequilibrio <strong>de</strong> ligamiento significativo en clonas o<br />
complejos clonales aún cuando la recombinación es <strong>mayo</strong>r que la mutación puntual (Figura<br />
modificada <strong>de</strong> Spratt et al., 2001 y complementada con información <strong>de</strong> Achtman et al., 1999;<br />
González-González et al., 2013; Vos y Di<strong>de</strong>lot, 2009 para Y. pestis, E. coli y H. pylori<br />
respectivamente).<br />
A pesar <strong>de</strong> los niveles <strong>de</strong> recombinación encontrados, el análisis <strong>de</strong><br />
reconstrucción filogenética realizado en esta <strong>tesis</strong> y en otros trabajos don<strong>de</strong> se han<br />
estudiado diferentes tipos <strong>de</strong> muestras así como diversos marcadores moleculares<br />
(Wirth et al., 2006; Walk et al., 2007; Jaureguy et al., 2008; Okeke et al., 2010;<br />
Bergholz et al., 2011), recupera los mismos grupos filogenéticos que se <strong>de</strong>scribieron<br />
utilizando isoenzimas en un principio (Selan<strong>de</strong>r et al., 1986, Goullet y Picard, 1989).<br />
Esta aparente incongruencia también llamada paradigma clonal, ha sido previamente<br />
estudiada utilizando un enfoque filogenético utilizando la información proveniente <strong>de</strong><br />
20 genomas completos (Touchon et al, 2009). Lo que sugiero en este estudio es que la<br />
estructura clonal <strong>de</strong> E. coli se mantiene a pesar <strong>de</strong> los niveles <strong>de</strong> recombinación<br />
homóloga presentes <strong>de</strong>bido a que la recombinación se lleva a cabo mediante el<br />
intercambio <strong>de</strong> pequeños fragmentos <strong>de</strong> ADN entre los diferentes genomas.
138<br />
70<br />
65<br />
60<br />
55<br />
50<br />
45<br />
40<br />
35<br />
30<br />
25<br />
20<br />
15<br />
10<br />
5<br />
0<br />
Patógeno<br />
Obligado<br />
Patógeno Oportunista/<br />
Comensal<br />
Vida libre<br />
Estilo <strong>de</strong> vida<br />
Figura 8. Valores <strong>de</strong> recombinación correspondientes a diferentes estilos <strong>de</strong> vida<br />
bacterianos<br />
El estimado <strong>de</strong> recombinación r/m se refiere al impacto relativo <strong>de</strong> la recombinación comparado<br />
con la mutación puntual en la generación <strong>de</strong> diversidad genética <strong>de</strong> una población. Patógenos<br />
obligados: Flavobacterium psychrophilum, Porphyromonas gingivalis, Chlamydia trachomatis,<br />
Bor<strong>de</strong>tella pertussis, Bor<strong>de</strong>tella henselae. Patógenos Oportunistas/Comensales: Escherichia<br />
coli (3.24; este trabajo), Streptococcus pneumoniae, Streptococcus pyogenes, Helicobacter<br />
pylori, Moraxella catarrhalis, Neisseria lactamica, Haemophilus influenzae, Campilobacter<br />
jejuni, Enterococcus faecium, Bacillus cereus, Enterococcus faecalis, Chlamydia trachomatis,<br />
Clostridium difficile, Staphylococcus aureus, Leptospira interrogans. Bacterias <strong>de</strong> vida libre:<br />
Pelagibacter ubique (SAR 11), Vibrio parahaemolyticus, Vibrio vulnificus, Microsystis<br />
aeruginosa, Myxococcus xanthus, Bacillus weihenstephanensis, Microcoleus chthonoplates,<br />
Oenococcus ovni, Rizobium gallicum. (Figura armada con la información <strong>de</strong> Vos y Di<strong>de</strong>lot,<br />
2009).<br />
Una <strong>de</strong> las aportaciones más importantes <strong>de</strong> esta <strong>tesis</strong> es la explicación<br />
alternativa <strong>de</strong> tipo poblacional a este paradigma clonal. Nuestra propuesta consi<strong>de</strong>ra que<br />
E. coli a<strong>de</strong>más <strong>de</strong> estar conformada por diferentes poblaciones (los grupos<br />
filogenéticos), también se encuentra dividida en unida<strong>de</strong>s evolutivas menores como<br />
linajes y complejos clonales. Así, encontramos que cada una <strong>de</strong> estas unida<strong>de</strong>s <strong>de</strong><br />
organización genética presenta diferentes mecanismos <strong>de</strong> diversificación los cuales<br />
pue<strong>de</strong>n encontrarse asociados o no a <strong>de</strong>terminados nichos ecológicos y estilos <strong>de</strong> vida.<br />
Gracias a esta estructura y dinámica evolutiva poblacional es que E. coli mantiene su
139<br />
estructura clonal a pesar <strong>de</strong> que ciertas unida<strong>de</strong>s evolutivas presenten niveles <strong>de</strong><br />
recombinación altos.<br />
Nuestra explicación “poblacional” no invalida la propuesta filogenética <strong>de</strong><br />
Touchon y colaboradores (2009), más bien implica una perspectiva complementaria (la<br />
<strong>de</strong> genética <strong>de</strong> poblaciones), la cual junto con la perspectiva filogenética nos muestra un<br />
panorama mucho más amplio <strong>de</strong> cómo suce<strong>de</strong> el proceso evolutivo en E. coli. A<strong>de</strong>más<br />
<strong>de</strong> proponer que E. coli diversifica gracias a que tanto la recombinación como la<br />
mutación suce<strong>de</strong>n a tasas diferentes al interior <strong>de</strong> cada población, linaje y grupo<br />
filogenético, esta <strong>tesis</strong> sugiere que la recombinación homóloga tienen un efecto tanto<br />
homogeneizante como heterogeneizante en términos <strong>de</strong> su historia filogenética, lo cual<br />
reafirma el papel importante que juega tanto en el mantenimiento <strong>de</strong> la poza génica <strong>de</strong><br />
una especie así como en la divergencia <strong>de</strong> las poblaciones que la conforman.<br />
Otro resultado importante <strong>de</strong> esta <strong>tesis</strong> consiste en que la estructura filogenética<br />
<strong>de</strong> E. coli no coinci<strong>de</strong> con la estructura ecológica, es <strong>de</strong>cir, no existe una asociación<br />
estricta entre los grupos filogenéticos que conforman a la especie y los diferentes nichos<br />
ecológicos (diferentes hospe<strong>de</strong>ros) en los que habita y estilos <strong>de</strong> vida que presenta<br />
(comensales y patógenos) como previamente se había sugerido. Esto es importante en<br />
términos <strong>de</strong> la i<strong>de</strong>ntificación <strong>de</strong> las barreras que promueven la especiación en las<br />
poblaciones bacterianas. Como se mencionó en la introducción, en bacterias se han<br />
i<strong>de</strong>ntificado barreras <strong>de</strong> tipo geográficas, ecológicas y sexuales como en los eucariontes.<br />
En el caso <strong>de</strong> E. coli, proponemos que este proceso <strong>de</strong> diferenciación genética acoplada<br />
a barreras ecológicas (simpatría) se lleva a cabo no a nivel <strong>de</strong> grupo filogenético (A, B1,<br />
B2, D, E) sino más bien, a un nivel <strong>de</strong> organización <strong>de</strong> la diversidad genética menor<br />
como son los complejos clonales. Son estos complejos clonales a los que consi<strong>de</strong>ramos<br />
como las unida<strong>de</strong>s evolutivas mínimas mediante las cuales diversifica E. coli <strong>de</strong>bido a<br />
la asociación que guardan con cierto nicho ecológico y/o estilo <strong>de</strong> vida al mismo tiempo<br />
que presentan una <strong>de</strong>terminada dinámica <strong>de</strong> recombinación y mutación.<br />
Para corroborar la existencia <strong>de</strong> una real asociación <strong>de</strong> algunos <strong>de</strong> los complejos<br />
clonales a un nicho <strong>de</strong>terminado, proponemos que es importante que dichos genotipos<br />
hayan pasado suficientes generaciones en el mismo hospe<strong>de</strong>ro lo que aseguraría que la<br />
dinámica evolutiva <strong>de</strong> ese complejo clonal esté mol<strong>de</strong>ada realmente por ese nicho en
140<br />
particular. Para lo cual, proponemos necesario realizar estudios <strong>de</strong> evolución<br />
experimental simulando las condiciones ambientales o fisiológicas asociadas a cada<br />
hospe<strong>de</strong>ro, como por ejemplo, hospe<strong>de</strong>ros con dietas variadas. Ahora bien, ¿cuántas<br />
generaciones son necesarias para <strong>de</strong>tectar diversificación simpátrica Se ha sugerido<br />
que una sola cepa <strong>de</strong> E. coli crecida por 1000 generaciones (equivalente a 156 días) en<br />
presencia tanto <strong>de</strong> glucosa como <strong>de</strong> acetato, diversifica en dos poblaciones coexistentes,<br />
que a diferencia <strong>de</strong>l ancestro, se especializan en utilizar ó glucosa ó acetato como fuente<br />
<strong>de</strong> carbono (Spencer et al., 2008). Se ha propuesto que tal diversificación simpátrica se<br />
origina mediante selección <strong>de</strong>pendiente <strong>de</strong> la frecuencia (Herron et al., 2013).<br />
Consi<strong>de</strong>rando lo anteriormente expuesto, así como los resultados <strong>de</strong> los análisis<br />
<strong>de</strong> genómica <strong>de</strong> poblaciones (Capítulo 6), encontramos necesario explorar la asociación<br />
ecológica <strong>de</strong> cada uno <strong>de</strong> los complejos clonales que conforman a E. coli en términos<br />
más <strong>de</strong>tallados como son por ejemplo, fenotipos metabólicos y sus niveles <strong>de</strong> expresión<br />
así como los niveles <strong>de</strong> regulación génica involucrados en <strong>de</strong>terminados tipos <strong>de</strong> dieta<br />
<strong>de</strong>l hospe<strong>de</strong>ro o en el hecho <strong>de</strong> ser animales silvestres o domésticos o asociados a<br />
ambientes secundarios como suelo, agua y aire. Asimismo, esta <strong>tesis</strong> sugiere a<strong>de</strong>más,<br />
realizar estudios profundos sobre las barreras sexuales, es <strong>de</strong>cir, las restricciones en los<br />
mecanismos genéticos <strong>de</strong> recombinación homóloga (Matic et al., 1996; Majewski,<br />
2001) que pudieran estar promoviendo diferenciación poblacional como suce<strong>de</strong> en<br />
diferentes complejos clonales <strong>de</strong> Salmonella enterica, otra especie facultativa (Di<strong>de</strong>lot<br />
et al., 2011) y en Neisseria meningitidis en don<strong>de</strong> se han <strong>de</strong>scrito 22 sistemas <strong>de</strong><br />
restricción y modificación los cuales generan barreras al intercambio <strong>de</strong> ADN<br />
consistentes con la estructura poblacional <strong>de</strong> esta especie (Budroni et al., 2011).<br />
Otras barreras al intercambio genético podrían referirse a las peculiarida<strong>de</strong>s <strong>de</strong><br />
las maquinarias moleculares <strong>de</strong> la transducción, conjugación y transformación. Así, la<br />
especificidad al hospe<strong>de</strong>ro por parte <strong>de</strong> los fagos podría ser el principal factor que<br />
<strong>de</strong>fina ciertos límites al intercambio genético (Doolittle y Papke, 2006; Rodriguez-<br />
Valera et al., 2009) promoviendo <strong>de</strong> esta manera, divergencia a partir <strong>de</strong> un ancestro<br />
común como se ha propuesto que suce<strong>de</strong> en E. coli O157:H7 (Ohnishi et al., 2001).<br />
Asimismo, otra barrera pudieran ser los CRISPRs (Clustered, regularly interspaced,<br />
short palindromic repeats) o secuencias repetitivas las cuales pue<strong>de</strong>n proveer inmunidad<br />
adquirida a las bacterias contra virus y plásmidos (Sorek et al., 2008). Estudios en E.
141<br />
coli han <strong>de</strong>mostrado que aislados pertenecientes al grupo filogenético B2 carecen <strong>de</strong><br />
estos elementos dado lo cual se torna importante el estudiar más a fondo cómo la falta<br />
<strong>de</strong> los CRISPRs ha mol<strong>de</strong>ado la evolución <strong>de</strong> este grupo filogenético (Touchon et al.,<br />
2011).<br />
Por otro lado, se ha propuesto que la acumulación <strong>de</strong> mutaciones neutrales en las<br />
vecinda<strong>de</strong>s <strong>de</strong> los genes adquiridos horizontalmente origina cromosomas mosaicos en<br />
los cuales, algunos <strong>de</strong> los genes recombinan libremente entre linajes mientras que<br />
aquellos próximos a los genes adquiridos no. Así conforme pasa el tiempo, los linajes<br />
van divergiendo y aunado al hecho <strong>de</strong> que los genes adquiridos que confieren funciones<br />
linaje específicos van aumentando, la acumulación <strong>de</strong> diferencias entre ambos linajes<br />
alcanzan cierto umbral en don<strong>de</strong> el sistema <strong>de</strong> correcciones <strong>de</strong> malos apareamientos<br />
promoverá el aislamiento genético (Lawrence, 2002).<br />
Con respecto a las barreras geográficas, a pesar <strong>de</strong> que E. coli es una especie que<br />
se encuentra distribuida en todo el mundo, proponemos que es necesario hacer estudios<br />
como los realizados en esta <strong>tesis</strong> pero enfocados a muestreos más localizados por región<br />
geográfica como por ejemplo país. Ya que gracias al estudio <strong>de</strong>tenido <strong>de</strong> la dinámica<br />
evolutiva <strong>de</strong> la poza génica <strong>de</strong> cada región se podrán establecer programas <strong>de</strong> vigilancia<br />
epi<strong>de</strong>miológica más robustos.<br />
7.2. El tamaño <strong>de</strong>l cromosoma en E. coli es variable y no se encuentra asociado a un<br />
nicho ecológico y estilo <strong>de</strong> vida en particular, ni tampoco a un grupo filogenético<br />
<strong>de</strong>terminado.<br />
En el presente estudio encontramos que el cromosoma <strong>de</strong> E. coli presenta un rango <strong>de</strong><br />
variación <strong>de</strong> alre<strong>de</strong>dor 2 Megabases (Capítulo 5). Pero lo más importante que arroja esta<br />
<strong>tesis</strong> es el hecho <strong>de</strong> que ésta variación no se encuentra estructurada ni filogenética y ni<br />
ecológicamente. Sin embargo, encontramos que ciertos complejos clonales asociados<br />
exclusivamente a cepas altamente patogénicas, presentan tamaños <strong>de</strong> genomas<br />
prácticamente iguales. Asimismo, si tomamos en cuenta que esta diferencia en el<br />
tamaño <strong>de</strong>l cromosoma correspon<strong>de</strong> principalmente a la parte <strong>de</strong>l genoma flexible,<br />
entonces, po<strong>de</strong>mos consi<strong>de</strong>rar que tanto la ganancia como la pérdida <strong>de</strong> genes, juegan<br />
un papel muy importante en la diversificación <strong>de</strong>l genoma <strong>de</strong> E. coli (Leimbach et al.,<br />
2013).
142<br />
Como se mencionó previamente en la introducción, otro mecanismo genético<br />
que diversifica a los genomas bacterianos es la duplicación génica. Gracias a este<br />
mecanismo, se originan familias multigénicas dando pie a que nuevos genes faciliten la<br />
adaptación a ambientes fluctuantes (Mira et al., 2001). Un análisis realizado en 106<br />
genomas bacterianos, sugiere una gran existencia <strong>de</strong> genes producto <strong>de</strong> duplicación<br />
génica los cuales se encuentran involucrados en funciones tales como transcripción,<br />
metabolismo y <strong>de</strong>fensa (Gevers et al., 2004). En particular, se ha propuesto que en E.<br />
coli, el papel <strong>de</strong> la duplicación <strong>de</strong> genes es muy importante en tanto que familias <strong>de</strong><br />
reguladores transcripcionales (Babu et al., 2003; Teichman et al., 2004) así como los<br />
transportadores tipo ABC son producto <strong>de</strong> este mecanismo <strong>de</strong> diversificación (Linton et<br />
al., 1998). No obstante, Price y colaboradores (2008) proponen que en realidad, la<br />
<strong>mayo</strong>ría <strong>de</strong> los factores <strong>de</strong> transcripción <strong>de</strong> E. coli son producto <strong>de</strong> transferencia<br />
horizontal en lugar <strong>de</strong> duplicación. Esta conclusión sugiere tasas evolutivas rápidas en<br />
los genes regulatorios nicho-específicos <strong>de</strong> E. coli.<br />
Por otro lado, se ha propuesto que mediante la transferencia horizontal <strong>de</strong> islas<br />
genómicas e islas <strong>de</strong> patogénesis, se adquieren genes que promueven la adaptación a<br />
nuevos nichos ecológicos así como la adquisición <strong>de</strong> diferentes estilos <strong>de</strong> vida (Hacker<br />
and Carniel, 2001; Dobrindt et al., 2004). Es así que se ha propuesto que este tipo <strong>de</strong><br />
recombinación juega un papel muy importante en la especiación simpátrica. En el caso<br />
<strong>de</strong> E. coli, el genoma central -el cual presenta pequeños cambios entre diferentes<br />
aislados generados por recombinación homóloga- <strong>de</strong>fine lo que es común a la especie y<br />
los genes adquiridos por THG <strong>de</strong>finirán las adaptaciones específicas a microambientes<br />
específicos lo que a la larga pue<strong>de</strong> constituir una diversificación <strong>de</strong> tipo simpátrica<br />
mediante ecotipos. Este tipo <strong>de</strong> diversificación simpátrica ha sido <strong>de</strong>scrita en otras<br />
especies <strong>de</strong> microorganismos como las bacterias Sinorhizobium medicae y Vibrio<br />
cyclitrophicus y la arquea Sulfolobus islandicus (Bailly et al., 2011; Shapiro et al.,<br />
2012; Cadillo-Quiroz et al., 2012; respectivamente) en don<strong>de</strong> las condiciones<br />
ambientales en las que se distribuyen son ligeramente diferentes <strong>de</strong>bido al tipo <strong>de</strong><br />
hospe<strong>de</strong>ro como es el caso <strong>de</strong> S. medicae cuyos hospe<strong>de</strong>ros son diferentes especies <strong>de</strong><br />
plantas <strong>de</strong>l género Medigaco, o diferentes condiciones ambientales a lo largo <strong>de</strong> la<br />
columna <strong>de</strong> agua <strong>de</strong> mar, como en el caso <strong>de</strong> V. cyclitrophicus o el aprovechamiento<br />
diferencial <strong>de</strong> los nutrientes por parte <strong>de</strong> S. islandicus.
143<br />
Tradicionalmente se ha consi<strong>de</strong>rado que E. coli no es un transformante natural,<br />
sin embargo trabajos recientes sugieren que esta especie presenta mecanismos <strong>de</strong><br />
transformación no caracterizados bajo ciertas condiciones ambientales (Etchuuya et al,<br />
2011). Asimismo, existe evi<strong>de</strong>ncia <strong>de</strong> THG <strong>de</strong> factores <strong>de</strong> virulencia y <strong>de</strong> a<strong>de</strong>cuación<br />
entre las diferentes especies que conforman a la familia Enterobacteriaceae (Dobrindt et<br />
al., 2010; Paauw et al., 2010). Por otro lado, <strong>de</strong>bido a que E. coli se encuentra en<br />
contacto con el microbioma <strong>de</strong>l hospe<strong>de</strong>ro y por en<strong>de</strong> por una comunidad bacteriana<br />
diversa, existe una gran poza génica flexible disponible para transferirse<br />
horizontalmente (Tenaillon et al., 2010). Un trabajo reciente sugiere que la THG se da<br />
principalmente entre los grupos filogenéticos A con B1 y B2 con D. Sin embargo no se<br />
encontraron diferencias significativas en el flujo existente entre cepas con diferentes<br />
estilos <strong>de</strong> vida (comensal y patogénicas) y tampoco entre diferentes ambientes<br />
(intestinal y extraintestinal) (Skippington y Ragan, 2012).<br />
Cabe señalar que para profundizar en el entendimiento <strong>de</strong> la plasticidad<br />
genómica en E. coli, es necesario secuenciar los aislados estudiados en esta <strong>tesis</strong> con el<br />
fin <strong>de</strong> tener no solamente estimados cuantitativos referentes al número <strong>de</strong> genes que se<br />
ganan y se pier<strong>de</strong>n sino para obtener información <strong>de</strong> tipo “cualitativa” que arroje<br />
indicios relacionados con la naturaleza adaptativa <strong>de</strong>l genoma flexible asociado a cada<br />
nicho ecológico. Asimismo, estas secuencias, permitirá evaluar el impacto <strong>de</strong> cada uno<br />
<strong>de</strong> los mecanismos <strong>de</strong> diversificación genética en la evolución <strong>de</strong>l pangenoma <strong>de</strong> E. coli<br />
y por en<strong>de</strong>, en la evolución fenotípica <strong>de</strong> esta especie. Al momento sabemos que la<br />
ganancia <strong>de</strong> genes promueve la colonización <strong>de</strong> nuevos nichos pero también, la pérdida<br />
<strong>de</strong> genes u “hoyos negros” cambia los fenotipos bacterianos. Por ejemplo, las cepas<br />
enteroinvasivas <strong>de</strong> E. coli así como el género Shigella, carecen <strong>de</strong>l gen cadA -el cual<br />
codifica la lisina <strong>de</strong>scarboxilasa en K12- lo que permite la activación <strong>de</strong> las<br />
enterotoxinas y por en<strong>de</strong> la virulencia <strong>de</strong> estas cepas (Maurelli et al, 1998). Asimismo,<br />
la erosión génica origina pseudogenes mediante mecanismos como inserciones <strong>de</strong><br />
nucleótidos, <strong>de</strong> secuencias <strong>de</strong> inserción, <strong>de</strong>leciones y mutaciones puntuales. La<br />
presencia <strong>de</strong> pseudogenes ha sido reportada previamente en cepas enteroinvasivas,<br />
enteropatogénicas <strong>de</strong> E. coli, así como en especies <strong>de</strong>l género Shigella y la cepa K12<br />
(Crossman et al., 2010).
144<br />
7.3. La adaptación a diferentes nichos ecológicos y estilos <strong>de</strong> vida va más allá <strong>de</strong><br />
adquirir los genes nicho-específicos.<br />
Como se mencionó en un principio, gracias a la genómica <strong>de</strong> poblaciones po<strong>de</strong>mos<br />
estudiar los procesos históricos y contemporáneos que mol<strong>de</strong>an la diversificación y<br />
evolución <strong>de</strong> las especies bacterianas. Con el estudio <strong>de</strong> genómica <strong>de</strong> poblaciones<br />
realizado en esta <strong>tesis</strong> analizamos una parte <strong>de</strong>l componente contemporáneos o<br />
ecológicos <strong>de</strong> la evolución <strong>de</strong> E. coli. Encontramos que la evolución <strong>de</strong> la patogénesis<br />
no se da nada más gracias a la transferencia horizontal <strong>de</strong> los factores <strong>de</strong> virulencia, sino<br />
que el cromosoma central también juega un papel importante al representar un fondo<br />
genético que ha diversificado en función <strong>de</strong>l estilo <strong>de</strong> vida patogénico. Es <strong>de</strong>cir,<br />
encontramos evi<strong>de</strong>ncias <strong>de</strong>l proceso <strong>de</strong> adaptación a la patogénesis a nivel <strong>de</strong>l genoma<br />
central <strong>de</strong>bido a la acción <strong>de</strong> la selección natural y <strong>de</strong> la recombinación en funciones<br />
metabólicas básicas como la trascripción, estrés oxidativo, biosín<strong>tesis</strong> <strong>de</strong> estructuras<br />
celulares y elementos regulatorios. Un estudio reciente en don<strong>de</strong> comparan los patrones<br />
<strong>de</strong> transcripción <strong>de</strong> una especie <strong>de</strong> listeria patógena y otra no patógena Listeria<br />
monocytogenes y Listeria innocua respectivamente, sugieren patrones diferenciales en<br />
la expresión <strong>de</strong> la región no codificante <strong>de</strong> ambos genomas (Wurtzel et al., 2012).<br />
E. coli es una especie que explota diferentes nichos ecológicos al encontrarse<br />
asociada tanto a un hospe<strong>de</strong>ro así como al ambiente exterior. En los últimos años, se ha<br />
volteado la mirada al estudio <strong>de</strong>tallado <strong>de</strong> la fisiología <strong>de</strong> esta especie en los diferentes<br />
microhábitats en los que se le encuentra con el fin <strong>de</strong> <strong>de</strong>mostrar la relación que existe<br />
entre los procesos metabólicos básicos y la patogénesis (Marteyn et al., 2010; Alteri et<br />
al., 2011). Se ha encontrado que el metabolismo energético pudiera ser una señal<br />
importante utilizada por las bacterias patógenas para i<strong>de</strong>ntificar y cambiar entre<br />
microambiente específico como pue<strong>de</strong>n ser las diferentes regiones <strong>de</strong>l intestino, el<br />
ambiente urinario, el nervioso y el respiratorio (Alteri y Mobley, 2012). Recientemente,<br />
trabajos experimentales sugieren que los aislados gastrointestinales censan diversas<br />
señales ambientales como <strong>de</strong>tonantes <strong>de</strong> la regulación génica diferencial y la adaptación<br />
a nicho. En particular, Cra y KdpE son dos factores <strong>de</strong> transcripción que se encuentran<br />
tanto en aislados patogénicos como no patogénicos <strong>de</strong> E. coli los cuales regulan a otros<br />
genes en respuesta a las diferencias en la concentración <strong>de</strong> metabolitos tales como<br />
glucosa y glucógeno. Aislados enterohemorrágicos (EHEC) <strong>de</strong> E. coli, utilizan estas
145<br />
señales para la regulación temporal y energético eficiente <strong>de</strong> sus factores <strong>de</strong> virulencia<br />
tales como el locus <strong>de</strong> esfacelamiento y adherencia el cual genera lesiones en los<br />
enterocitos <strong>de</strong>l hospe<strong>de</strong>ro (Njoroge et al., 2012). Lo que sugiere que ligar al<br />
metabolismo <strong>de</strong>l carbono con la coordinación precisa <strong>de</strong> la expresión <strong>de</strong> la virulencia<br />
representa un paso clave en la adaptación <strong>de</strong> los patógenos al ambiente gastrointestinal.<br />
Interesantemente, los trabajos previamente mencionados soportan los resultados<br />
encontrados en nuestro estudio <strong>de</strong> genómica <strong>de</strong> poblaciones los cuales sugieren fuertes<br />
señales <strong>de</strong> selección diversificadora en los diferentes genes involucrados en el<br />
metabolismo energético en las cepas patógenas en comparación con las cepas no<br />
patógenas en don<strong>de</strong> actúa la selección purificadora. Estos resultados nos llevan a<br />
proponer que estudiar cómo cambia la arquitectura transcripcional entre las cepas<br />
patógenas y no patógenas, así como entre los diferentes ambientes intestinal,<br />
extraintestinal en los que se encuentra esta especie arrojará <strong>mayo</strong>r información<br />
concerniente al ecología y evolución <strong>de</strong> esta especie facultativa.<br />
7.4. Estilos <strong>de</strong> vida, asociación a nicho, recombinación homóloga, recombinación no<br />
homóloga y diversificación simpátrica en E. coli<br />
A diferencia <strong>de</strong> otras especies bacterianas como Yersinia pestis cuyo pangenoma es<br />
cerrado, su nicho ecológico restringido y cuya evolución es mol<strong>de</strong>ada principalmente<br />
por la <strong>de</strong>riva génica dados los cambios <strong>de</strong>mográficos sufridos con cada brote epidémico<br />
(Cui et al 2013), E. coli presenta una dinámica evolutiva compleja.<br />
Esta <strong>tesis</strong> propone que E. coli consta <strong>de</strong> un genoma central que diversifica en<br />
<strong>mayo</strong>r medida por recombinación homóloga que por mutación puntual. Esta gran poza<br />
génica se organiza en diferentes grupos genotípicos correspondientes a poblaciones o<br />
grupos filogenéticos, linajes y complejos clonales. Es a nivel <strong>de</strong> complejo clonal que se<br />
encuentra una coherencia ecológica entre los miembros que la conforman asociada a<br />
procesos <strong>de</strong> diversificación genética (tasas <strong>de</strong> recombinación y mutación) característicos<br />
a cada uno. Por lo que cada uno <strong>de</strong> los complejos clonales es consi<strong>de</strong>rado un ecotipo o<br />
la unidad evolutiva mínima en E. coli.
146<br />
Figura 10. Mo<strong>de</strong>lo <strong>de</strong>l proceso <strong>de</strong> divergencia genotípica vía especialización ecológica<br />
simpátrica.<br />
Consi<strong>de</strong>remos una población ancestral <strong>de</strong> E. coli asociada al ambiente intestinal por ejemplo. En<br />
el Paso 1 al menos un genoma adquiere variación (indicado por la estrella ver<strong>de</strong>) vía<br />
recombinación homóloga, mutación puntual, pérdida o transferencia horizontal <strong>de</strong> genes. Esta<br />
variante pue<strong>de</strong> dispersarse a los miembros <strong>de</strong> la población por recombinación homóloga. En un<br />
árbol filogenético elaborado con genes neutrales, la población permanece homogénea. En el<br />
Paso 2, la separación ecológica comienza a disminuir el flujo génico entre las dos poblaciones<br />
(la nueva población <strong>de</strong>notada por color ver<strong>de</strong>, comienza a ocupar un nicho diferente, por<br />
ejemplo, una región diferente <strong>de</strong>l colon o el ambiente extra-intestinal o el <strong>de</strong> vida libre o<br />
también un estilo <strong>de</strong> vida diferente como la patogénesis). En este paso, diferentes genes<br />
arrojarán diferentes árboles filogenéticos <strong>de</strong>bido a los diferentes grados <strong>de</strong> recombinación y<br />
arrastre con los genes adaptativos. En el Paso 3, las mutaciones y todos los cambios genéticos se<br />
han acumulado al interior <strong>de</strong> cada población. Debido a que en las bacterias existe un<br />
<strong>de</strong>crecimiento exponencial <strong>de</strong> la tasa <strong>de</strong> recombinación homóloga en tanto aumenta la<br />
divergencia <strong>de</strong> entre las secuencias, este proceso rápidamente disminuye el flujo génico entre<br />
las poblaciones nacientes. En este punto, el árbol filogenético muestra grupos genéticos<br />
consistentes con la diferenciación ecológica es <strong>de</strong>cir un ecotipo intestinal o un ecotipo extraintestinal<br />
o un ecotipo <strong>de</strong> vida libre (Figura modificada <strong>de</strong> Polz, et al., 2013)
147<br />
A pesar <strong>de</strong> que en esta <strong>tesis</strong> solamente estudiamos cepas aisladas <strong>de</strong> un ambiente<br />
intestinal, po<strong>de</strong>mos generalizar que la asociación a un nicho ecológico ya sea intestinal,<br />
extra-intestinal o <strong>de</strong> vida libre, así como la adquisición <strong>de</strong> un estilo <strong>de</strong> vida <strong>de</strong>terminado<br />
(patogénesis y comensalismo), está dado por dos mecanismos principales. Por un lado,<br />
por la adquisición <strong>de</strong> genes mediante transferencia horizontal los cuales promueven la<br />
adaptación a dicho nicho y su posterior diseminación al interior <strong>de</strong>l ecotipo mediante<br />
recombinación homóloga (Figura 10). Y por el otro, por la posterior afinación <strong>de</strong> las<br />
rutas fisiológicas dada por mutación puntual y recombinación homóloga lo que<br />
promueve el ajuste a las nuevas condiciones ecológicas <strong>de</strong>l nicho.<br />
Con el tiempo, si <strong>de</strong>ja <strong>de</strong> haber flujo génico con miembros <strong>de</strong> diferentes<br />
ecotipos, se originan clonas “exitosas” en términos adaptativos aunque sujetas en <strong>mayo</strong>r<br />
medida a los efectos <strong>de</strong>mográficos <strong>de</strong> la <strong>de</strong>riva génica lo que a la larga pue<strong>de</strong> llevarlas a<br />
su extinción. Pero al mismo tiempo surgen en la población nuevos ecotipos <strong>de</strong>bido a la<br />
versatilidad ecológica <strong>de</strong> la especie por lo que si tomamos una fracción en el tiempo<br />
evolutivo <strong>de</strong> E. coli vemos una serie <strong>de</strong> ecotipos que coexisten cada uno con su propia<br />
dinámica <strong>de</strong> recombinación homóloga, no-homóloga, mutación puntual y selección<br />
natural los cuales van cambiando a lo largo <strong>de</strong>l tiempo.<br />
8. Perspectivas<br />
A partir <strong>de</strong>l trabajo realizado en esta <strong>tesis</strong> surgieron diversas preguntas a explorar. En<br />
concreto nos enfocaremos a las siguientes:<br />
En el capitulo 5 referente a la estimación <strong>de</strong>l tamaño <strong>de</strong>l cromosoma resta<br />
evaluar el papel que tienen tanto los re-arreglos como la duplicación en la<br />
diversificación <strong>de</strong>l cromosoma <strong>de</strong> E. coli. Esta inquietud surge <strong>de</strong>bido a la diversidad en<br />
los perfiles <strong>de</strong> restricción arrojados por diversas cepas estudiadas en esta <strong>tesis</strong> lo cual<br />
nos sugiere dinamismo y flexibilidad a nivel genómico. Al mismo tiempo, en el capítulo<br />
6 <strong>de</strong> este trabajo, encontramos la presencia <strong>de</strong> re-arreglos al comparar el cromosoma<br />
completo <strong>de</strong> diversos aislados <strong>de</strong> E. coli previamente secuenciados. Gracias a estos<br />
indicios, proponemos que caracterizar los mecanismos <strong>de</strong> diversificación <strong>de</strong>l genoma a
148<br />
gran escala <strong>de</strong> aislados provenientes <strong>de</strong> hospe<strong>de</strong>ros tan diversos como animales con<br />
diferentes niveles <strong>de</strong> domesticación, aportaría información valiosa para el<br />
entendimiento <strong>de</strong> la evolución <strong>de</strong>l genoma <strong>de</strong> E. coli.<br />
Para llevar a cabo este objetivo se <strong>de</strong>terminará mediante hibridaciones, la<br />
i<strong>de</strong>ntidad <strong>de</strong> cada fragmento <strong>de</strong> restricción arrojado por la enzima I-CeuI utilizada<br />
previamente para estimar el tamaño <strong>de</strong>l genoma. Como referencia se utilizará el genoma<br />
<strong>de</strong> E. coli K12. Los loci a i<strong>de</strong>ntificar serán: dif en la posición 34.3’ para el fragmento A;<br />
rpoS en la posición 61.8’ para el fragmento B; oriC en la posición 84.6’ para el<br />
fragmento C; uvrD para el fragmento 86.2’ para el fragmento D; glnLG en la posición<br />
87.3’ para el fragmento E y ileS en la posición 0.5’ para el fragmento G (Tomado <strong>de</strong><br />
Bergthorsson y Ochman, 1998).<br />
¿Cuál es el papel diferencial <strong>de</strong> la <strong>de</strong>riva génica y la selección natural en la divergencia<br />
y estructuración poblacional <strong>de</strong> E. coli<br />
Para cubrir este objetivo se realizará un estudio <strong>de</strong> genómica <strong>de</strong> poblaciones<br />
pero se tiene contemplado ampliar la muestra <strong>de</strong> genomas analizados en el capítulo 6<br />
con algunos <strong>de</strong> los genomas enlistados en la Tabla suplementaria 3 y 5 <strong>de</strong>l capítulo 5 <strong>de</strong><br />
esta <strong>tesis</strong>. Los genomas extras que analizaremos cubrirán diversos tipos <strong>de</strong> hospe<strong>de</strong>ros<br />
como por ejemplo, más aislados ambientales así como cepas provenientes <strong>de</strong> animales<br />
silvestres. Al mismo tiempo, aumentaremos la muestra por cada nicho ecológico<br />
(intestinal, extra-intestinal, vida libre) lo cual nos permitirá evaluar la dinámica<br />
evolutiva <strong>de</strong> cada uno <strong>de</strong> estos ecotipos. Asimismo, se incorporarán estimados <strong>de</strong> tasas<br />
<strong>de</strong> mutación y recombinación históricas con el fin <strong>de</strong> darle un componente temporal a la<br />
diversificación y divergencia <strong>de</strong> E. coli.<br />
Otros pendientes que surgen a partir <strong>de</strong> esta <strong>tesis</strong> son:<br />
• Explorar a fondo los mecanismos genéticos que promueven la especiación<br />
simpátrica en E. coli.<br />
• Evaluar el papel que juega la relación genotipo-fenotipo en la divergencia<br />
poblacional en E. coli.
149<br />
9. Referencias<br />
Achtman, M., et al. 1999. Yersinia pestis, the cause of plague, is a recently emerged clone of Yersinia<br />
pseudotuberculosis. Proc. Natl. Acad. Sci USA. 96, 14043-14048.<br />
Alm, E.W., Walk, S.T., Gordon, D.M. 2011. The niche of Escherichia coli. En: Walk, S.T. y Feng,<br />
P.C.H. (Editores). Population genetics of bacteria: a tribute to Thomas S. Whittam., ASM Press,<br />
Washington, D.C. pp., 69-89.<br />
Alteri, C.J., Lindner, J.R., Reiss, D.J., Smith, S.N., Mobley, H.L. 2011. The broadly conserved regulator<br />
PhoP links pathogen virulence and membrane potential in Escherichia coli. Mol. Microbiol. 82,<br />
145-163.<br />
Alteri, C.J., Mobley, H.L.T. 2012. Escherichia coli physiology and metabolism dictates adaptation to<br />
diverse host microenvironments. Curr. Opin. Microbiol. 15, 3-9.<br />
Bailly, X., Giuntini, E., Sexton, M.C., Lower, R.P.J., Harrison, P.W., Kumar, N., Young, J.P. 2011.<br />
Population genomics of Sinorhizobium medicae based on low-coverage sequencing of<br />
sympatric isolates. ISME J. 5, 1722-1734.<br />
Balloux, F. 2010. Demographic influences on bacterial population structure. En Robinson, D.A., Falush,<br />
D., Feil, D. (Eds). Bacterial population genetics in infectious disease. Wiley-Blackwell, USA.<br />
pp., 103-120.<br />
Berg, R.D. 1996. The indigenous gastrointestinal microflora. Trends Microbiol. 4, 430-435.<br />
Bergholz, P.W., Noar, J.D., Buckely, D.H., 2011. Environmental patterns are imposed on the population<br />
structure of Escherichia coli after fecal <strong>de</strong>position. Appl. Environ. Microbiol. 77, 211-129.<br />
Bergthorsson, U., Ochman, H. 1998. Distribution of chromosome length variation in natural isolates of<br />
Escherichia coli. Mol. Biol. Evol. 15, 6-16.<br />
Bisharat, N., Cohen, D.I., Mai<strong>de</strong>n, M.C., Crook, D.W., Peto, T., Harding, R.M. 2007. The evolution of<br />
genetic structure in the marine pathogen, Vibrio vulnificus. Infect. Genet. Evol. 7, 685-693.<br />
Black, W.C. Baer, C.F., Antolin, M.F., DuTeau, N.M. 2001. Population genomics: genome-wi<strong>de</strong><br />
sampling of insect populations. Annu. Rev. Entomol. 46, 441-469.<br />
Budroni, S., Siena, E., Dunning-Hotopp, C.D., Seib, K.L., Serruto, D., Nofroni, C., Comanducci, M.,<br />
Riley, D.R., Daugherty, S.C., Angiuoli, S.V., et. al. 2011. Neisseria meningitidis is structured in<br />
cla<strong>de</strong>s associated with restriction modification systems that modulate homologous<br />
recombination. Proc. Natl. Acad. Sci USA. 108, 4494-4499.<br />
Bumbaugh, A.C. y Lacher, D.W. 2011. Gene acquisition and loss in the phylogenetic lineages of the<br />
invasive Escherichia coli. En Walk, S.T. y Feng, P.C.H. (Editores). Population genetics of<br />
bacteria: a tribute to Thomas S. Whittam. Editores. ASM Press, Washington, D.C. pp., 135-156.<br />
Cadillo-Quiroz, H., Di<strong>de</strong>lot, X., Held, N.L., Herrera, A., Darling, A., Reno, M.L., Krause, D., Whitaker,<br />
R.J. 2012. Patterns of gene flow <strong>de</strong>fine species of thermophilic archaea. PLos Biol 10,<br />
e1001265.<br />
Caugant, D.A., Levin, B.R., Selan<strong>de</strong>r, R.K., 1981. Genetic diversity and temporal variation in the E.<br />
coli population of a human host. Genetics, 98, 467-490.
150<br />
Caugant, D.A., Mocca, L.F., Frasch, C.E., Froholm, L.O., Zollinger, W.D., Selan<strong>de</strong>r, R.K. 1987.<br />
Genetic structure of Neisseria meningitidis populations in relation to serogroup, serotype, and<br />
outer membrane protein pattern. J. Bacteriol. 169, 2781-2792.<br />
Clermont, O., Bonacorsi, S., Bingen, E. 2000. Rapad and simple <strong>de</strong>termination of the Escherichia coli<br />
phylogenetic group. Appl. Environ. Microbiol. 66, 4555-4558.<br />
Clermont, O., Christenson, J.K., Denamur, E., Gordon, D. 2013. The Clermont Escherichia coli phylotyping<br />
method revisited: improvement of specificity and <strong>de</strong>tection of new phylo-groups.<br />
Environ. Microb. Reports. 5, 58-65.<br />
Cohan, F.M. 2001. Bacterial species and speciation. Syst. Biol. 50, 513-524.<br />
Cui, Y., Yu, Ch., Yan, Y., Li, D., Li, Y., Jombart, Weinert, L.A., Wang, Z., Guo, Z., et al. 2013.<br />
Historical variations in mutation rate in an epi<strong>de</strong>mia pathogen, Yersinia pestis. Proc. Natl. Acad.<br />
Sci USA. 110, 577-582.<br />
Chattopadhyay, S., Weissman, S.J., Minin, V.N., Russo, T.A., Dykhuizen, D.E., Sokurenko, E.V. 2009.<br />
High frequency of hotspot mutations in core genes of Escherichia coli to short-term positive<br />
selection. Proc. Natl. Acad. Sci USA. 106, 12412-12417.<br />
Chaudhuri, R.R., Hen<strong>de</strong>rson, I.R. 2012. The evolution of the Escherichia coli phylogeny. Infect. Genet.<br />
Evol. 12, 214-226.<br />
Cho, J-Ch., Tiedje, J.M. 2000. Biogeography and <strong>de</strong>gree of en<strong>de</strong>micity of fluorescent Pseudomonas<br />
strains in soil. Appl. Environ Microb. 66, 5448-5456.<br />
<strong>de</strong> Kievit, T.R., Iglewski, B.H. 2000. Bacterial Quorum Sensing in Pathogenic Relationships. Infect.<br />
Immun. 68, 4839-4849.<br />
Denamur, E., Picard, B., Tenaillon O. 2010. Population genetics of pathogenic Escherichia coli, En:<br />
Robinson, D.A., Falush, D., Feil, E.J. (Eds.), Bacterial population genetics in infectious<br />
diseases. Wiley-Blackwell, West Sussex, United Kingdom, pp. 269-286.<br />
Di<strong>de</strong>lot, X., Falush. D. 2007. Inference of bacterial microevolution using multilocus sequence data.<br />
Genetics. 175, 1251-1266.<br />
Di<strong>de</strong>lot, X., Mai<strong>de</strong>n, M.C.J. 2010. Impact of recombination on bacterial evolution. Trends Microb. 8,<br />
315-322.<br />
Di<strong>de</strong>lot, X., Bow<strong>de</strong>n, R., Street, T., Golubchik, T., Spencer, Ch., McVean, G., Sangal, V., Anjum, M.F.,<br />
Achtman, Falush, D., Donnelly, P. 2011. Recombination and population structure in Salmonella<br />
enterica. Plos Genet. 7, e1002191.<br />
Di<strong>de</strong>lot, X., Méric, G., Falush, D., Dariling, A.E. 2012. Impact of homologous and non-homologous<br />
recombination in the genomic evolution of Escherichia coli. BMC Genomics, 13:256.<br />
Dobrindt, U., Hochhut, B., Hentschel, U., Hacker, J. 2004. Genomic islands in pathogenic and<br />
environmental microorganisms. Nat. Rev. Microbiol. 2, 414-424.<br />
Dobrindt, U., Hacker, J. 2008. Targeting virulence traits: potential strategies to combat extraintestinal<br />
pathogenic Escherichia coli infections. Curr. Opin. Microbiol. 11, 409-413.
151<br />
Dobrindt, U., Chowdary, M.G., Krumbholz, Hacker, J. 2010. Genome dynamics and its impact on<br />
evolution of Escherichia coli. Med. Microbiol. Immunol. 199, 145-154<br />
Doolittle, W.F. Papke, R.T. 2006. Genomics and the bacterial species problem. Genome Biol. 7: 166.<br />
Doolittle, W.F. 2008. Microbial Evolution: Stalking the wild bacterial species. Curr. Biol. 18. R565-<br />
R567.<br />
Dudley, E.G. y Rasko, D.A. 2011. Genomic and virulence heterogeneity of Enteroaggregative<br />
Escherichia coli. En: Walk, S.T. y Feng, P.C.H (Editores). Population genetics of bacteria: a<br />
tribute to Thomas S. Whittam. ASM Press, Washington, D.C. pp 181-198.<br />
Dykuizen, D.E., Green, L. 1991. Recombination in Escherichia coli and the <strong>de</strong>finition of biological<br />
species. J. Bacteriol. 173, 7257-7268.<br />
Eguiarte, L.E. 1999. Una guía para principiantes a la genetica <strong>de</strong> poblaciones. En: La evolución<br />
biológica. Núñez, J. y Eguarte, L.E. (Eds.). México, D.F., <strong>UNAM</strong>. 35-50.<br />
Escobar-Páramo, P., Clermont, O., Blanc-Potard, A.B., Bui, H., Le Bouguénec, C., Denamur, E., 2004.<br />
A specific genetic background is required for acquisition and expression of virulence factors in<br />
Escherichia coli. Mol. Biol. Evol. 21, 1085-1094.<br />
Escobar-Paramo, P., Le Menac’h A, Le Gall T., et al. 2006. I<strong>de</strong>ntification of forces shaping the<br />
commensal Escherichia coli genetic structure by comparing animal and human isolates.<br />
Environ. Microbiol. 8, 1975-1984.<br />
Eslava C, J Mateo J, A Cravioto. 1994. Cepas <strong>de</strong> Escherichia coli relacionadas con la diarrea en Giono<br />
S, A Escobar y JL Val<strong>de</strong>spino. Diagnóstico <strong>de</strong> laboratorio <strong>de</strong> infecciones gastrointestinales.<br />
Secretaria <strong>de</strong> Salud. México, 1994: 251 pp.<br />
Etchuuya, R., Ito, M., Kitano, S., Shigi, F, Sobue, R., Maeda, S. 2011. Cell-to-cell transformation in<br />
Escherichia coli: A novel type of natural transformation involving cell-<strong>de</strong>rived DNA and a<br />
putative promoting pheromone. Plos ONE 6, e16355.<br />
Ettema, J.G., An<strong>de</strong>rsson, S.G. 2009. The α-proteobacteria: the Darwin finches of the bacterial world.<br />
Biol. Lett. 5, 429-432.<br />
Falkowski, P.G., Fenchel, T., Delong, E.F. 2008. The microbial engines that drive earth’s<br />
biogeochemical cycles. Science. 320, 1034-1039.<br />
Feil, E.J., Spratt, B.G. 2001. Recombination and the population structures of bacterial pathogens. Annu.<br />
Rev. Microbiol. 55, 561-590.<br />
Feil, E.J. 2004. Small change: Keeping pace with microevolution. Nat. Rev. Microbiol. 2, 483-495.<br />
Feil, N. 2010. Linkage, selection, and the clonal complex. In: Robinson, D.A., Falush, D., Feil, E.J.<br />
(Eds.), Bacterial Population Genetics in Infectious Diseases. Wiley-Blackwell, West Sussex,<br />
United Kingdom, pp. 19-35.<br />
Felsenstein, J. 1974. The evolutionary advantage of recombination. Genetics. 78, 737-756.<br />
Fierer, N., Bradford, M.A., Jackson, R.B. 2007. Toward an ecological classification of soil bacteria.<br />
Ecology. 88, 1354-1364.
152<br />
Fricke, W.F., Wright, M.S., Lin<strong>de</strong>ll, A.H., Harkins, D.M., Baker-Austin, C., Ravel, J., Stepanauskas, R.<br />
2008. Insights into the environmental resistance gene pool from the genome sequence of the<br />
multidrug-resistant environmental isolate Escherichia coli SMS-3-5. J. Bactriol. 190, 6779-<br />
6794.<br />
Futuyma, D. 2005. Evolution. Sinauer Associates, USA. 603 pp.<br />
Garrigues, C., Johansen, E., Critten<strong>de</strong>n, R. 2013. Pangenomics –an avenue to improved industrial starter<br />
cultures and probiotics. Curr. Opin. Biotechnol. 24, 187-191.<br />
Gevers, D. Van<strong>de</strong>poele, K. Simillion, C., Van <strong>de</strong> Peer, Y. 2004. Gene duplication and biased functional<br />
retention of paralogs in bacterial genomes. Trends Microbiol. 12, 148-154.<br />
González-González A., Sánchez-Reyes L.L., Delgado, G., Eguiarte, L.E., Souza, V. 2013. Hierarchical<br />
clustering of genetic diversity associated to different levels of mutation and recombination in<br />
Escherichia coli: A study based on Mexican isolates. Infect. Genet. Evol. 13, 187-197.<br />
Gordon, D.M. 2010. Strain typing and the ecological structure of Escherichia coli. J AOAC Int. 93,<br />
974-984.<br />
Gordon, D.M., Clermont, O., Tolley, H., Denamur, E., 2008. Assigning Escherichia coli strains to<br />
phylogenetic groups: Multi-locus sequence typing versus the triplex method. Environ.<br />
Microbiol. 10, 2484-2496.<br />
Gregory, T.R. y DeSalle, R. 2005. Comparative genomics in prokaryotes. En: Gregory, T.R. (Editor).<br />
The evolution of the genome. Elsevier Aca<strong>de</strong>mic Press. USA. pp. 585-675.<br />
Gogarten, J.P., Doolittle, W.F., Lawrence, J.G. 2002. Prokaryotic evolution in light of gene transfer.<br />
Mol. Biol. Evol. 19, 2226-2238.<br />
Gordon, D.M., Cowling, A. 2003. The distribution and genetic structure of Escherichia coli Australian<br />
vertebrates: host and geographic effects. Microbiology. 12, 3575-3586.<br />
Goullet, P., Picard, B., 1989. Comparative electrophoretic polymorphism of esterases and other<br />
enzymes in Escherichia coli. J. Gen. Microbiol. 135, 135-143.<br />
Gregory, T.R., DeSalle, R. 2005. The evolution of genome size in prokaryotes. In: The evolution of the<br />
genome (Ed. T. R. Gregory). Elsevier, San Diego. 631-640.<br />
Guttman, D.F., Stavrini<strong>de</strong>s, J. 2010. Population Genomics of Bacteria. In: Robinson, D.A., Falush, D.,<br />
Feil, E.J. (Eds.), Bacterial Population Genetics in Infectious Diseases. Wiley-Blackwell, West<br />
Sussex, United Kingdom, pp. 121-151.<br />
Hacker, J., Carniel, E. 2001. Ecological fitness, genomic islands and bacterial pathogenicity – a<br />
Darwinian view of the evolution of microbes. EMBO Rep. 2, 376-381.<br />
Hanage, W.P. Fraser, C., Spratt, B.G. 2006. The impact of homologous recombination on the generation<br />
of diversity in bacteria. J. Theor. Biol. 239, 210-219.<br />
Hanson, C.A., Fuhrman, J.A., Horner-Devine, M.C., Martiny, J.B.H. 2012. Beyond biogeographic<br />
patterns: processes shaping the microbial landscape. Nat. Rev. Microbiol. 10, 497-506.<br />
Hartl, D.L., Clark, A.G. 1989. Principles of Population Genetics. 2 nd Edition. Sinauer Associates, Inc.<br />
Publishers, MA, EUA.
153<br />
Hedrick, P.W. 2000. Genetics of Populations. 2nd Edition. Jones & Bartlett Publishers, Sudbury,<br />
Massachusetts.<br />
Herczegh, A., Ghidan, A., Deseo, K., Kamotsay, K., Tarjan, I. 2008. Comparison of Streptococcus<br />
mutants strains from children with caries-active, caries-free and gingivitis clinical diagnosis by<br />
pulsed-field gel electrophoresis. Acta Microbiologica et Immunologica Hungarica. 55, 419-427.<br />
Herzer, P., Inouye, S., Inouye, M., Whittam, T.S., 1990. Phylogenetic distribution of branched RNAlinked<br />
multicopy single-stran<strong>de</strong>d DNA among natural isolates of Escherichia coli. J. Bacteriol.<br />
172, 6175-6181.<br />
Hughes, D. 1999. Impact of homologous recombination on genome organization and stability. En:<br />
Charlebois R.L. (editor). Organization of the prokaryotic genome. ASM Press, Washington,<br />
D.C. pp 109-128.<br />
Hughes, J.B. et al. 2006. Microbial biogeography: putting microorganisms on the map. Nat. Rev.<br />
Microbiol. 4, 102-112.<br />
Jaureguy, F., Landraud, L., Passet, V., Diancourt, L., Frapy, E., Guigon, G., Carbonnelle, E., Lortholary,<br />
O., Clermont, O., Denamur, E., et al., 2008. Phylogenetic and genomic diversity of human<br />
bacteremic Escherichia coli strains. BMC Genomics 9, 560-573.<br />
Johnson, J.R., Stell, A.L. 2000. Exten<strong>de</strong>d virulence genotypes of Escherichia coli strains from patients<br />
with urosepsis in relation to phylogeny and host compromise. J. Infect. Dis. 181, 261-272.<br />
Johnson, Z.I., Zinser, E.R., Coe, A., McNulty, N.P., Woodward, E.M.S., Chisholm, S.W. 2006. Niche<br />
partitioning among Prochlorococcus ecotypes along ocean-scale environmental gradients.<br />
Science. 311, 1737-1740.<br />
Johnson, T.J., Wannemuehle, Y., Johnson, S.J., Stell, A.L., Doetkott, C., Johnson, J.R., Kim, K.S.,<br />
Spanjaard, L., Nolan, L.K. 2008. Comparison of extraintestinal pathogenic Escherichia coli<br />
strains from human and avian sources reveals a mixed subset representing potential zoootic<br />
pathogens. Appl. Environ. Microbiol. 74, 7043-7050.<br />
Johnson, J. R. 2011. Molecular epi<strong>de</strong>miology and population genetics of extraintestinal pathogenic<br />
Escherichia coli. En: Walk, S.T. y Feng, P.C.H. (Editores). Population genetics of bacteria: a<br />
tribute to Thomas S. Whittam. ASM Press, Washington, D.C. pp 91-107.<br />
Kaper, J.B., Nataro, J.P., Mobley, H.L. 2004. Pathogenic Escherichia coli. Nat. Rev. Microbiol. 2: 123-<br />
140.<br />
Kettler, G.C., Martiny, A.C., Huang, K., Zucket, J., Coleman, M.L., Rodrigues, S., Chen, F., Lapidus,<br />
A., Ferriera, S., Johnson, J., Steglich, C., Church, G.M., Richardson, P., Chisholm, S.W. 2007.<br />
Patterns and implications of gene gain and loss in the evolution of Prochlorococcus. PLos<br />
Genetics. 3, e231.<br />
Koonin, E.V. 2009. Darwinian evolution in the light of genomics. Nucl. Ac. Res. 37, 1011-1034.<br />
Ksoll, W.B., Ishii, S., Sadowsky, M.J., Hicks, R.E. 2007. Presence and sources of fecal coliform<br />
bacteria in epilithic periphyton communities of Lake Superior. Appl. Environ. Microbiol. 73,<br />
3771-3778.<br />
Lawrence, J.G., Hendrickson, H. 2003. Lateral gene transfere: when will adolescence end Mol.<br />
Microbiol. 50, 739-749.
154<br />
Leimbach, A., Hacker, J., Dobrindt, U. 2013. E. coli as an all-roun<strong>de</strong>r: the thin line between<br />
commensalism and pathogenicity. Curr. Top. Microbiol. Immun. DOI: 10.1007/82_2012_303.<br />
Leopold, Sh., Sawyer, S.A., Whittam, T.S., Tarr, P.I. 2011. Obscured phylogeny and posible<br />
recombinational dormancy in Escherichia coli. BMC Evolutionary Biology, 11: 183.<br />
Levin, B.R., 1981. Periodic selection, infectious gene exchange and the genetic structure of E. coli<br />
populations. Genetics 99, 1-23.<br />
Lloyd, A.L. y Mobley, H.L.T. 2011. Fitness islands in uropathogenic Escherichia coli. En: Robinson,<br />
D.A., Falush, D., Feil, D. (Editores). Bacterial population genetics in infectious disease. Wiley-<br />
Blackwell, USA. pp. 157-179.<br />
Logan, N.A. 1994. Bacterial systematics. Blackwell Scientific Publications, Oxford. 263 pp.<br />
Luikart, G., England, P.R., Tallmon, D., Jordan, S., Taberlet, P. 2003. The power and promise of<br />
population genomics: from genotyping to genome typing. Nat. Rev. Genet. 4, 981-994.<br />
Luo, C., Walk, S.T., Gordon, D.M., Feldgar<strong>de</strong>n, M., Tiedje, J.M., Konstantinidis, K.T., 2011. Genome<br />
sequencing of environmental Escherichia coli expands un<strong>de</strong>rstanding of the ecology and<br />
speciation of the mo<strong>de</strong>l bacterial species. Proc. Natl. Acad. Sci. USA 108, 7200-7205.<br />
Mai<strong>de</strong>n, M.C.J., Bygraves, J.A., Feil, E., Morelli, G., Russell, J.E., Urwin, R., Zhang, Q., Zhou, J.,<br />
Zurth, K., Caugant, D.A., Feavers, I.M., Achtman, M., Spratt, B.G., 1998. Multilocus sequence<br />
typing: a portable approach to the i<strong>de</strong>ntification of clones within populations of pathogenic<br />
microorganisms. Proc. Natl. Acad. Sci. USA 95, 3140-3145.<br />
Margulis, L., Schwartz, K. 1988. Five Kingdoms: An Illustrated Gui<strong>de</strong> to the Phyla of Life on Earth.<br />
Segunda edición. W.H. Freeman and Company. NY.<br />
Marteyn, B., West, N.P., Browning, D.F., Cole, J.A., Shaw, J.G., Palm, F., Mounier, J., Prevost, M.C.,<br />
Sansonetti, P., Tang, C.M. 2010. Modulation of Shigella virulence in response to available<br />
oxygen in vivo. Nature. 465, 355-358.<br />
Maynard-Smith, J. Smith, N.H., O’Rourke, M., Spratt, B.G. 1993. How clonal are bacteria Proc Natl<br />
Acad Sci USA. 90, 4384-4388.<br />
Maynard-Smith, J., Feil, E.J., Smith, N.H. 2000. Population structure and evolutionary dynamics of<br />
pathogenic bacteria. BioEssays. 22, 1115-1122.<br />
Medini, D., Donati, C., Tettelin, H., Masignani, V., Rappuoli. 2005. The microbial pan-genome. Curr.<br />
Opin. Gen. Dev. 15, 589-594.<br />
Mira, A., Ochman, H., Moran, N.A. 2001. Deletional bias and the evolution of bacterial genomes.<br />
Trends Genet. 17, 589-596.<br />
Mira, A., Martin-Cuadrado, A.B., D’Auria, G., Rodriguez-Varela, F. 2010. The bacterial pan-genoma: a<br />
new paradignm in microbiology. Int. Microbiol. 13, 45-57.<br />
Moran, N., Wernegreen, J.J. 2000. Lifestyle evolution in symbiotic bacteria: insights from genomics.<br />
TREE, 15, 321-326.<br />
Morelli, G., Song, Y., Mazzoni, C., Eppinger, M., Roumagnac, Ph., Wagner, D., Feldkamp, M. et al.<br />
2010. Yersinia pestis genome sequencing i<strong>de</strong>ntifies patterns of global phylogenetic diversity.<br />
Nat. Genet. 42, 1140-1143.
155<br />
Muller, H.J. 1964. The Relation of Recombination to Mutational Advance. Mutat. Res. 106, 2-9.<br />
Na<strong>de</strong>au, N.J., Jiggins, C.D. 2010. A gol<strong>de</strong>n age for evolutionary genetics Genomic studies of<br />
adaptation in natural populations. Trends Genet. 26, 484-492.<br />
Nakamura, Y. Itoh, T., Matsuda, H., Gojobori, T. 2004. Biased biological functions of horizontally<br />
transferred genes in prokaryotic genomes. Nat. Genet. 36, 760-766.<br />
Narra, H., Ochman, H. 2006. Of what use is sex to bacteria Curr. Biol. 16, R705-R710.<br />
Nataro, J.P., Kaper, J.B. 1998. Diarrheagenic Escherichia coli. Clin. Microbiol. Rev. 11, 142-201.<br />
Ochman, H., Dávalos, L. 2006. The nature and dynamics of bacterial genomes. Science. 311, 1730-<br />
1733.<br />
Okeke, I.N., Wallace-Gads<strong>de</strong>n, F., Simons, H.R., Matthews, N., Labar, A.S., Hwang, J., Wain, J., 2010.<br />
Multi-locus sequence typing of enteroaggregative Escherichia coli isolates from Nigerian<br />
children uncovers multiple lineages. PLoS One 5, e14093.<br />
OMS. 2008. Global tuberculosis control –Surveillance, planning, financing. World Health Organization,<br />
Geneva. http://www.who.int/tb/publications/global_report/2008/en/in<strong>de</strong>x.html.<br />
O’Rourke, M., Stevens, E. 1993. Genetic structure of Neisseria gonorrhoeae populations: a non-clonal<br />
pathogen. J. Gen. Microbiol. 139, 2603-2611.<br />
Orskov, F., Orskov, I. 1983. Summary of a workshop on the clone concept in the epi<strong>de</strong>miology,<br />
taxonomy, and evolution of the enterobacteriaceae and other bacteria. J. Infect. Dis. 148, 346-<br />
357.<br />
Pace, N.R. 1997. A molecular view of microbial diversity and the biosphere. Science. 276, 734-740.<br />
Palys, T., Berger, E., Mitrica, I., Nakamura, L.K., Cohan, F.M. 2000. Protein-coding genes as molecular<br />
markers for ecologically distinct populations: the case of two Bacillus species. Int. J. Syst. Evol.<br />
Microbiol. 50, 1021-1028.<br />
Papke, R.Th., Ramsing, N.B., Bateson, M.M., Ward, D.M. 2003. Geographical isolation in hot spring<br />
cyanobacteria. Environ. Microb. 5, 650-659.<br />
Paauw, A., Leverstein-van Hall, M.A., Verhoef, J., Fluit, A.C. 2010. Evolution in quantum leaps:<br />
Multiple combinatorial pf HPI and other genetic modules in Enterobacteriaceae. PLos ONE 5:<br />
e8662.<br />
Pérez-Losada, M., Browne, E.B., Madsen, A., Wirth, T., Viscidin, R.P., Crandall, K.A. 2006.<br />
Population genetics of microbial pathogens estimated from multilocus sequence typing (MLST)<br />
data. Infect. Genet. Evol. 6, 97-112.<br />
Philippot, L., An<strong>de</strong>rsson, S.G.E., Battin, T.J., Prosser, J.I., Schimel, J.P., Whitman, W., Hallin, S. 2010.<br />
The ecological coherence of high bacterial taxonomic ranks. Nat. Rev. Microbiol. 8, 523-529.<br />
Picard, B., Sevali Garcia, J., Gouriou, S., Duriez, P., Brahimi, N., Bingen, E., et al. The link between<br />
phylogeny and virulence in Escherichia coli extra-intestinal infection. Infect. Immun. 67, 546-<br />
553.<br />
Polz, M., Alm, E.J., Hanage, W.P. 2013. Horizontal gene transfer and the evolution of bacterial and<br />
archaeal population structure. Trends Genet. 29, 170-175.
156<br />
Power, M.L. Littlefield-Wyer, J., Gordon, D.M., Veal, D.A., Sla<strong>de</strong>, M.B. 2005. Phenotypic and<br />
genotypic characterization of encapsulated Escherichia coli isolated from blooms in two<br />
Australian lakes. Environ. Microbiol. 7, 631-640.<br />
Rasko, D.A, Rosovitz, M.J., Myers, G.S., Mongodin, E.F., Fricke, W.F. Gajer, P., Crabtree, J., et al.<br />
2008. The pangenome structure of Escherichia coli: comparative genomic analysis of E. coli<br />
commensal and pathogenic isolates. J. Bacteriol. 190, 6881-6893.<br />
Reid, S.D., Herbelin, C.J., Bumbaugh, A.C., Selan<strong>de</strong>r, R.K., Whittam, T.S. 2000. Parallel evolution of<br />
virulence in pathogenic Escherichia coli. Nature. 406, 64-67.<br />
Rocap, G., et al. 2003. Genome divergence in two Prochlorococcus ecotypes reflects ocean niche<br />
differentiation. Nature. 424, 1042-1047.<br />
Rocha, E.P.C. 2008. The organization of the bacterial genome. Annu. Rev. Genet. 42, 211-233.<br />
Rosebury, T. 1962. Microorganisms indigenous to man. McGraw-Hill, New York.<br />
Salas, R. 2007. La recombinación: relevancia evolutiva y métodos <strong>de</strong> estimación, con énfasis en<br />
microorganismos. En: Eguiarte, L.E., Souza, V., Aguirre, X. (Editores). <strong>Ecología</strong> Molecular<br />
SEMARNAT-CONABIO. México, D.F. pp: 281-311.<br />
Sandner, L., Eguiarte.L.E., Navarro, A., Cravioto, A., Souza, V. 2001. The elements of the locus of<br />
enterocyte effacement in human and wild mammal isolates of Escherichia coli: evolution by<br />
assemblage or disruption Microbiology 147, 3149-3158.<br />
Savageau, M.A. 1983. Escherichia coli habitats, cell types, and molecular mechanisms of gene control.<br />
Am. Nat. 122, 732-744.<br />
Selan<strong>de</strong>r, R.K., Levin, B.R. 1980. Genetic diversity and structure in Escherichia coli populations.<br />
Science. 210, 545-547.<br />
Selan<strong>de</strong>r, R.K. Caugant, D.A., Ochman, H., Musser, J.M., Gilmour, M.N., Whittam, T.S. 1986.<br />
Methods of multilocus enzyme electrophoresis for bacterial population genetics and<br />
systematics. Appl. Environ. Microbiol. 51, 873-884.<br />
Selan<strong>de</strong>r, R.K., Caugant, D.A., Whittam, T.S. 1987. Genetic structure and variation in natural<br />
populations of Escherichia coli. En: Neidhardt, F.C. (Editor). Escherichia coli and Salmonella<br />
Typhimurium. Cellular and Molecular Biology. American Society for Microbiology,<br />
Washington, DC. pp., 1625-1648.<br />
Schierup, M.H., Wiuf, C. 2010. The coalescent of bacterial populations. En: Robinson, D.A., Falush,<br />
D., Feil, D. (Editores). Bacterial population genetics in infectious disease. Wiley-Blackwell,<br />
USA. pp 3-18.<br />
Schubert, S., Darlu, P., Clermont, O., Wieser, A., Magistro, G., Hoffman, Ch., Weinert, K., Tenaillon,<br />
O., Matic, Denamur, E. 2009. Role of the spread of pathogenicity islands within the Escherichia<br />
coli species. PLosPathogens, 5, e1000257.<br />
Shapiro, B.J., Friedman, J., Cor<strong>de</strong>ro, O.X., Preheim, S.P., Timberlake, S.C., Szabó, G., Polz, M.f., Alm,<br />
E.J. 2012. Events in the ecological differentiation of bacteria. Science. 336, 48-51.<br />
Skippington, E., Ragan, M.A. 2012. Phylogeny rather than ecology or lifestyle biases the construction<br />
of Escherichia coli-Shigella genetic exchange communities. Open Biol. 2: 120112.
157<br />
Souza, V., Eguiarte, L., Avila, G., Cappello, R., Gallardo, C., Montoya, J., Piñero, D. 1994. Genetic<br />
structure of Rhizobium etli biovar phaseoli associated with wild and cultivated bean plants<br />
(Phaseolus vulgaris and Phaseolus coccineus) in Morelos, Mexico. Appl. Environ. Microbiol.<br />
60, 1260-1268.<br />
Souza, V., Rocha, M., Valera, A., Eguiarte, L.E. 1999. Genetic structure of natural populations of<br />
Escherichia coli in wild hosts on different continents. Appl. Environ. Microbiol. 65, 3373-3385.<br />
Souza, V., Rocha, M., Valera, A., Eguiarte, L.E. 2002. The evolutionary ecology of Escherichia coli.<br />
Am. Sc. 90, 332-341.<br />
Spratt, B.G., Hanage, W.P., Feil, E. 2001. The relative contributions of recombination and point<br />
mutation to the diversification of bacterial clones. Curr. Opin. Microbiol. 4, 602-606.<br />
Suerbaum, S., Smith, J.M., Bapumia, K., Morelli, G., Smith, N.H., Kunstmann, E., Dyrek, I., Achtman,<br />
M. 1998. Free recombination within Helicobacter pylori. Proc. Natl. Acad. Sci. USA. 95,<br />
12619-12624.<br />
Tettelin, H., Masignani, V., Cieslewicz, M.J., et al. 2005. Genome analysis of multiple pathogenic<br />
isolates of Streptococcus agalactiae: implications for the microbial “pan-genome”. Proc. Natl.<br />
Acad. Sci. USA. 102, 13950-13955.<br />
Thomas, C.M., Nielsen, K.M. 2005. Mechanisms of, and barriers to, horizontal gene transfer between<br />
bacteria. Nat. Rev. Microbiol. 3, 711-721.<br />
Tenaillon, O., Skurnik, D., Picard, B., Denamur, E., 2010. The population genetics of commensal<br />
Escherichia coli. Nat. Rev. Microbiol. 8, 207-217.<br />
Touchon, M., Hoe<strong>de</strong>, C., Tenaillon, O., Barbe, V., Baeriswyl, S., et al., 2009. Organised genome<br />
dynamics in Escherichia coli species results in highly diverse adaptive paths. PLoS Genetics 5,<br />
e1000344.<br />
Tyson, G.W. Chapman, J., Hugenholtz, Ph., Allen, E.E., Rachna, J., et al. Community structure and<br />
metabolism through reconstruction of microbial genomes from the environment. Nature. 428,<br />
37-43.<br />
Van Belkum, A., Melles, D.C., Nouwen, J., van Leeuwen, W.B., van Wamel., Vos, M.C., Wertheim,<br />
H.F.L. Verbrugh, H.A. 2009. Coevolutionary aspects of human colonisation and infection by<br />
Staphylococcus aureus. Infect. Genet. Evol. 9, 32-47.<br />
Vos, M., Di<strong>de</strong>lot, X. 2009. A comparison of homologous recombination rates in bacteria and archaea.<br />
ISME J. 3, 199-208.<br />
Walk, S.T., Alm, E.W., Calhoun, L.M., Mladonicky, J.M., Whittam, T.S., 2007. Genetic diversity and<br />
population structure of Escherichia coli isolated from freshwater beaches. Environ. Microbiol.<br />
9, 2274-2288.<br />
Ward, B.B., O’Mullan, G.D. 2002. World distribution of Nitrosococcus oceani, a marine ammoniaoxidizing<br />
y-Proteobacterium, <strong>de</strong>tected by PCR and sequencing of 16 rRNA and amoA genes.<br />
Appl. Environ. Microbiol. 68, 4153-4157.<br />
Wernegreen, J.J. 2002. Genome evolution in bacterial endosymbionts of insects. Nat. Rev. Gen. 3, 850-<br />
861.
158<br />
Whitaker, R.J., Grogan, D.W., Taylor, J.W. 2003. Geographic barriers isolate en<strong>de</strong>mic populations of<br />
hyperthermophilic archaea. Science. 301, 976-978.<br />
Whitaker, R.J. Grogan, D.W., Taylor, J.W. 2005. Recombination shapes the natural population structure<br />
of the hyperthermophilic Archaeon Sulfolobus “islandicus”. Mol. Biol. Evol. 22, 2354-2361.<br />
Whitman, W.B., Coleman, D.C., Wiebe, W.J. 1998. Prokaryotes: the unseen majority. Proc. Natl. Acad.<br />
Sci. USA. 95: 6578-6583.<br />
Whittam, T.S., Ochman, H., Selan<strong>de</strong>r, R.K. 1983. Geographic components of linkage disequilibrium in<br />
natural populations of Escherichia coli. Mol. Biol. Evol. 1, 67-83.<br />
Wirth, T., Falush, D., Lan, R., Colles, F., Mensa, P., Wieler, L., Karch, H., Reeves, P., Mai<strong>de</strong>n, M.,<br />
Ochman, H., Achtman, M., 2006. Sex and virulence in Escherichia coli: an evolutionary<br />
perspective. Mol. Microbiol. 60, 1136-1151.<br />
Wu, D., et al. 2009. A phylogeny-driven genomic encyclopaedia of Bacteria and Archaea. Nature. 462,<br />
1056-1060.<br />
Wurtzel, O., Sesto, N., Mellin, J.R., Karunker, I., E<strong>de</strong>lheit, S., Bécavin, C., Archambaud, Cossart, P.,<br />
Sorek, R. 2012. Comparative transcriptomics of pathogenic and non-pathogenic Listeria<br />
species. Mol. Syst. Biol. 8:583.<br />
Xu, J. 2006. Microbial ecology in the age of genomics and metagenomics: concepts, tools, and recent<br />
advances. Mol. Ecol. 15, 1713-1731.