La crisis financiera de los Estados Unidos. - Instituto de EconomÃa y ...
La crisis financiera de los Estados Unidos. - Instituto de EconomÃa y ...
La crisis financiera de los Estados Unidos. - Instituto de EconomÃa y ...

You also want an ePaper? Increase the reach of your titles
YUMPU automatically turns print PDFs into web optimized ePapers that Google loves.
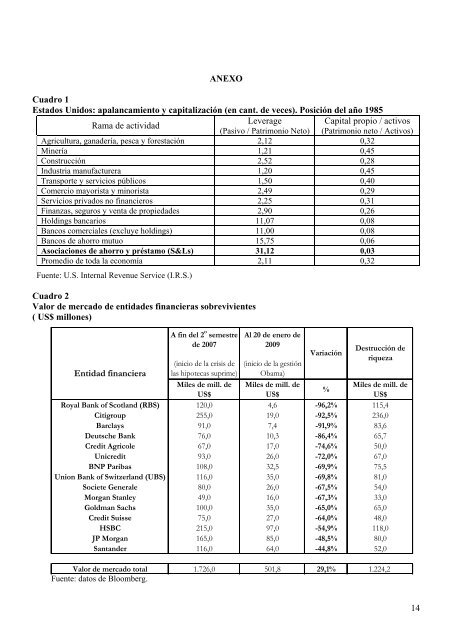
ANEXO<br />
Cuadro 1<br />
<strong>Estados</strong> <strong>Unidos</strong>: apalancamiento y capitalización (en cant. <strong>de</strong> veces). Posición <strong>de</strong>l año 1985<br />
Rama <strong>de</strong> actividad<br />
Leverage Capital propio / activos<br />
(Pasivo / Patrimonio Neto) (Patrimonio neto / Activos)<br />
Agricultura, gana<strong>de</strong>ría, pesca y forestación 2,12 0,32<br />
Minería 1,21 0,45<br />
Construcción 2,52 0,28<br />
Industria manufacturera 1,20 0,45<br />
Transporte y servicios públicos 1,50 0,40<br />
Comercio mayorista y minorista 2,49 0,29<br />
Servicios privados no financieros 2,25 0,31<br />
Finanzas, seguros y venta <strong>de</strong> propieda<strong>de</strong>s 2,90 0,26<br />
Holdings bancarios 11,07 0,08<br />
Bancos comerciales (excluye holdings) 11,00 0,08<br />
Bancos <strong>de</strong> ahorro mutuo 15,75 0,06<br />
Asociaciones <strong>de</strong> ahorro y préstamo (S&Ls) 31,12 0,03<br />
Promedio <strong>de</strong> toda la economía 2,11 0,32<br />
Fuente: U.S. Internal Revenue Service (I.R.S.)<br />
Cuadro 2<br />
Valor <strong>de</strong> mercado <strong>de</strong> entida<strong>de</strong>s <strong>financiera</strong>s sobrevivientes<br />
( US$ millones)<br />
Entidad <strong>financiera</strong><br />
A fin <strong>de</strong>l 2 o semestre<br />
<strong>de</strong> 2007<br />
(inicio <strong>de</strong> la <strong>crisis</strong> <strong>de</strong><br />
las hipotecas suprime)<br />
Miles <strong>de</strong> mill. <strong>de</strong><br />
US$<br />
Al 20 <strong>de</strong> enero <strong>de</strong><br />
2009<br />
(inicio <strong>de</strong> la gestión<br />
Obama)<br />
Miles <strong>de</strong> mill. <strong>de</strong><br />
US$<br />
Variación<br />
Valor <strong>de</strong> mercado total 1.726,0 501,8 29,1% 1.224,2<br />
Fuente: datos <strong>de</strong> Bloomberg.<br />
%<br />
Destrucción <strong>de</strong><br />
riqueza<br />
Miles <strong>de</strong> mill. <strong>de</strong><br />
US$<br />
Royal Bank of Scotland (RBS) 120,0 4,6 -96,2% 115,4<br />
Citigroup 255,0 19,0 -92,5% 236,0<br />
Barclays 91,0 7,4 -91,9% 83,6<br />
Deutsche Bank 76,0 10,3 -86,4% 65,7<br />
Credit Agricole 67,0 17,0 -74,6% 50,0<br />
Unicredit 93,0 26,0 -72,0% 67,0<br />
BNP Paribas 108,0 32,5 -69,9% 75,5<br />
Union Bank of Switzerland (UBS) 116,0 35,0 -69,8% 81,0<br />
Societe Generale 80,0 26,0 -67,5% 54,0<br />
Morgan Stanley 49,0 16,0 -67,3% 33,0<br />
Goldman Sachs 100,0 35,0 -65,0% 65,0<br />
Credit Suisse 75,0 27,0 -64,0% 48,0<br />
HSBC 215,0 97,0 -54,9% 118,0<br />
JP Morgan 165,0 85,0 -48,5% 80,0<br />
Santan<strong>de</strong>r 116,0 64,0 -44,8% 52,0<br />
14