EstadÃsticas Mensuales Julio 2010 - Bolsa de Santiago
EstadÃsticas Mensuales Julio 2010 - Bolsa de Santiago
EstadÃsticas Mensuales Julio 2010 - Bolsa de Santiago

You also want an ePaper? Increase the reach of your titles
YUMPU automatically turns print PDFs into web optimized ePapers that Google loves.
LA BOLSA DE COMERCIO DE SANTIAGO EN JULIO DE <strong>2010</strong>Indices IPSA e IGPA crecen en el mes 7,4% y 7,7% y en el año 21,9% y 22%respectivamente, anotando nuevos máximos históricosNegocios accionarios <strong>de</strong> julio superaron en 20,8 %a las operaciones efectuadas el mes anteriorRemate <strong>de</strong>l 5% <strong>de</strong> RIPLEY alcanzó los $ 52.302,4 millones (US$ 97,1 millones)Durante julio en el mercado accionario <strong>de</strong> la <strong>Bolsa</strong> <strong>de</strong> Comercio <strong>de</strong> <strong>Santiago</strong> seregistraron transacciones por $ 2.062.730 millones (US$ 3.949 millones), volumen que superó en20,8% a las operaciones efectuadas el mes anterior. Así, dicho mercado acumula en el curso <strong>de</strong>lpresente año negocios por $ 13.976.249 millones (US$ 26.756 millones), nivel que exce<strong>de</strong> en 10,6% alas operaciones realizadas en igual período <strong>de</strong> 2009.Por su parte, en el mes los precios <strong>de</strong> las acciones experimentaron un significativoavance que se reflejó en un aumento <strong>de</strong>l Indice <strong>de</strong> Precios Selectivo <strong>de</strong> Acciones (IPSA) <strong>de</strong> 7,4%, <strong>de</strong>lIndice General <strong>de</strong> Precios <strong>de</strong> Acciones (IGPA) <strong>de</strong> 7,7% y <strong>de</strong>l índice INTER-10 <strong>de</strong> 9,6%. Cabe <strong>de</strong>stacarque durante julio se marcaron nuevos y sucesivos máximos históricos <strong>de</strong>l IPSA e IGPA, los cualesalcanzaron hasta 4.379,08 y 20.272,59 puntos, respectivamente. Así, en el curso <strong>de</strong> <strong>2010</strong> dichosindicadores acumulan incrementos <strong>de</strong> 21,9% el IPSA; 22,0% el IGPA, y 16,5% el índice INTER-10,situando a la <strong>Bolsa</strong> <strong>de</strong> Comercio <strong>de</strong> <strong>Santiago</strong> entre los centros bursátiles a nivel mundial con mayorrentabilidad en lo que va corrido <strong>de</strong>l presente año.En términos sectoriales, cabe <strong>de</strong>stacar el alza registrada en el mes por los sectoresBanca, Industrial, Consumo y Construcción & Inmobiliario, cuyos índices crecieron 18,3%, 15,6%,13,1% y 11,0%, respectivamente. En igual período, los sectores <strong>de</strong> menor rendimiento fueron Utilitiesy Comunicación & Tecnología, cuyos indicadores registraron variaciones <strong>de</strong> 2,4% y 1,9%,respectivamente.Entre las acciones más transadas en julio se <strong>de</strong>stacaron los títulos <strong>de</strong> SQM-B,Falabella, En<strong>de</strong>sa, Cencosud, Lan, La Polar, Cap, Ripley, Enersis y Copec, los cuales concentraron enconjunto aproximadamente el 60% <strong>de</strong>l total negociado en el mercado accionario.En este contexto, cabe mencionar el significativo remate <strong>de</strong> 96.802.615 <strong>de</strong> acciones <strong>de</strong>Ripley Corp S.A. (RIPLEY), representativas <strong>de</strong>l 5% <strong>de</strong> la propiedad accionaria <strong>de</strong> la compañía, las quefueron adjudicadas por Celfin Capital S.A. Corredores <strong>de</strong> <strong>Bolsa</strong> en $ 52.302,4 millones (US$ 97,1millones) el 5 <strong>de</strong> julio <strong>de</strong> <strong>2010</strong>.Respecto <strong>de</strong>l Mercado <strong>de</strong> Valores Extranjeros, cabe <strong>de</strong>stacar la inscripción en dichomercado <strong>de</strong> 38 clases <strong>de</strong> acciones o cuotas <strong>de</strong> los fondos mutuos extranjeros <strong>de</strong> los Vehículos <strong>de</strong>Inversión Colectiva “DWS Türkei”, “DWS India”, “DWS Russia”, “DWS Deutschland”, “DWS InvestSociété d’Investissement à Capital Variable” y “Franklin Templeton Investment Funds Sociétéd’Investissement á Capital Variable”. Así también, <strong>de</strong>staca la inscripción <strong>de</strong> 79 nuevas clases <strong>de</strong>acciones o cuotas <strong>de</strong> los fondos mutuos extranjeros <strong>de</strong> la sociedad Morgan Stanley Investment Fund.En relación al mercado <strong>de</strong> cuotas <strong>de</strong> fondos <strong>de</strong> inversión (CFI), en julio fueron inscritoslos fondos <strong>de</strong>nominados “Fondo <strong>de</strong> Inversión Banchile Inmobiliario IV” (CFIBACHIN4) administrado porBanchile Administradora General <strong>de</strong> Fondos S.A., y “Fondo <strong>de</strong> Inversión Instrumentos HipotecariosDS04” (CFILVAIH04) administrado por Larraín Vial Activos S.A. Administradora General <strong>de</strong> Fondos.Por su parte, las colocaciones primarias <strong>de</strong> Bonos <strong>de</strong> Empresas y <strong>de</strong>l Banco Centralsumaron en el mes $ 231.099 millones, en tanto las colocaciones <strong>de</strong> Efectos <strong>de</strong> Comercio totalizaron$ 19.967 millones.En términos consolidados, durante julio en la <strong>Bolsa</strong> <strong>de</strong> Comercio <strong>de</strong> <strong>Santiago</strong> seefectuaron transacciones por $ 32.684.086 millones, el cual se <strong>de</strong>sglosa por mercado en el cuadrosiguiente:MONTOS TRANSADOSLAS 10 ACCIONES MAS RENTABLESJULIO <strong>2010</strong> JULIO <strong>2010</strong>Mercado Millones $ Acción Rentabilidad (%)Acciones 2.062.730 NAVIERA 36,67Renta Fija 6.649.163 TATTERSALL 32,23Int. Financ 17.155.308 MULTIFOODS 29,03Monetario 6.732.106 SECURITY 28,23Cfi 81.735 HITES 27,74Valores Extranjeros 3.044 HABITAT 26,42------------- INVERMAR 24,67Total 32.684.086 SK 24,19BCI 22,33CIC 22,22(1): Consi<strong>de</strong>ra acciones con presencia mayor o igual a 50% durante julio <strong>de</strong> <strong>2010</strong>.
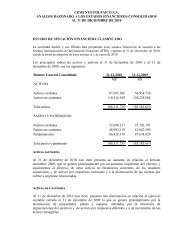
ESTADISTICAS BURSATILES - JULIO <strong>2010</strong>MONTOS TRANSADOS EN LA BOLSA DE COMERCIO DE SANTIAGO - JULIO <strong>2010</strong>(Incluye operaciones en rueda y fuera <strong>de</strong> rueda)ACCIONES C.F.I. MONETARIOS I.I.F.I.R.F.TOTALPERIODO Monto Negocios Monto Negocios Monto Negocios Monto Negocios Monto Negocios Monto Negocios(MM$) (MM$) (MM$) (MM$) (MM$) (MM$)01-07-<strong>2010</strong> 70.930 6.647 21.710 12 360.671 4.761 801.746 2.516 556.267 2.022 1.811.323 15.95802-07-<strong>2010</strong> 86.534 6.216 634 9 417.871 4.752 863.058 2.916 319.752 1.379 1.687.848 15.27205-07-<strong>2010</strong> 87.131 4.902 16.288 15 321.235 4.645 659.204 2.508 198.591 795 1.282.449 12.86506-07-<strong>2010</strong> 61.151 7.414 2.966 11 265.868 5.876 768.950 2.926 322.977 1.395 1.421.913 17.62207-07-<strong>2010</strong> 103.387 8.227 17.086 6 329.030 4.843 679.735 2.885 273.408 1.161 1.402.646 17.12208-07-<strong>2010</strong> 119.557 9.348 4.038 12 333.588 4.652 680.689 2.363 352.342 1.312 1.490.214 17.68709-07-<strong>2010</strong> 140.685 9.445 148 5 355.090 4.517 732.910 2.465 210.692 1.251 1.439.524 17.68312-07-<strong>2010</strong> 59.038 7.239 673 7 298.872 3.846 489.112 1.932 240.723 1.106 1.088.417 14.13013-07-<strong>2010</strong> 100.358 10.721 1.000 7 158.770 3.365 680.584 2.548 419.543 1.486 1.360.255 18.12714-07-<strong>2010</strong> 88.774 10.348 629 7 266.690 3.369 878.886 3.033 200.848 1.102 1.435.828 17.85915-07-<strong>2010</strong> 75.993 8.694 3.683 7 302.167 3.151 826.623 2.209 309.574 1.358 1.518.040 15.41919-07-<strong>2010</strong> 57.406 7.334 139 6 267.579 3.163 1.138.908 4.144 315.057 1.298 1.779.089 15.94520-07-<strong>2010</strong> 144.714 10.238 3.009 6 358.141 4.826 1.132.251 4.329 335.682 1.542 1.973.797 20.94121-07-<strong>2010</strong> 138.471 11.593 2.793 11 327.497 3.853 889.837 3.239 317.132 1.483 1.675.730 20.17922-07-<strong>2010</strong> 107.535 11.686 340 12 474.503 3.417 861.547 2.869 360.812 1.553 1.804.737 19.53723-07-<strong>2010</strong> 86.784 9.656 183 10 463.131 4.353 919.401 3.163 231.591 1.085 1.701.090 18.26726-07-<strong>2010</strong> 99.463 12.039 720 17 347.327 3.845 726.436 2.438 211.557 968 1.385.503 19.30727-07-<strong>2010</strong> 124.079 11.892 325 5 382.854 4.809 753.836 2.852 443.617 1.577 1.704.712 21.13528-07-<strong>2010</strong> 110.186 10.238 661 16 389.302 4.067 954.449 3.298 342.647 1.520 1.797.244 19.13929-07-<strong>2010</strong> 93.293 9.500 1.527 18 311.920 3.773 1.115.267 4.641 423.870 2.330 1.945.877 20.26230-07-<strong>2010</strong> 107.262 8.619 3.184 16 456.069 4.266 1.010.259 3.884 380.894 1.944 1.957.668 18.729jul. <strong>2010</strong> 2.062.731 191.996 81.736 215 7.188.175 88.149 17.563.688 63.158 6.767.576 29.667 33.663.904 373.185jun. <strong>2010</strong> 1.707.376 137.631 89.352 160 7.346.580 85.854 15.819.810 59.037 6.997.264 27.391 31.960.391 310.073Variación (%) 20,81 39,50 -8,52 34,38 -2,16 2,67 11,02 6,98 -3,28 8,31 5,33 20,35Jun. 10 /Jul 10PARTICIPACION POR MERCADOJULIO <strong>2010</strong>IRF20,10%CFI0,24%MONETARIOS21,35%ACCIONES6,13%IIF52,17%
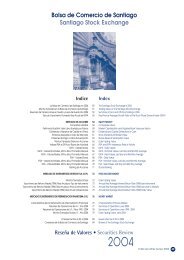
INDICES IPSA, IGPA e INTER-10JULIO <strong>2010</strong>IGPA IPSA INTER-10(Base 100 = 30/12/1980) (Base 1000 = 30/12/2002) (Base 3.051,83 = 28/12/2007)PERIODO Indice Variación (%) Indice Variación (%) Indice Variación (%)01-07-<strong>2010</strong> 18.694,65 -0,81 4.025,17 -0,99 4.717,43 -1,1002-07-<strong>2010</strong> 18.832,91 0,74 4.060,13 0,87 4.771,36 1,1405-07-<strong>2010</strong> 18.731,16 -0,54 4.032,01 -0,69 4.745,87 -0,5306-07-<strong>2010</strong> 18.881,52 0,80 4.070,27 0,95 4.822,16 1,6107-07-<strong>2010</strong> 19.111,09 1,22 4.129,39 1,45 4.897,96 1,5708-07-<strong>2010</strong> 19.295,79 0,97 4.175,91 1,13 4.951,03 1,0809-07-<strong>2010</strong> 19.342,85 0,24 4.180,95 0,12 5.003,47 1,0612-07-<strong>2010</strong> 19.303,53 -0,20 4.168,13 -0,31 4.988,89 -0,2913-07-<strong>2010</strong> 19.474,78 0,89 4.203,67 0,85 5.030,33 0,8314-07-<strong>2010</strong> 19.525,42 0,26 4.213,19 0,23 5.011,28 -0,3815-07-<strong>2010</strong> 19.553,33 0,14 4.221,61 0,20 5.029,35 0,3619-07-<strong>2010</strong> 19.521,23 -0,16 4.209,14 -0,30 5.013,22 -0,3220-07-<strong>2010</strong> 19.657,00 0,70 4.241,75 0,77 5.058,08 0,8921-07-<strong>2010</strong> 19.855,24 1,01 4.286,14 1,05 5.112,75 1,0822-07-<strong>2010</strong> 19.928,27 0,37 4.304,00 0,42 5.150,78 0,7423-07-<strong>2010</strong> 20.026,73 0,49 4.326,00 0,51 5.192,36 0,8126-07-<strong>2010</strong> 20.197,46 0,85 4.366,65 0,94 5.235,18 0,8227-07-<strong>2010</strong> 20.272,59 0,37 4.379,08 0,28 5.252,57 0,3328-07-<strong>2010</strong> 20.241,85 -0,15 4.354,03 -0,57 5.237,29 -0,2929-07-<strong>2010</strong> 20.262,42 0,10 4.357,21 0,07 5.219,78 -0,3330-07-<strong>2010</strong> 20.296,63 0,17 4.364,15 0,16 5.226,17 0,12Jul <strong>2010</strong> 20.296,63 7,69 4.364,15 7,35 5.226,17 9,57Jun <strong>2010</strong> 18.848,07 3,96 4.065,29 4,59 4.769,91 4,24Nota: Indices al cierre <strong>de</strong> cada día4.500INDICE DE PRECIO SELECTIVO DE ACCIONES (IPSA) DIARIODICIEMBRE 2005 - JULIO <strong>2010</strong>4.2504.0003.750PUNTOS DIARIOS3.5003.2503.0002.7502.5002.2502.0001.750Dic-05Mar-06Jun-06Sep-06Dic-06Mar-07Jun-07Sep-07Dic-07Mar-08Jun-08Sep-08Dic-08Mar-09Jun-09Sep-09Dic-09Mar-10Jun-10
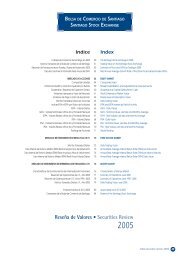
VARIACIONES DE INDICES DE PRECIOS ACCIONARIOSPRINCIPALES BOLSAS DEL MUNDOAÑO <strong>2010</strong>INDICEVAR (%) VAR (%)MES ANUALIPSA <strong>Santiago</strong> 7,35 21,86GENERAL Caracas -1,66 16,34IGBC Bogotá 6,90 14,49GUAYAQUIL Guayaquil 4,17 8,37XETRA-DAX Frankfort 3,06 3,20MERVAL Buenos Aires 9,57 3,16IGBVL Lima 2,08 1,83TSE 300 Toronto 3,71 0,05IPC Ciudad <strong>de</strong> México 3,70 -0,43DOW JONES Nueva York NYSE 7,08 -0,78BOVESPA Sao Paulo 10,80 -1,56NASDAQ Com Nueva York Nasdaq 6,90 -1,60HANG SENG Hong Kong 4,48 -2,17FTSE 100 Londres 6,94 -2,59CAC 40 París 5,82 -7,43NIKKEI Tokio 1,65 -9,57IBEX Madrid 13,35 -12,06VARIACION ANUAL INDICES DE PRECIOS DE ACCIONESDE PRINCIPALES BOLSAS DEL MUNDOAÑO <strong>2010</strong>23191511VAR (%)73-1-5-9-13<strong>Santiago</strong>CaracasBogotáGuayaquilFrankfortBuenos AiresLimaTorontoCiudad <strong>de</strong> MéxicoNueva York NYSESao PauloNueva YorkNasdaqHong KongLondresParísTokioMadridBOLSAS
RANKING DE ACCIONES -JULIO <strong>2010</strong>MONTOSRENTABILIDADPATRIMONIOBURSATILTRANSADOS MES (1) 30-Jul-<strong>2010</strong>Sec. SOCIEDAD (MILES $) % SOCIEDAD (%) SOCIEDAD (MILLONES $) %1 SQM-B 175.296.715 8,50 NAVIERA 36,67 COPEC 11.092.303 7,872 FALABELLA 157.726.983 7,65 TATTERSALL 32,23 FALABELLA 9.797.936 6,953 ENDESA 140.225.378 6,80 MULTIFOODS 29,03 BSANTANDER 7.835.590 5,564 LAN 134.722.165 6,53 SECURITY 28,23 ENERSIS 7.073.222 5,025 CENCOSUD 133.008.553 6,45 HITES 27,74 ENDESA 7.028.904 4,996 LA POLAR 111.096.298 5,39 HABITAT 26,42 CENCOSUD 6.009.156 4,267 CAP 109.797.290 5,32 INVERMAR 24,67 CMPC 5.287.040 3,758 RIPLEY 104.802.209 5,08 SK 24,19 CHILE 4.783.763 3,399 ENERSIS 85.575.949 4,15 BCI 22,33 ANTARCHILE 4.769.591 3,3810 COPEC 74.582.919 3,62 CIC 22,22 LAN 4.215.236 2,9911 COLBUN 49.544.047 2,40 SM-CHILE E 21,89 SQM-A 3.284.850 2,3312 GENER 43.698.079 2,12 LAN 21,83 CAP 2.864.771 2,0313 VAPORES 43.180.084 2,09 PAZ 21,65 BCI 2.820.572 2,0014 CMPC 43.154.277 2,09 COLO COLO 20,74 COLBUN 2.487.155 1,7615 CALICHERAA 42.019.446 2,04 ENJOY 20,00 SQM-B 2.382.621 1,6916 BSANTANDER 39.574.822 1,92 INDISA 19,73 MINERA 2.275.000 1,6117 BCI 37.357.720 1,81 BESALCO 18,61 GENER 2.191.730 1,5618 ENAEX 37.298.954 1,81 FORUS 18,46 PEHUENCHE 1.813.372 1,2919 CHILE 35.076.735 1,70 INVERCAP 18,36 QUINENCO 1.767.228 1,2520 PARAUCO 34.638.220 1,68 QUINENCO 18,31 ENTEL 1.762.102 1,25(1): Acciones con presencia igual o superior a 50% durante julio <strong>de</strong> <strong>2010</strong>.JULIO <strong>2010</strong>PRINCIPALES REMATES Y COLOCACIONES DE ACCIONESACCIONES OMONTO MONTO PRECIOFECHA EMISOR CUOTASTRANSADO TRANSADO UNITARIO ($)OPERACIÓN TRANSADAS (Millones $) (MMUS$) ADJUDICACIÓN1-Jul-<strong>2010</strong> Celfin Deuda Latinoamericana Fondo <strong>de</strong> Inversión 507.515 10.940 20 21.556,001-Jul-<strong>2010</strong> Celfin Deuda Latinoamericana Fondo <strong>de</strong> Inversión 459.241 9.899 18 21.556,035-Jul-<strong>2010</strong> Ripley Corp S.A. 96.802.615 52.302 97 540,305-Jul-<strong>2010</strong> Celfin Small Cap Latin América Fondo <strong>de</strong> Inversión 609.283 16.158 30 26.519,007-Jul-<strong>2010</strong> Fondo <strong>de</strong> Inversión Larraín Vial Deuda DS04 760.272 16.134 30 21.221,929-Jul-<strong>2010</strong> Soc. <strong>de</strong> Inversiones Pampa Calichera S.A., serie A 33.360.952 29.858 56 895,009-Jul-<strong>2010</strong> Soc. <strong>de</strong> Inversiones Pampa Calichera S.A., serie A 13.000.000 11.570 22 890,00TOTALES 146.861 273PRINCIPALES COLOCACIONES DE BONOS DE EMPRESASCANTIDAD MONTO MONTOFECHA EMISOR COLOCADA COLOCADO TRANSADO REMATECOLOCACIÓN (Millones $) (MMUS$)1-Jul-<strong>2010</strong> Forum Servicios Financieros S.A. (Serie BFORU-R) UF 1.300.000 27.345 50 Holandés6-Jul-<strong>2010</strong> Banco BICE (Serie BBIC480510) UF 2.000.000 42.843 80 Holandés8-Jul-<strong>2010</strong> Scotiabank Chile (Serie BBNS-H0610) UF 1.500.000 33.537 62 Holandés8-Jul-<strong>2010</strong> Scotiabank Chile (Serie BBNS-J0610) UF 2.000.000 42.877 80 Holandés27-Jul-<strong>2010</strong> Banco Central <strong>de</strong> Chile (Serie BCU0500912) UF 1.500.000 34.936 67 Holandés27-Jul-<strong>2010</strong> Banco Central <strong>de</strong> Chile (Serie BCU0301012) UF 1.500.000 33.316 64 Holandés28-Jul-<strong>2010</strong> Banco Internacional (Serie BINT-A0710) UF 750.000 16.245 31 HolandésTOTALES 231.099 435PRINCIPALES COLOCACIONES DE EFECTOS DE COMERCIOCANTIDAD MONTO MONTOFECHA EMISOR COLOCADA TRANSADO TRANSADOCOLOCACIÓN (Nominales) (Millones $) (MMUS$)1-Jul-<strong>2010</strong> Gasco S.A. MM$ 5.000 4.974 920-Jul-<strong>2010</strong> Factorline S.A. MM$ 4.000 3.926 727-Jul-<strong>2010</strong> Compañía General <strong>de</strong> Electricidad S.A. MM$ 10.000 9.593 1828-Jul-<strong>2010</strong> Eurocapital S.A. MM$ 1.500 1.474 3TOTALES 19.967 38
ANTECEDENTES BURSATILES DE LAS SOCIEDADES INSCRITAS EN BOLSASOCIEDADES CAPITALIZACION CAPITALIZACIONRPU BOLSA/LIBROPERIODO INSCRITAS BURSATIL (MM$) BURSATIL (MM US$) (en veces) (en veces)01-2006 245 86.706.004 165.224 21,55 1,8702-2006 247 88.603.441 171.128 22,52 1,8903-2006 245 88.862.343 168.396 22,72 1,8804-2006 245 90.594.936 174.685 22,43 1,9205-2006 245 87.747.592 165.215 21,14 1,8506-2006 245 86.574.549 158.182 20,63 1,8407-2006 245 86.632.217 160.606 20,08 1,8208-2006 245 89.379.994 166.205 19,88 1,8409-2006 243 92.614.406 172.075 20,42 1,9010-2006 244 96.114.433 182.731 18,87 1,9311-2006 244 102.020.861 192.750 19,70 2,0812-2006 244 107.538.312 201.221 20,73 2,2001-2007 243 112.005.264 205.446 22,86 2,2102-2007 243 111.594.121 207.262 21,59 2,2803-2007 243 114.668.402 212.597 22,32 2,2504-2007 243 121.644.214 230.789 23,47 2,3705-2007 243 121.696.737 230.696 21,82 2,3906-2007 243 127.422.616 241.578 23,27 2,5207-2007 238 123.918.632 236.902 23,70 2,4108-2007 239 121.795.993 232.156 24,67 2,4109-2007 240 119.436.711 233.402 24,29 2,3610-2007 240 125.815.320 255.131 23,60 2,4511-2007 239 117.828.762 233.149 20,70 2,2812-2007 238 113.895.221 229.216 19,72 2,2201-2008 237 106.016.695 227.826 20,15 2,0502-2008 236 107.532.407 234.777 20,21 2,0203-2008 236 107.494.363 244.812 21,03 2,0004-2008 236 109.683.482 237.672 23,81 2,0605-2008 235 112.736.198 235.092 23,33 2,1706-2008 235 107.111.802 203.615 22,84 2,0807-2008 235 105.240.920 209.318 22,53 1,9608-2008 236 100.611.841 193.518 22,53 1,9609-2008 236 99.549.844 180.190 19,09 1,8010-2008 235 86.922.734 130.719 14,18 1,5211-2008 235 84.752.872 128.524 13,21 1,4512-2008 235 84.657.688 134.567 13,20 1,4401-2009 235 90.166.811 147.228 14,94 1,5102-2009 235 88.599.647 148.717 14,01 1,4403-2009 235 88.350.314 151.779 14,91 1,4104-2009 235 93.961.788 159.631 14,80 1,4105-2009 235 105.260.130 186.420 18,39 1,7706-2009 235 103.732.119 196.065 18,70 1,7307-2009 235 107.860.197 199.041 19,55 1,7708-2009 234 106.820.099 193.993 18,29 1,7809-2009 233 111.801.461 204.738 19,54 1,8710-2009 232 110.426.316 207.670 18,64 1,8111-2009 232 110.426.316 222.706 18,03 1,7512-2009 232 117.039.007 231.106 20,02 1,8901-<strong>2010</strong> 233 122.219.310 229.844 20,95 1,9702-<strong>2010</strong> 232 124.422.717 234.897 21,66 2,0303-<strong>2010</strong> 231 124.762.284 237.060 20,42 1,9804-<strong>2010</strong> 230 127.098.597 243.956 20,40 1,9105-<strong>2010</strong> 229 126.806.446 239.606 19,53 2,0406-<strong>2010</strong> 229 131.289.035 241.745 20,66 2,0707-<strong>2010</strong> 229 140.921.629 269.779 22,05 2,27CAPITALIZACIÓN BURSÁTIL PERÍODO 2006 - <strong>2010</strong>150.000.000140.000.000130.000.000Monto MM$120.000.000110.000.000100.000.00090.000.00080.000.000Ene-06May-06Sep-06Ene-07May-07Sep-07Ene-08May-08Sep-08Ene-09May-09Sep-09Ene-10May-10Período