EstadÃsticas Mensuales Julio 2010 - Bolsa de Santiago
EstadÃsticas Mensuales Julio 2010 - Bolsa de Santiago
EstadÃsticas Mensuales Julio 2010 - Bolsa de Santiago

You also want an ePaper? Increase the reach of your titles
YUMPU automatically turns print PDFs into web optimized ePapers that Google loves.
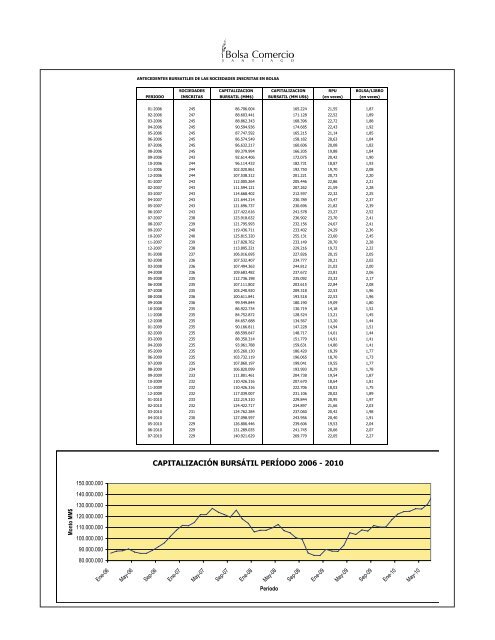
ANTECEDENTES BURSATILES DE LAS SOCIEDADES INSCRITAS EN BOLSASOCIEDADES CAPITALIZACION CAPITALIZACIONRPU BOLSA/LIBROPERIODO INSCRITAS BURSATIL (MM$) BURSATIL (MM US$) (en veces) (en veces)01-2006 245 86.706.004 165.224 21,55 1,8702-2006 247 88.603.441 171.128 22,52 1,8903-2006 245 88.862.343 168.396 22,72 1,8804-2006 245 90.594.936 174.685 22,43 1,9205-2006 245 87.747.592 165.215 21,14 1,8506-2006 245 86.574.549 158.182 20,63 1,8407-2006 245 86.632.217 160.606 20,08 1,8208-2006 245 89.379.994 166.205 19,88 1,8409-2006 243 92.614.406 172.075 20,42 1,9010-2006 244 96.114.433 182.731 18,87 1,9311-2006 244 102.020.861 192.750 19,70 2,0812-2006 244 107.538.312 201.221 20,73 2,2001-2007 243 112.005.264 205.446 22,86 2,2102-2007 243 111.594.121 207.262 21,59 2,2803-2007 243 114.668.402 212.597 22,32 2,2504-2007 243 121.644.214 230.789 23,47 2,3705-2007 243 121.696.737 230.696 21,82 2,3906-2007 243 127.422.616 241.578 23,27 2,5207-2007 238 123.918.632 236.902 23,70 2,4108-2007 239 121.795.993 232.156 24,67 2,4109-2007 240 119.436.711 233.402 24,29 2,3610-2007 240 125.815.320 255.131 23,60 2,4511-2007 239 117.828.762 233.149 20,70 2,2812-2007 238 113.895.221 229.216 19,72 2,2201-2008 237 106.016.695 227.826 20,15 2,0502-2008 236 107.532.407 234.777 20,21 2,0203-2008 236 107.494.363 244.812 21,03 2,0004-2008 236 109.683.482 237.672 23,81 2,0605-2008 235 112.736.198 235.092 23,33 2,1706-2008 235 107.111.802 203.615 22,84 2,0807-2008 235 105.240.920 209.318 22,53 1,9608-2008 236 100.611.841 193.518 22,53 1,9609-2008 236 99.549.844 180.190 19,09 1,8010-2008 235 86.922.734 130.719 14,18 1,5211-2008 235 84.752.872 128.524 13,21 1,4512-2008 235 84.657.688 134.567 13,20 1,4401-2009 235 90.166.811 147.228 14,94 1,5102-2009 235 88.599.647 148.717 14,01 1,4403-2009 235 88.350.314 151.779 14,91 1,4104-2009 235 93.961.788 159.631 14,80 1,4105-2009 235 105.260.130 186.420 18,39 1,7706-2009 235 103.732.119 196.065 18,70 1,7307-2009 235 107.860.197 199.041 19,55 1,7708-2009 234 106.820.099 193.993 18,29 1,7809-2009 233 111.801.461 204.738 19,54 1,8710-2009 232 110.426.316 207.670 18,64 1,8111-2009 232 110.426.316 222.706 18,03 1,7512-2009 232 117.039.007 231.106 20,02 1,8901-<strong>2010</strong> 233 122.219.310 229.844 20,95 1,9702-<strong>2010</strong> 232 124.422.717 234.897 21,66 2,0303-<strong>2010</strong> 231 124.762.284 237.060 20,42 1,9804-<strong>2010</strong> 230 127.098.597 243.956 20,40 1,9105-<strong>2010</strong> 229 126.806.446 239.606 19,53 2,0406-<strong>2010</strong> 229 131.289.035 241.745 20,66 2,0707-<strong>2010</strong> 229 140.921.629 269.779 22,05 2,27CAPITALIZACIÓN BURSÁTIL PERÍODO 2006 - <strong>2010</strong>150.000.000140.000.000130.000.000Monto MM$120.000.000110.000.000100.000.00090.000.00080.000.000Ene-06May-06Sep-06Ene-07May-07Sep-07Ene-08May-08Sep-08Ene-09May-09Sep-09Ene-10May-10Período