EstadÃsticas Mensuales Julio 2010 - Bolsa de Santiago
EstadÃsticas Mensuales Julio 2010 - Bolsa de Santiago
EstadÃsticas Mensuales Julio 2010 - Bolsa de Santiago

You also want an ePaper? Increase the reach of your titles
YUMPU automatically turns print PDFs into web optimized ePapers that Google loves.
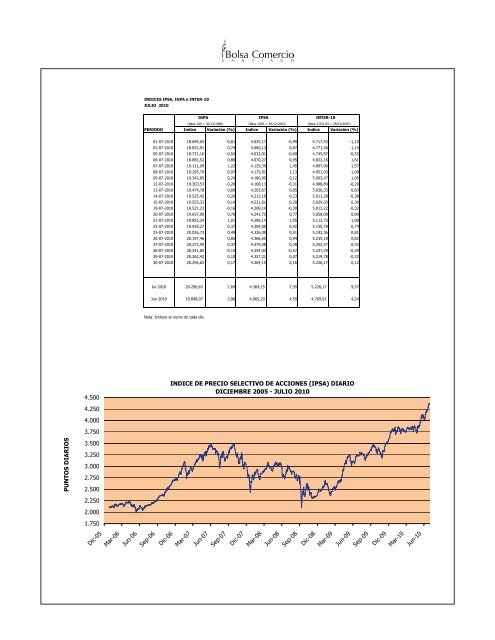
INDICES IPSA, IGPA e INTER-10JULIO <strong>2010</strong>IGPA IPSA INTER-10(Base 100 = 30/12/1980) (Base 1000 = 30/12/2002) (Base 3.051,83 = 28/12/2007)PERIODO Indice Variación (%) Indice Variación (%) Indice Variación (%)01-07-<strong>2010</strong> 18.694,65 -0,81 4.025,17 -0,99 4.717,43 -1,1002-07-<strong>2010</strong> 18.832,91 0,74 4.060,13 0,87 4.771,36 1,1405-07-<strong>2010</strong> 18.731,16 -0,54 4.032,01 -0,69 4.745,87 -0,5306-07-<strong>2010</strong> 18.881,52 0,80 4.070,27 0,95 4.822,16 1,6107-07-<strong>2010</strong> 19.111,09 1,22 4.129,39 1,45 4.897,96 1,5708-07-<strong>2010</strong> 19.295,79 0,97 4.175,91 1,13 4.951,03 1,0809-07-<strong>2010</strong> 19.342,85 0,24 4.180,95 0,12 5.003,47 1,0612-07-<strong>2010</strong> 19.303,53 -0,20 4.168,13 -0,31 4.988,89 -0,2913-07-<strong>2010</strong> 19.474,78 0,89 4.203,67 0,85 5.030,33 0,8314-07-<strong>2010</strong> 19.525,42 0,26 4.213,19 0,23 5.011,28 -0,3815-07-<strong>2010</strong> 19.553,33 0,14 4.221,61 0,20 5.029,35 0,3619-07-<strong>2010</strong> 19.521,23 -0,16 4.209,14 -0,30 5.013,22 -0,3220-07-<strong>2010</strong> 19.657,00 0,70 4.241,75 0,77 5.058,08 0,8921-07-<strong>2010</strong> 19.855,24 1,01 4.286,14 1,05 5.112,75 1,0822-07-<strong>2010</strong> 19.928,27 0,37 4.304,00 0,42 5.150,78 0,7423-07-<strong>2010</strong> 20.026,73 0,49 4.326,00 0,51 5.192,36 0,8126-07-<strong>2010</strong> 20.197,46 0,85 4.366,65 0,94 5.235,18 0,8227-07-<strong>2010</strong> 20.272,59 0,37 4.379,08 0,28 5.252,57 0,3328-07-<strong>2010</strong> 20.241,85 -0,15 4.354,03 -0,57 5.237,29 -0,2929-07-<strong>2010</strong> 20.262,42 0,10 4.357,21 0,07 5.219,78 -0,3330-07-<strong>2010</strong> 20.296,63 0,17 4.364,15 0,16 5.226,17 0,12Jul <strong>2010</strong> 20.296,63 7,69 4.364,15 7,35 5.226,17 9,57Jun <strong>2010</strong> 18.848,07 3,96 4.065,29 4,59 4.769,91 4,24Nota: Indices al cierre <strong>de</strong> cada día4.500INDICE DE PRECIO SELECTIVO DE ACCIONES (IPSA) DIARIODICIEMBRE 2005 - JULIO <strong>2010</strong>4.2504.0003.750PUNTOS DIARIOS3.5003.2503.0002.7502.5002.2502.0001.750Dic-05Mar-06Jun-06Sep-06Dic-06Mar-07Jun-07Sep-07Dic-07Mar-08Jun-08Sep-08Dic-08Mar-09Jun-09Sep-09Dic-09Mar-10Jun-10