2 - Sociedad Argentina de Genética
2 - Sociedad Argentina de Genética
2 - Sociedad Argentina de Genética
- No tags were found...

You also want an ePaper? Increase the reach of your titles
YUMPU automatically turns print PDFs into web optimized ePapers that Google loves.
ÍNDICE4 - 6Article 1 - opinionHOW CAN WE FOSTER CROP IMPROVEMENT?Pontaroli A.C.7 - 18Article 2 - opinionMÉTODOS ESTADÍSTICOS EN GENÉTICA BÁSICA Y APLICADA: POR QUÉ, CÓMO Y CUÁNTO.Babinec F.J.19 - 27Article 3 - researchTAXONOMY AND PHYLOGENETIC ANALYSIS OF ASPERGILLUS SECTION NIGRI ISOLATED FROMYERBA MATE IN MISIONES (ARGENTINA)Castrillo M.L., Fonseca M.I., Bich G.A., Jerke G., Horianski M.A., Zapata, P.D.28 - 34Article 4 - researchPOLIMORFISMO EN LOS GENES ESTEAROIL-COENZIMA A DESATURASA Y ACIL-COA:DIACILGLICEROL ACILTRANSFERASA 1 EN EL GANADO SIBONEY DE CUBAAcosta A., Uffo O., Ronda R., Fernan<strong>de</strong>s Z., Lopes F., Gomes-Filho M.A., Barbosa S.B.P.35 - 47Article 5 - researchLA APTITUD COMBINATORIA ESPECÍFICA EN EL MAÍZ (Zea mays L. ssp. mays) PARA DOBLEPROPÓSITO EN RÍO CUARTO, CÓRDOBA, ARGENTINA.Di Santo H., Castillo E., Ferreira A., Grassi E., Ferreira V.
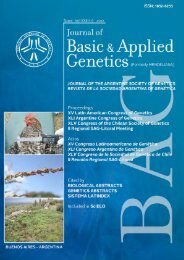
FOTOGRAFÍAS YAUTORESTapaConidióforos <strong>de</strong> Aspergillus sectionNigri.Autor: Lorena Castrillo y colaboradoresBovinos <strong>de</strong> la raza Siboney <strong>de</strong> Cuba.Autor: Atzel AcostaEnsayos comparativos <strong>de</strong> rendimientoen trigo.Autor: Rubén Miranda
HOW CAN WE FOSTER CROP IMPROVEMENT?5The fascinating history of crop improvementstarted with crop domestication, more than 10,000years ago. Since then, humans have achieved steadyincreases in crop yield, pest and disease resistance,and quality. Moreover, some breakthroughs as theGreen Revolution in the XXth century, greatlyinfluenced the life and fate of millions of humanbeings. Today, crop improvement has become akey factor for guaranteeing world food security.Asi<strong>de</strong> from the necessary moral <strong>de</strong>bates about theworld’s food distribution inequity and the use offood products for biofuels, it is unquestionable thatworld <strong>de</strong>mand for food and biofuels is growing,and will continue to do so, even un<strong>de</strong>r the mostconservative mid- and long-term prospects(DEXIA, 2010). Therefore, bree<strong>de</strong>rs today face thechallenge of having to <strong>de</strong>velop ever higher yieldingcultivars for increasingly unstable environments,while improving quality and tolerance to bioticand abiotic stresses. Also, agricultural inputs arebecoming scarce and/or more expensive, whichposes the need for more input-efficient crops. Inparticular, environmental sustainability must beguaranteed to attain stable crop production andterritorial <strong>de</strong>velopment in the long term.Over thousands of years since crop domestication,artificial phenotypic selection was the main forceleading to the fixation of a number of traits thatshape the most distinctive features of mo<strong>de</strong>rn crops,such as in<strong>de</strong>hiscence of fruits or seeds, ease ofthreshing, tolerance to high plant <strong>de</strong>nsity growth,etc. Unlike the empirical nature of this process,mo<strong>de</strong>rn breeding methodologies were <strong>de</strong>velopedstarting in the XXth century, which were based onknowledge of statistics and the genetic structure ofplant populations. Since then, great progress hasbeen achieved in crop yield, adaptation, resistanceto pests and diseases, quality and stability. In thelast few years, however, the rate of improvement incrop performance has plummeted in a number ofimportant crops such as wheat and rice (Conforti,2011). As a result of many years of breeding, severalfavorable traits, especially those with simple geneticcontrol, have been fixed in elite populations, or theycan be easily bred. The challenge now is how to <strong>de</strong>almore effectively with complex traits such as yieldand tolerance to abiotic stress, and how to increasegenetic variability for these traits while maintainingagronomic performance.In<strong>de</strong>ed, a first approach to tackle the previouslymentioned challenge could be to increase theaccuracy of phenotyping. Let’s apply an exampleto illustrate the present case. Increasing yield inbread wheat is undoubtedly a paramount objectiveof every wheat breeding program in the world.We know that yield is controlled by many genes,with a great environmental influence that causessignificant genotype x environment interactions.What would happen if we could dissect yield into itsphysiological components? The concept is far frombeing new, but a number of recent investigationshave provi<strong>de</strong>d new insights into the physiologicalmechanisms responsible for the trait, and on how toperform high throughput <strong>de</strong>termination of relevantvariables (see, for example, Reynolds et al., 2012;Abbate et al., 2012; Foulkes et al., 2012). Andra<strong>de</strong>et al. (2009) have provi<strong>de</strong>d other examples of howcrop physiology has ai<strong>de</strong>d in the elucidation of thegenetic control of key traits and their interactionwith the environment. Besi<strong>de</strong>s crop physiology,mo<strong>de</strong>rn statistical mo<strong>de</strong>ls, experimental <strong>de</strong>signsand analysis tools undoubtedly have a substantialimpact on the quality of field data generation forselection of elite materials, estimation of geneticparameters, phenotyping of mapping populations, etc.Most remarkably, crop improvement ofcomplex traits can benefit from the true scientificand technological revolution that has taken placeover the last 5-10 years in the plant sciences,particularly in the genomics field. With ~40 plantgenomes sequenced to date, among which severalimportant crop species are inclu<strong>de</strong>d (CoGePedia,http://www.genomevolution.org), and a myriad ofbioinformatics, reverse genetics, epigenetics, genetargeting and molecular marker tools availableor being <strong>de</strong>veloped, one can only envision thepotential, unimaginable outcomes of such vastbody of information and knowledge when put to theservice of crop improvement.Still, the effects of such “genomics revolution”are, in some crops, materializing less evi<strong>de</strong>ntlythan initially expected. One of the reasons for this,in my opinion, lies on the fact that the pace ofgenomic data generation largely exceeds that of theother disciplines, and that a truly interdisciplinaryapproach directed to crop breeding is often lacking.We are now having easier and easier access toinformation on candidate genes, massive SNPJournal of Basic & Applied Genetics | 2012 | Volume 23 | Issue 2 | Article 1 - opinion
6 HOW CAN WE FOSTER CROP IMPROVEMENT?discovery, whole genome selection tools, associationmapping panels, etc, even in minor crops....butwe need to make ends meet! No such thing willhappen without high quality phenotyping. Currentemphasis is being put on phenotyping platformsthat allow high-throughput analysis, and althougha most valuable tool, the core of success remainsin the collaborative, interdisciplinary work. Forinstance, and to name only some of the key playersin this en<strong>de</strong>avor, bree<strong>de</strong>rs know the target, envisionthe i<strong>de</strong>otype, <strong>de</strong>al with the genetic structure of thematerial un<strong>de</strong>r study, can provi<strong>de</strong> insights into thestrategy for reaching the target at the fastest pace....physiologists can provi<strong>de</strong> the rationale for whichphenotypic variables to <strong>de</strong>termine and the best wayto do it, genomicists can use comparative genomics,transcriptomics, proteomics, etc., to find suitablecandidate genes/markers to track...statisticians andbioinformaticians can <strong>de</strong>al with the way data aregenerated, collected, and managed effectively. Itis clear (and several scientific teams have alreadyput this into practice) that a strong interdisciplinaryeffort is nee<strong>de</strong>d to continue to improve crops as theworldneeds. In my opinion, high quality phenotypingis becoming the new bottleneck, as genotypingcosts continue to drop. The dramatically fast pace ofgenomic data generation needs to be accompaniedby a similar trend in phenotypic data generation,and aparticularemphasiswillbenee<strong>de</strong>dinfiguringouthow to organize, compile and parse phenotypic datawhile making them available to the broad scientificcommunity, as it has been done with genomic data.This is challenging, however, because there is no“common language” in phenotypic data, as it is thecase of genomic data. This might change in the nearfuture, as we are starting to see the emergence ofsuch databases and tools, like the Human Phenotype-Genotype Integrator at NCBI (http://www.ncbi.nlm.nih.gov/gap/PheGenI).In conclusion, an unprece<strong>de</strong>nted opportunity foryet another quantum leap in crop improvement restsbefore us. Now, we need to make a concerted effortto truly integrate the massive amount of knowledgegenerated into better crops for the world.REFERENCESAbbate P., Pontaroli A., Lázaro L., Gutheim F.(2012) A method of screening for spike fertilityin wheat. Journal of Agricultural Sciences(Cambridge) doi:10.1017/S0021859612000068.Andra<strong>de</strong> F., Sala R., Pontaroli A., León A. (2009)Integration of biotechnology, plant breedingand crop physiology. Dealing with complexinteractions from a physiological perspective. In:Sadras V., Cal<strong>de</strong>rini D. (Eds.) Crop Physiology:Applications for Genetic Improvement andAgronomy. Elsevier Science, New York, pp.267-276.Conforti P. (2011) Looking ahead in world food andagriculture: Perspectives to 2050. FAO, Rome,539 p.DEXIA (2010) Food scarcity–trends, challenges, solutions(Sustainability Team Discussion Paper). https://www.<strong>de</strong>xia-am.com/NR/ rdonlyres/392E9422-1E2D-4B01-8083-24EF008DD3D7/0/FOOD_ SCARCITY_11_05.pdf.Foulkes J., Rivera C., Trujillo E., Sylvester-BradleyR., Slafer G., Reynolds M. (2012) Optimizingharvest in<strong>de</strong>x through increased partitioningto the spike and maximizing grain number.In: Reynolds M. (Ed.) Proceedings of the 2ndInternational Workshop of the Wheat YieldConsortium. CENEB, CIMMYT, Cd. Obregón,Mexico, pp. 15-16.Reynolds M., Pask A., Mullan D. (2012)Physiological breeding I: Interdisciplinaryapproaches to improve crop adaptation. Mexico,D.F., CIMMYT, 174 p.Journal of Basic & Applied Genetics | 2012 | Volume 23 | Issue 2 | Article 1 - opinion
MÉTODOS ESTADÍSTICOS EN GENÉTICA10otro modo, se busca explicar la variabilidad presenteen la variable respuesta, separándola en partes quepue<strong>de</strong>n ser explicadas <strong>de</strong> otras que no pue<strong>de</strong>n serlo,lo que es la base <strong>de</strong>l análisis <strong>de</strong> varianza (ANOVA).La estadística aplicada se basa en la estimación <strong>de</strong>parámetros y en la prueba <strong>de</strong> hipótesis, <strong>de</strong>bidas a R.Fisher y a J. Neyman y E. Pearson, respectivamente;ambos casos requieren cumplimentar algunossupuestos, en particular sobre la distribución <strong>de</strong> laparte no explicada por el mo<strong>de</strong>lo propuesto. Estossupuestos, que en sí son condiciones in<strong>de</strong>mostrables(Mead, 1990), se refieren tanto a la in<strong>de</strong>pen<strong>de</strong>ncia<strong>de</strong> las observaciones como a la distribución <strong>de</strong> losvalores observados y/o <strong>de</strong> los residuales <strong>de</strong>l mo<strong>de</strong>lo,o sea <strong>de</strong> la fracción no explicada por el mismo.Algunas técnicas, como el ANOVA, requieren unadistribución normal (gaussiana) <strong>de</strong> los residuales,a diferencia <strong>de</strong> otras a las que se <strong>de</strong>nomina noparamétricaso <strong>de</strong> distribución libre. El estudio<strong>de</strong> los residuales pue<strong>de</strong> llevarnos a transformar laescala <strong>de</strong> la variable respuesta, <strong>de</strong> la explicativa, o<strong>de</strong> ambas, para ajustar una distribución normal <strong>de</strong>los mismos (Fernán<strong>de</strong>z, 1992), o a la opción <strong>de</strong>métodos no paramétricos (Potvin y Roff, 1993) o alempleo <strong>de</strong> mo<strong>de</strong>los mixtos (Paterson y Lello, 2003;Piepho, 2003; 2004) o generalizados (Patersony Lello, 2003; Bolker et al., 2008), en lugar <strong>de</strong>ltradicional ANOVA.La Tabla 1, adaptada <strong>de</strong> Motulsky (1995) y <strong>de</strong>Tabachnick y Fid<strong>de</strong>ll (2000) presenta algunos <strong>de</strong> losmétodos más usados en función <strong>de</strong> los objetivos <strong>de</strong> lainvestigación, <strong>de</strong> la escala en la que son registradaslas variables observadas y <strong>de</strong> su condición, esto es,su jerarquía <strong>de</strong>ntro <strong>de</strong> las hipótesis <strong>de</strong> trabajo y <strong>de</strong>si están bajo control <strong>de</strong>l investigador o no. Estosmétodos se estudian en la mayor parte <strong>de</strong> los cursos<strong>de</strong> estadística aplicada en programas <strong>de</strong> grado yposgrado, pero son sólo una parte <strong>de</strong> una bateríamuy extensa <strong>de</strong> pruebas disponibles para tratardistintas situaciones y por ello estas tablas sólo sonorientativas. El libro <strong>de</strong> Sheskin (2011) en su quintaedición, contiene más <strong>de</strong> 300 pruebas estadísticaspara análisis uni y bivariados.A consecuencia <strong>de</strong> la existencia cada vez másfrecuente <strong>de</strong> gran<strong>de</strong>s bases <strong>de</strong> datos generadas por elinstrumental <strong>de</strong> laboratorio disponible (Kahn, 2011)y el continuo <strong>de</strong>sarrollo <strong>de</strong> nuevas metodologías,vemos una constante renovación <strong>de</strong> los métodosaplicados (Wang et al., 2011), algunos con nombressugestivos como re<strong>de</strong>s neuronales o árboles <strong>de</strong><strong>de</strong>cisión entre otros (Nie<strong>de</strong>rberger, 1996; Sanogoy Yang, 2004). Ciertos métodos basados en el usointensivo <strong>de</strong> los datos, llamados <strong>de</strong> remuestreo(resampling, bootstrapping, jackknife) han ganadopopularidad dado el avance en la capacidad <strong>de</strong>cálculo <strong>de</strong> las computadoras personales (Yu, 2003).La mirada BayesianaEn los últimos años el enfoque bayesiano ha ganadoespacio frente al tradicional o frecuentista, sobretodo en áreas <strong>de</strong> la medicina y <strong>de</strong> la economía,pero también en ecología (Reckhow, 1990; Dennis,1996 y trabajos allí citados) y en agronomía (Milay Carriquiry, 2004; Edwards y Jannick, 2006;Costes et al., 2006). Para explicar la diferenciacon el enfoque clásico o frecuentista seguiremos aGajewski y Simon (2008). Los métodos bayesianospermiten combinar la información previa con losdatos observados. La información previa pue<strong>de</strong>obtenerse <strong>de</strong> estudios realizados previamente o <strong>de</strong>opinión experta. Partiendo <strong>de</strong>l teorema <strong>de</strong> BayesInformación total = Información histórica + Datosque en la literatura bayesiana vemos mencionarcomo “distribución posterior”, “verosimilitud(likelihood)” y “distribución previa (prior)”,respectivamente. Vemos que el análisis (posterior) esuna combinación <strong>de</strong>l conocimiento <strong>de</strong>l investigadorsobre el fenómeno bajo estudio antes <strong>de</strong> realizarla experiencia con los que se apren<strong>de</strong> <strong>de</strong> los datosobtenidos al concretarla. En el análisis clásicoInformación total = Datosla información previa no juega ningún rol, y sólose tienen en cuanta los datos. Conceptualmente,en ausencia <strong>de</strong> información previa, ambos modos<strong>de</strong> analizar brindan los mismos resultados. Dicho<strong>de</strong> otro modo, el enfoque bayesiano nos permiteactualizar el conocimiento existente con nuevainformación. En teoría, es una alternativa simplea la inferencia estadística conocida a partir <strong>de</strong> ladistribución posterior. Pero en la práctica, estasólo pue<strong>de</strong> obtenerse analíticamente en casosmuy sencillos, y la solución sólo pue<strong>de</strong> obtenerseJournal of Basic & Applied Genetics | 2012 | Volume 23 | Issue 2 | Article 2 - opinion
11 MÉTODOS ESTADÍSTICOS EN GENÉTICAcomputacionalmente usando métodos <strong>de</strong> simulación(Monte Carlo principalmente), generando muestras<strong>de</strong> la distribución posterior y estimando losparámetros <strong>de</strong> interés a partir <strong>de</strong> las mismas. Dosaspectos cruciales son la elección <strong>de</strong> la distribuciónprevia y si se alcanza o no la convergencia; en caso<strong>de</strong> elección <strong>de</strong> una distribución previa ina<strong>de</strong>cuadao <strong>de</strong> no llegar a la convergencia, las inferenciasson tanto imprecisas como confusas o directamenteerróneas (Christensen 2005).Ambos enfoques, clásico o frecuentista ybayesiano, tiene sus pros y contras. Usando un punto<strong>de</strong> vista pragmático (Chatfield, 2002) la elección<strong>de</strong>pen<strong>de</strong> <strong>de</strong>l objetivo: si se dispone <strong>de</strong> informaciónprevia que se quiere incorporar al análisis, loindicado sería usar un método bayesiano, que tienela ventaja <strong>de</strong> presentar resultados en términos <strong>de</strong>probabilidad más accesibles. El enfoque bayesianopermite respon<strong>de</strong>r cuestiones específicas mejorque un estimador puntual clásico. Pero si se estáinteresado en la estimación <strong>de</strong> parámetros, aúnen casos complejos, no es necesario recurrir amétodos bayesianos (SAS Institute, 2008). Pero unamirada más rigurosa (Dennis, 1996) enfatiza que laadopción <strong>de</strong> uno u otro enfoque implica una distintafilosofía <strong>de</strong> la ciencia en cada caso, y la adopcióno rechazo <strong>de</strong> ciertos conceptos centrales como elrol <strong>de</strong> la aleatorización, valores <strong>de</strong> p e intervalos<strong>de</strong> confianza. Una introducción interesante aluso <strong>de</strong> métodos bayesianos y su aplicación enepi<strong>de</strong>miología se encuentra en Greenland (2006;2007); véase también el artículo <strong>de</strong> Cressie et al.(2009) y la discusión subsiguiente en la revistaEcological Applications, y la sección “BayesianAnalysis: Advantages and Disadvantages” en elmanual <strong>de</strong> SAS (2008).Programas estadísticosLa revolución estadística se ha visto complementada,posibilitada y potenciada por la disponibilidad <strong>de</strong>programas <strong>de</strong> computación que permiten aplicar acualquier conjunto <strong>de</strong> datos los métodos reseñados.Los hay gratuitos y disponibles en la Web, para usoen bioestadística como el Epi-Info (http://wwwn.cdc.gov/epiinfo/) o el G-Stat (www.g-stat.es/),algunos específicos para métodos no paramétricos(MSTAT, http://mcardle.oncology.wisc.edu/mstat),otros concebidos para las necesida<strong>de</strong>s <strong>de</strong> programas<strong>de</strong> mejoramiento genético vegetal (Crop-Stat,www.irri.org), o para investigaciones en genéticacomo el InfoGen en su versión estudiantil (www.info-gen.com.ar, Balzarini y Di Rienzo, 2011).Otros permiten un gran número <strong>de</strong> análisis através <strong>de</strong> comandos organizados en “scripts” y sononerosos como SAS (www.sas.com) o GenStat yAS-REML (http://www.vsni.co.uk/) o gratuitoscomo R (www.r-project.org/). El programaWinBUGS (http://www.mrc-bsu.cam.ac.uk/bugs/)es el más usado para aplicar métodos bayesianos.Escapa a esta reseña la mención <strong>de</strong> los programasespecíficos para los estudios a nivel molecularpor su número y rápida evolución. La variedad <strong>de</strong>métodos disponibles en los programas estadísticosy la facilidad <strong>de</strong> su uso, en muchos casos lleva a unanálisis impropio y a una interpretación equivocada<strong>de</strong> la información contenida en los datos (Appleton,1995c). Para un uso eficiente es necesario reconocerla estructura subyacente en los mismos (Appleton,1995a; 1995b), y elegir los programas estadísticospara cubrir las necesida<strong>de</strong>s reales <strong>de</strong> análisis queenfrentamos a partir <strong>de</strong> un estudio integral <strong>de</strong> losmismos (Li et al., 2011).Algunos problemas actualesAlgunos temas <strong>de</strong> la investigación en genéticabásica y aplicada y su correspondiente análisisestadístico han recibido un tratamiento intensivo enlos últimos 25 años (Carbonell y Bramardi, 2001;Gianola, 2001). El primero <strong>de</strong> ellos, en un or<strong>de</strong>narbitrario, es la interacción genotipo x ambiente, queconstituye un <strong>de</strong>safío constante para el <strong>de</strong>sarrollo<strong>de</strong> nuevas varieda<strong>de</strong>s (Annichiarico, 2002). Elanálisis <strong>de</strong> series <strong>de</strong> experimentos a escala regional,nacional, e incluso mundial, en base a métodosuni y multivariados (Yue et al., 1997; Flores etal., 1998) ha dado lugar a un continuo avance enel mejoramiento genético y a establecer nuevosconceptos como el <strong>de</strong> mega-ambientes (Gauchy Zobel, 1997). Los estudios a nivel molecular(Speed y Zhou, 2009, y otros trabajos incluidosJournal of Basic & Applied Genetics | 2012 | Volume 23 | Issue 2 | Article 2 - opinion
MÉTODOS ESTADÍSTICOS EN GENÉTICA12en ese número <strong>de</strong> Statistical Methods in MedicalResearch) han generado inmensas bases <strong>de</strong> datoscuyo análisis requiere <strong>de</strong>sarrollar nuevos métodos(Terwilliger y Göring, 2009; Kahn, 2011; Ogutuet al., 2012). Un aspecto que no pue<strong>de</strong> pasarsepor alto es la dificultad en replicar los resultados<strong>de</strong> este tipo <strong>de</strong> estudios (Ioannidis et al 2008). Labúsqueda <strong>de</strong> nuevas fuentes <strong>de</strong> germoplasma y lacaracterización <strong>de</strong> las colecciones <strong>de</strong> poblaciones yrazas implican un a<strong>de</strong>cuado estudio <strong>de</strong> la diversidadusando distintas técnicas multivariadas (Hu et al.,2000; Carbonell y Bramardi, 2001; Balzarini et al.,2011). El mejoramiento animal también ha generadogran<strong>de</strong>s masas <strong>de</strong> datos, cuyo análisis requirió el<strong>de</strong>sarrollo <strong>de</strong> nuevos conceptos como el <strong>de</strong> BLUPs(predictores insesgados) y <strong>de</strong> métodos tales comolos mo<strong>de</strong>los mixtos, que luego se han generalizado(Pianola, 2001; Littell, 2011). Pue<strong>de</strong> verse que ladirección actual es la integración <strong>de</strong> información <strong>de</strong>distintas fuentes y el tratamiento <strong>de</strong> gran<strong>de</strong>s bases<strong>de</strong> datos.CodaEl paso final <strong>de</strong> toda investigación es la presentación<strong>de</strong> los resultados y su interpretación en congresos oen trabajos publicados en revistas científicas y luego<strong>de</strong> divulgación, si cabe. El uso <strong>de</strong> tablas, gráficosy figuras (Wainer, 1992) permite una comprensiónrápida, aunque en la práctica suele estar limitadoal empleo <strong>de</strong> gráficos <strong>de</strong> barras o <strong>de</strong> dispersión sinmedidas <strong>de</strong>l error (Cooper et al., 2002) generadospor hojas <strong>de</strong> cálculo, con sus limitaciones (Vidmar,2007). Cada instancia <strong>de</strong> publicación tiene susnormas propias, pero hay buenas guías quepue<strong>de</strong>n seguirse, sobre todo para la presentacióngráfica (Yan<strong>de</strong>ll, 2007). La disponibilidad <strong>de</strong>herramientas y sobre todo <strong>de</strong> conceptos y guíassobre comunicación efectiva (Pocock et al., 2008)<strong>de</strong>berían permitirnos presentar claramente nuestrosresultados y conclusiones.OBJETIVODATOS ANALIZADOSCONTINUOS ORDINALES BINARIOS SUPERVIVENCIADescribir un grupo Media, Desvío Media, Rango IQ Proporción Curva Kaplan-MeierComparar con un valorteóricot Stu<strong>de</strong>nt Wilcoxon Chi cuadradoPrueba binomial?Comparar dos gruposin<strong>de</strong>pendientesComparar + <strong>de</strong> 2 gruposin<strong>de</strong>pendientest Stu<strong>de</strong>nt muestrasin<strong>de</strong>pendientesANOVA a una víaMann-WithneyKruskal-WallisJonckheere-TerpstraFisherChi cuadradoChi cuadradoLog-rank testMantel-HaenzselRegresión <strong>de</strong> CoxComparar 2 gruposrelacionadost Stu<strong>de</strong>nt muestrasapareadasWilcoxon McNemar Regresión <strong>de</strong> riesgosproporcionalesComparar + <strong>de</strong> 2 grupos ANOVA a dos vías Friedman Q Cochran ?relacionadosAsociación entre 2 Correlación Pearson Correlación Spearman Coeficientes ?variablescontingenciaPre<strong>de</strong>cir 1 variable Reg linear/no linear Reg no paramétrica Reg logística Regresión <strong>de</strong> Coxsimple/múltiple Sen-AdichieAsociación entre + <strong>de</strong> 2 Correlación canónica ?Análisis <strong>de</strong> ?variablesfrecuencias multivíaEstablecer unaestructuraComponentesprincipalesAnálisis <strong>de</strong> correspon<strong>de</strong>ncia ?Mo<strong>de</strong>los <strong>de</strong> ecuaciones estructurales ?Asignar observaciones a Análisis discriminante ? Análisis logit ?gruposEstablecer unaclasificaciónTécnicas <strong>de</strong> agrupamiento ?Tabla 1. Sinopsis <strong>de</strong> los métodos estadísticos más usados, adaptada <strong>de</strong> Motulsky (1995) y <strong>de</strong> Tabachnicky Fid<strong>de</strong>ll (2000). Ver texto para <strong>de</strong>finiciones y métodos alternativos.Journal of Basic & Applied Genetics | 2012 | Volume 23 | Issue 2 | Article 2 - opinion
13 MÉTODOS ESTADÍSTICOS EN GENÉTICACONCLUSIÓN¿Significa todo esto que <strong>de</strong>bemos conocery/o emplear todos los métodos? En modo alguno.Después <strong>de</strong> todo, si enten<strong>de</strong>mos qué implica hablar<strong>de</strong> media o mediana, <strong>de</strong>svío (y error estándar) orango, e intervalo <strong>de</strong> confianza, y sabemos cuándousar chi cuadrado, t <strong>de</strong> Stu<strong>de</strong>nt, regresión linear yANOVA, po<strong>de</strong>mos enten<strong>de</strong>r la mayor parte <strong>de</strong> lostrabajos publicados (Reed et al., 2003; Al-Benna etal., 2010). Pero es necesario que los investigadoressean conscientes <strong>de</strong> las alternativas disponibles, yelijan la metodología <strong>de</strong> análisis con criterio amplio.Citando un manual <strong>de</strong> 1992 <strong>de</strong> la Auditoríaestadouni<strong>de</strong>nse (US General Accounting Office),para que una investigación sea fructífera se requiere(1) la comprensión <strong>de</strong> una amplia gama <strong>de</strong> métodos<strong>de</strong> análisis <strong>de</strong> datos, (2) la planificación temprana <strong>de</strong>la forma en que se analizarán los datos y la revisión<strong>de</strong> los métodos a medida que el trabajo avanza, (3)i<strong>de</strong>ntificar cuáles métodos respon<strong>de</strong>n mejor a laspreguntas formuladas en el estudio, dados los datosobtenidos, y (4) una vez que el análisis ha finalizado,reconocer cómo las <strong>de</strong>bilida<strong>de</strong>s presentes en losdatos y/o en el análisis afectan las conclusionesque se han extraído (traducción libre <strong>de</strong>l autor).Hoy es posible para cualquier investigador ponera prueba mediante simulación la metodología <strong>de</strong>análisis empleada y otras alternativas (MacArdley An<strong>de</strong>rson 2004). Conviene tener presente que notodos los hallazgos y <strong>de</strong>scubrimientos informadosson luego confirmados, sea por una planificaciónin<strong>de</strong>cuada, una técnica experimental imperfecta oun análisis incorrecto (cf. Begley y Ellis 2012).AGRADECIMIENTOSMi interés en este tema proviene <strong>de</strong> sendoscursos dictados por María Inés Oyarzábal y JorgeMariotti hace tiempo. Una versión previa fue leída ycomentada por Valeria Borelli y Valeria Paccapelo, yElsa Camadro me estimuló a concluirla. Los errores,omisiones y arbitrarieda<strong>de</strong>s son responsabilidadmía.Varias i<strong>de</strong>as provenen <strong>de</strong> una presentación a unamesa redonda organizada por Martín Grondona enel seno <strong>de</strong>l Grupo Argentino <strong>de</strong> Biometría en 2006.BIBLIOGRAFÍAAl-Benna S., Al-Ajam Y., Way B., SteinstraesserL. (2010) Descriptive and inferential statisticalmethods used in burns research. Burns 36: 343-346.Altman D. (1982) Statistics in medical journals.Stat. Med. 1: 59-71.Altman D.G., Gore S.M., Gardner M.J., Pocock S.J.(1983) Statistical gui<strong>de</strong>lines for contributors tomedical journals. BMJ 286: 1489-1493.Annicchiarico P. (2002) Genotype x environmentinteractions. Challenges and opportunities forplant breeding and cultivar recommendations.FAO Plant Production and Protection Paper 174.Appleton D.R. (1995a, b, c) Pitfalls in theinterpretation of studies: I, II, III. J. Roy. Soc.Med. 88: 2-4, 188-190, 241-243.Bailar J.C., Mosteller F. (1988) Gui<strong>de</strong>lines forstatistical reporting in articles for medicaljournals. Ann. Int. Med. 108: 266-278.Balding D.G. (2006) A tutorial on statisticalmethods for population association studies.Nature Reviews Genetics 7: 781-791.Balzarini M., Di Rienzo J. (2011) InfoGen versión2011. FCA, Universidad Nacional <strong>de</strong> Córdoba,<strong>Argentina</strong>.Balzarini M., Teich I., Bruno C., Peña A. (2011)Making genetic biodiversity measurable: Areview of statistical multivariate methodsto study variability at gene level. Rev. FCAUNCuyo 43: 261-275.Bateson W. (1908) The methods and scope ofGenetics. Cambridge University Press. (http://www.esp.org/foundations/genetics/classical/holdings/b/wb-methods-08.pdf)Journal of Basic & Applied Genetics | 2012 | Volume 23 | Issue 2 | Article 2 - opinion
15 MÉTODOS ESTADÍSTICOS EN GENÉTICAFisher R.A. (1960) The <strong>de</strong>sign of experiments,Seventh Edition. Oliver and Boyd, Edinburgh.Flores F., Moreno M.T., Cubero J.I. (1998) Acomparison of univariate and multivariatemethods to analyze environments. Field CropsRes. 56: 271-286.Gajewski B.J., Simon S.D. (2008) A one-hourtraining seminar on bayesian statistics fornursing graduate stu<strong>de</strong>nts. The AmericanStatistician 62: 190-194.Garrett K.A., Mad<strong>de</strong>n L.V., Hughes G., Pfen<strong>de</strong>rW.F. (2004) New applications of statistical toolsin plant pathology. Phytopathology 94: 999-1003.Gauch H.G., Zobel R.W. (1996) Optimal replicationin selection experiments. Crop Sci. 36: 838-843.Gauch H.G., Zobel R.W. (1997) I<strong>de</strong>ntifying megaenvironmentsand targeting genotypes. CropSci. 37: 311-326.Geng S., Hills F.J. (1978) A procedure for<strong>de</strong>termining numbers of experimental andsampling units. Agronomy Journal 70: 441-444.Gianola D. (2001) Statistics in animal breeding. In:Raftery A.E., Tanner M.A., Wells M.T. (Eds)“Statistics in the 21st Century”. Chapman&Hall/CRC, Boca Raton, pp. 34-41.Gianola D. (2002) Los métodos estadísticos enel mejoramiento genético. In: Car<strong>de</strong>llinoR., Car<strong>de</strong>llino R. (Eds.) “Genética Animal:Contribuciones en homenaje al Profesor Ing. Agr.Jaime Rovira”. Hemisferio Sur, Montevi<strong>de</strong>o,pp. 61-90. http://www.ansci.wisc.edu/facstaff/Faculty/pages/gianola/genetic_improvement.pdfGould W.R., Steiner R.L. (2003) Viewpoint:Improving range science through the appropriateuse of statistics. J. Range Manage. 55: 526-529.Greenland S. (2006) Bayesian perspectives forepi<strong>de</strong>miological research: I. Foundations andbasic methods. Int. J. Epi<strong>de</strong>miol. 35: 765-775.Greenland S. (2007) Bayesian perspectives forepi<strong>de</strong>miological research: II. Regressionanalysis. Int. J. Epi<strong>de</strong>miol. 36: 195-202.Hacking I. (2007) The laboratory style of thinkingand doing. A lecture at the Science, Technologyand Society Workshop, National Tsing HuaUniversity Monday 12 th November 2007(Accesed 04/05/09).Hager W. (2000) About some misconceptions andthe discontent with statistical tests in psychology.Methods of Psychological Research Online, 5:1-31. http://www.psychologie.<strong>de</strong>/fachgruppen/metho<strong>de</strong>n/mpr-online/issue9/art1/hager.pdfHanson W.D. (1959) Minimum Family Sizesfor the Planning of Genetic Experiments.Agronomy Journal 51: 711-715.Holland J.B., Nyquist W.E., Cervantes-MartinezC.T. (2003) Estimating and interpretingheritability for plant breeding: An update. In:Janick J. (Ed.) Plant breeding reviews. Wiley,New York, Vol. 22, pp. 9-111.Hu J., Zhu J., Xu H.M. (2000) Methods ofconstructing core collections by stepwiseclustering with three sampling strategies basedon the genotypic values of crops. Theor. Appl.Genet. 101: 264-268.Hua X., Spilke J. (2011) Variance–covariancestructure and its influence on variety assessmentin regional crop trials. Field Crops Research120: 1-8.Ioannidis J.P.A., Allison D.B., Ball C.A., CoulibalyI., Cui X, Culhane A.C., Falchi M, FurlanelloC., Game L., Jurman G., Mangion J., Mehta T.,Nitzberg M, Page G.P, Petretto E., van NoorV.(2012) Repeatability of published microarraygene expression analyses. Nature Genetics41:149-155.Kahn S.D. (2011) On the future of genomic data.Science 331: 728-729.Journal of Basic & Applied Genetics | 2012 | Volume 23 | Issue 2 | Article 2 - opinion
MÉTODOS ESTADÍSTICOS EN GENÉTICA16Kearsey M.J., Farquhar A.G.L. (1998) QTL analysis inplants; where are we now?. Heredity 80: 137-142.Lawson A.B., Cressie N. (2000) Spatial statisticalmethods for environmental epi<strong>de</strong>miology. In:Handbook of Statistics, Vol 18, pp. 357-396.Elsevier, HolandaLi B., Lingsma H.F., Steyerberg E.W., LesaffreE. (2011) Logistic random effects regressionmo<strong>de</strong>ls: a comparison of statistical packagesfor binary and ordinal outcomes. BMC MedicalResearch Methodology 11: 77 (http://www.biomedcentral.com/1471-2288/11/77, accessed26/03/2011).Lin C.S., Binns M.R., Lefkovitch L.P. (1986)Stability analysis: Where do we stand?. CropSci. 26: 894-900.Littelll R.C. (2011) The evolution of linear mo<strong>de</strong>lsin SAS: A personal perspective. Paper 325-2011,SAS Global Forum 2011.MacArdle B.H., An<strong>de</strong>rson M.J. (2004) Varianceheterogeneity, transformations, and mo<strong>de</strong>ls ofspecies abundance: a cautionary tale. Can. J.Fish- Aquat. Sci. 61:1294-1302.Machado S., Petrie S.R. (2006) Symposium-Analysisof unreplicated experiments-Introduction. CropSci. 46: 2474-2475.Maindonald J.H. (1984) Use of statistical evi<strong>de</strong>ncein some recent issues of DSIR agriculturaljournals. NZ J. Agric. Res. 27: 597-610.Mather K. (1938) The measurement of linkage inheredity. Methuen, London.Matson P., Potvin C., Travis J. (1993) Statisticalmethods: An upgra<strong>de</strong> for ecologists. Ecology74: 161-161.McLean R.A., San<strong>de</strong>rs W.L., Stroup W.W. (1991)A unified approach to mixed linear mo<strong>de</strong>ls. TheAm. Stat. 45: 54-64.Mead R. (1990) The <strong>de</strong>sign of experiments.Cambridge Univ. Press. Cambridge.Mila A.L., Carriquiry A.L. (2004) Bayesian analysisin plant pathology. Phytopathology 94: 1027-1030.Moll R.H., Robinson H.F. (1967) Quantitativegenetic investigations of yield of maize. DerZüchter 37: 192-205.Montana G. (2006) Statistical methods in genetics.Briefings in Bioinformatics 7: 297-308.Motulsky H.J. (1995) Intuitive biostatistics. OxfordUniversity Press, New York.Nelson L.A., Rawlings J.O. (1983) Ten commonmisuses of statistics in agronomic research andreporting. J. Agron. Educ. 12: 100-105.Nie<strong>de</strong>rberger C. (1996) Computational tools for themo<strong>de</strong>rn andrologist. J. Androl. 17: 462-466.Nelsen T.C. (2002) The state of statistics inagricultural science. Journal of Agricultural,Biological, and Environmental Statistics, 7:313-319.Ogutu J.O., Schulz-Streeck T., Piepho H.P.(2012) Genomic selection using regularizedlinear regression mo<strong>de</strong>ls: ridge regression,lasso, elastic net and their extensions. BMCProceedings 2012, 6 (Suppl 2): S10.Onofri A., Carbonell E.A., Piepho H.P., MortimerA.M., Cousens R.D. (2010) Current statisticalissues in Weed Research. Weed Research 50:5-24.Paterson S, Lello J (2003) Mixed mo<strong>de</strong>ls: gettingthe best use of parasitological data. Trends inParasitology 19:370–375.Payne R.W. (2006) New and traditional methods forthe analysis of unreplicated experiments. CropSci. 46: 2476-2481.Journal of Basic & Applied Genetics | 2012 | Volume 23 | Issue 2 | Article 2 - opinion
17 MÉTODOS ESTADÍSTICOS EN GENÉTICAPiepho H.P., Büchse A., Emrich K. (2003) Ahitchhiker’s gui<strong>de</strong> to the mixed mo<strong>de</strong>l analysis ofrandomized experiments. Journal of Agronomyand Crop Science 189: 310-322.Piepho H.P., Büchse A., Richter C. (2004) A mixedmo<strong>de</strong>lling approach for randomized experimentswith repeated measures. Journal of Agronomyand Crop Science 190: 230-240.Platt R.W. (1997) Logistic regression and oddsratios. Inj. Prev. 3: 294.Platt R.W. (1998a) ANOVA, t tests, and linearregression. Inj. Prev. 4: 52-53.Platt R.W. (1998b) Exploratory analysis: what to dofirst. Inj. Prev. 4: 140.Pocock S., Travison T., Wruck L. (2008) How tointerpret figures in reports of clinical trials. BMJ336 (7654): 1166-1169.Potvin C., Roff D. (1993) Distribution-free androbust statistical methods: Viable alternatives toparametric statistic. Ecology 74: 1617-1628.Potvin C., Travis J. (1993) Concluding remarks: Adrop in the ocean… Ecology 74: 1674-1676.Quackenbush J. (2002) Microarray datanormalization and transformation. NatureGenetics 32: 496-501.Reckhow K.H. (1990) Bayesian inference in nonreplicate<strong>de</strong>cological studies. Ecology 71: 2953-2059.Reed J.F., Salen P., Bagher P. (2003) Methodologicaland statistical techniques: What do resi<strong>de</strong>ntsreally need to know about statistics? J. Med.Syst. 27: 233-238.Rosa G.J., Steibel J.P., Tempelman R.J. (2005)Reassessing <strong>de</strong>sign and analysis of two-colourmicroarray experiments using mixed effectsmo<strong>de</strong>ls. Comp. Funct. Genomics 6 (3): 123-31.Sanogo S., Yang X.B. (2004) Overview of selectedmultivariate statistical methods and their use inphytopathological research. Phytopathology 94:1004-1006.SAS Institute Inc (2008) Introduction to BayesianAnalysis Procedures. In: SAS/STAT 9.2 User´sGui<strong>de</strong>, Ch. 7. SAS Institute, Inc., Cary, NC. pp.141-179.Scheiner S.M. (1993) Introduction: Theories,Hypotheses, and Statistics. In: Scheiner S.M.,Gurevitch J. (Eds.) Design and Analysis ofEcological Experiments, Chapman and Hall,New York, NY, pp. 1-13.Scheiner S.M. (2010) Toward a conceptualframework for biology. The Quarterly Reviewof Biology 85: 293-318.Sheskin D. (2011) Handbook of parametric andnonparametric statistical procedures Fifth ed.Chapman & Hall/CRC, Boca Raton, Florida.Speed T., Zhao H. (2009) Microarrays. Stat MethodsMed. Res. 18 (6): 531-532.Stevens S.S. (1946) On the theory of scales ofmeasurement. Science, New Series, Vol. 103:677-680.St-Pierre N.R. (2007) Design and analysis of penstudies in the animal sciences. J. Dairy Sci. (E.Suppl) 90: E87-E99.Tabachnick B.G., Fid<strong>de</strong>ll L.S. (2000) UsingMultivariate Statistics, Fourth Edition. Allenand Bacon, New York.Tempelman R.J. (2009) Assessing experimental<strong>de</strong>signs for research conducted on commercialdairies. Journal of Dairy Science 92: 1-15.Terwilliger J.D., Göring H.H.H. (2009) Genemapping in the 20 th and 21 st centuries: Statisticalmethods, data analysis, and experimental <strong>de</strong>sign.Human Biology 81: 663-728.Journal of Basic & Applied Genetics | 2012 | Volume 23 | Issue 2 | Article 2 - opinion
MÉTODOS ESTADÍSTICOS EN GENÉTICA18US General Accounting Office (1992) Quantitativedata analysis: An introduction. Transfer paper10.1.11. (http://www.gao.gov/assets/80/76118.pdf).Yue G.L., Roozeboom K.L., Schapaugh W.T., LiangG.H. (1997) Evaluation of soybean cultivarsusing parametric and nonparametric stabilityestimates. Plant Breed. 116: 271-275.van Putten B., Knippers T., Buurman P. (2010) On<strong>de</strong>sign and statistical analysis in soil treatmentexperiments. Soil Science 175: 519-529.Velleman P.F., Wilkinson L. (1993) Nominal,ordinal, interval, and ratio typologies aremisleading. Am. Statistician 47: 65-72.Vidmar G. (2007) Statistically sound distributionplots in Excel. Metodološki Zvezki 4: 83-98.Wainer H. (1992) Un<strong>de</strong>rstanding graphs and tables.Educational Researcher 21: 14-23.Wang D., Eskridge K.M., Crossa J. (2011)I<strong>de</strong>ntifying QTLs and epistasis in structuredplant populations using adaptive mixedlasso. Journal of Agricultural, Biological, andEnvironmental Statistics 16: 170-184.Warren W.G. (1986) On the presentation ofstatistical analysis: reason or ritual. Can. J. For.Res. 16: 1185-1193.White T.L. (1984) Designing nursery experiments.In: Duryea M.L., Landis T.D. (Eds.) Forestnursery manual: Production of barerootseedlings. Martinus Nijhoff/Dr W. JunkPublishers. The Hague/Boston/Lancaster, forForest Research Laboratory, Oregon StateUniversity. Corvallis. 386 pp. Chapter 28.Wilkinson L., APA Task Force on Statistical Inference(1999) Statistical methods in psychologyjournals: gui<strong>de</strong>lines and explanations. AmericanPsychologist 54: 594-604.Yan<strong>de</strong>ll B.S. (2007) Graphical data presentation,with emphasis on genetic data. Hort. Science42: 1047-1051.Yu C.H. (2003) Resampling methods: concepts,applications, and justification. PracticalAssessment, Research & Evaluation 8 (19).Accessed December 1, 2005.Journal of Basic & Applied Genetics | 2012 | Volume 23 | Issue 2 | Article 2 - opinion
ISSN: 1852-6233TAXONOMY AND PHYLOGENETIC ANALYSIS OFASPERGILLUS SECTION NIGRI ISOLATED FROM YERBAMATE IN MISIONES (ARGENTINA)Castrillo M.L.¹*, Fonseca M.I.¹, Bich G.A.¹, Jerke G.¹,Horianski M.A.¹, Zapata, P.D.¹¹Laboratorio <strong>de</strong> Biotecnología Molecular. Módulo <strong>de</strong> Farmacia y Bioquímica. Facultad <strong>de</strong> CienciasExactas Químicas y Naturales, Universidad Nacional <strong>de</strong> Misiones.Av. Mariano Moreno 1375. CP 3300. Posadas, Misiones, <strong>Argentina</strong>. Tel. +54 376 4427687.* mlc_827@hotmail.comABSTRACTMembers of Aspergillus section Nigri are distributed worldwi<strong>de</strong> and are potentially ochratoxin A producers; some of them are used at industriallevel as source of extracellular enzymes and organic acids. The taxonomy of this section comprises one of the most complex and confusing of genusAspergillus. The objectives of present work were to study the phylogeny of Aspergillus section Nigri and their taxonomy by amplifying ITS1, 5.8Sand ITS2 regions. We analyzed 14 strains of Aspergillus section Nigri isolated from different commercial forms of yerba mate, classified accordingto morphology. Genomic DNA was extracted, the ITS regions were amplified with universal primers ITS1 and ITS4, and the obtained fragmentswere sequenced. The obtained sequences were aligned and edited to a size of 532bp, to carry out phylogenetic analyses using TNT program. Weused 100 RAS+TBR cycles to search for the most parsimonious tree, which was supported by booststrap and Jackknife with 1000 resampledmatrices. From the analysis of parsimony, one hundred trees were obtained with 568 steps. Bootstrap and Jackknife analyses exhibited similartopology and minor differences in their supported values, showing that section Nigri is distributed in two general clusters: one composed of A.niger, A. carbonarius and A. heteromorphus cla<strong>de</strong>s, and the other composed of A. aculeatus and A. homomorphus cla<strong>de</strong>s, separated from differentsections of genus Aspergillus.Key words: Aspergillus section Nigri; taxonomy; ribosomal DNARESUMENLas especies <strong>de</strong> Aspergillus sección Nigri están distribuidas mundialmente y son consi<strong>de</strong>radas potenciales productores <strong>de</strong> ocratoxina A; algunas<strong>de</strong> ellas se usan a nivel industrial como fuentes <strong>de</strong> enzimas extracelulares y ácidos orgánicos. La taxonomía <strong>de</strong> esta sección compren<strong>de</strong> una <strong>de</strong>las más complejas y confusas <strong>de</strong>l género Aspergillus. El objetivo <strong>de</strong>l presente trabajo fue estudiar la filogenia <strong>de</strong> Aspergillus sección Nigri y sutaxonomía mediante la amplificación <strong>de</strong> la región ITS1, 5,8S e ITS2. Analizamos 14 cepas <strong>de</strong> Aspergillus sección Nigri asiladas <strong>de</strong> diferentesformas comerciales <strong>de</strong> yerba mate, clasificadas <strong>de</strong> acuerdo a su morfología. Se extrajo ADN genómico, las regiones ITS fueron amplificadas conlos cebadores universales ITS1 e ITS4, y los fragmentos obtenidos fueron secuenciados. Las secuencias obtenidas fueron alineadas y editadas aun tamaño <strong>de</strong> 532pb, para realizar un análisis filogenético con el programa TNT. Para averiguar el árbol más parsimonioso, usamos 100 ciclosRAS+TBR, respaldados con 1000 repeticiones por análisis Bootstrap y Jackknife. Del análisis <strong>de</strong> parsimonia, se obtuvieron 100 árboles con 568pasos. Ambos análisis, Bootstrap y Jackknife, mostraron topología similar y diferencias mínimas en sus valores respaldados, mostrando que lasección Nigri está distribuida en dos grupos generales: uno compuesto por los clados A. niger, A. carbonarius y A. heteromorphus; y el otrocompuesto por los clados A. aculeatus y A. homomorphus, separados <strong>de</strong> las <strong>de</strong>más secciones <strong>de</strong>l género Aspergillus.Palabras clave: Aspergillus sección Nigri; Taxonomía; ADN ribosomalJournal of Basic & Applied Genetics | 2012 | Volume 23 | Issue 2 | Article 3 - research
ASPERGILLUS SECTION NIGRI20INTRODUCTIONThe three major genera of mycotoxin-producingfungi are Aspergillus, Fusarium and Penicillium.These fungi frequently contaminate foods, usuallycausing severe biological alterations to human andanimal health (Franco, 2005; Castrillo, 2010).Members of Aspergillus section Nigri are themost important in the genus. They are ubiquitouslydistributed worldwi<strong>de</strong>, growing on a wi<strong>de</strong> varietyof substrates and being consi<strong>de</strong>red as responsiblefungi for food spoilage (Domsch et al., 1980; Pittand Hocking, 1997; Abarca et al., 2004; Geiser etal., 2007). Some of them are a common source ofextracellular enzymes and organic acids that areused in food processing (Yokotsuka and Sasaki,1998; Abarca et al., 2004). Moreover, Aspergillusniger products hold the GRAS (GenerallyRecognized As Safe) status from the FDA (Fe<strong>de</strong>ralDrugs and Foods Administration, USA) (Abarcaet al., 2004). However, the potential capacity toproduce mycotoxins by these species suppose arisk for human and animal health. Due to theirbiotechnological importance and because they areresponsible of food spoilage, the i<strong>de</strong>ntification ofsuch strains needs to be unambiguous (Abarca etal., 2004).The taxonomy of black aspergilli constitutesone of the most complex and confusing in genusAspergillus; therefore, several taxonomic schemeshave been proposed. Classical taxonomy forclassification of species is primarily based onmorphological criteria, such as forms and conidialornamentations, size of conidia, conidiophorestructures, and coloration of colonies, amongothers (Klich, 2002). Molecular techniques havecontributed to these studies and allowed significantadvances in fungal taxonomic organization.Ribosomal DNA (rDNA) amplification was oneof the first applications of the Polymerase ChainReaction (PCR) in mycology (White et al., 1990).The rDNA unit is constituted of regions thatpossess highly preserved genes, as the 18S and 28Sregions, and universal primers were <strong>de</strong>signed toallow internal transcribed spacers amplification ofany fungus, in<strong>de</strong>pen<strong>de</strong>ntly of genus. The amplifiedregion comprises ITS1, 5.8S and ITS2 regions,which can have variable nucleoti<strong>de</strong> sequences(Fungaro, 2000), and are commonly used to examinephylogenetic positions or relationships at species orintraspecies level (Lee et al., 2000).For many years, several authors have discussedthe composition of section Nigri, taking into accountmorphological data and using rDNA sequences forphylogenetic analyses. Raper and Fennell (1965)produced the most comprehensive monograph ofthe genus and all Aspergillus species with conidialheads in some sha<strong>de</strong>s of black were inclu<strong>de</strong>d inthe same group. They accepted twelve speciesand two varieties for Aspergillus section Nigri.Al-Musallam (1980) revised the taxonomy of thisgroup of fungi using cluster analysis involving allavailable morphological and cultural parameters,and established five easily distinguishable speciesand the A. niger cla<strong>de</strong>. The apparently insignificantdifferences between the members of A. niger cla<strong>de</strong>was the <strong>de</strong>cisive reason why Al-Musallam suggestedthat some of the species recognized by Raper andFennell (1965) should be reclassified as varieties.Later, Kozakiewicz (1989) ma<strong>de</strong> a new proposalbased upon conidial ornamentations, suggestedalterations in the A. niger cla<strong>de</strong>, and distinguished16 taxa.The previously mentioned classifications ofAspergillus section Nigri were solely based onmorphological criteria and the <strong>de</strong>limitation of sometaxa is problematic because they are distinguishedby relatively small differences in variable characters(Parenicova et al., 2000; Varga et al., 2003; Abarcaet al., 2004; Samson et al., 2004).New molecular approaches have shown thatthere is a high biodiversity in Aspergillus sectionNigri, but that species are occasionally difficultto recognize based solely on their phenotypiccharacters (Samson et al., 2007). Using this type ofapproaches, 19 species of Aspergillus section Nigriwere accepted (Samson et al., 2007; Noonim et al.,2008; Perrone et al., 2008). More recently, Vargaet al. (2011) reported that Aspergillus section Nigriinclu<strong>de</strong>s 26 taxa.Changes in the species concept of black aspergilliaccording to different authors are shown in Table 1.As a further contribution, the aims of this paperwere to study the phylogeny of Aspergillus sectionNigri and their taxonomy by amplifying ITS1, 5.8Sand ITS2 regions.Journal of Basic & Applied Genetics | 2012 | Volume 23 | Issue 2 | Article 3 - research
21 ASPERGILLUS SECTION NIGRITable 1. Species concepts of black aspergilli according to various authors.Raper and Fennel (1965)Al-Musallam (1980)Kozakiewicz (1989)Samson et al. (2007); Perrone etal. (2008)Varga et al. (2011)A. japonicus SaitoA. aculeatus IizukaA. japonicus var. japonicus SaitoA. japonicus var. aculeatus_Iizuka_ Al-MusallamA. japonicus SaitoA. atroviolaceus Moss.A. aculeatinus – CBS 121060 –ITS EU159211A. aculeatus - CBS 172.66 –AJ279988A. acidus - CBS 564.65 – ITS AJ280009= A. coreanus - CBS 119384 – ITSFJ491684A. aculeatinus - CBS 121060 – ITSEU159211A. carbonarius _Bainier_ ThomA. carbonarius _Bainier_ ThomA. carbonarius _Bainier_ ThomA. brasiliensis - CBS 101740 –AJ280010A. aculeatus - CBS 172.66 – ITSAJ279988A. heteromorphus Batista andMaiaA. heteromorphus Batista and MaiaA. fonsecaeus Thom and RaperA. carbonarius – CBS 111.26 –ITS DQ900605A. awamori - CBS 557.65 – ITSAM087614A. ellipticus Raper and FennellA. ellipticus _Raper and Fennell_Al-MusallamA. heteromorphus Batista andMaiaA. costaricaensis – CBS 115574 –ITS DQ900602A. brasiliensis - CBS 101740 – ITSAJ280010A. niger van TieghemA. helicothrix Al-MusallamA. ellipticus Raper and FennellA. ellipticus – CBS 707.79 – ITSAJ 280014A. carbonarius - CBS 111.26 – ITSDQ900605A. ficuum _Reichard_ HenningsA. niger aggregate:A. helicothrix Al-MusallamA. foetidus – CBS 564.65 – ITSAJ280009A. costaricaensis - CBS 115574 -DQ900602A. tubingensis _Schöber_MosserayA. niger var. niger van Tiegh.A. niger var. niger van Tiegh.A. heteromorphus – CBS 117.55 –ITS AJ280013A. ellipticus - CBS 707.79 – ITSAJ280014A. phoenicis _Corda_ ThomA. niger var. niger f. hennebergii_Blochwitz Al-MusallamA. niger var. tubingensis _Moss._KozakiewiczA. homomorphus - CBS 101889 –ITS EF166063A. eucalypticola - CBS 122712 –ITS EU482439A. pulverulentus _McAlp_ ThomA. awamori NakazawaA. niger var. phoenicis _Corda_Al-MusallamA. niger var. phoenicis f.pulverulentus McAlp Al-MusallamA. niger var. phoenicis _Corda_Al-MusallamA. niger var. pulverulentus_McAlp_ KozakiewiczA. ibericus - CBS 121593 – ITSAY656625A. japonicus - CBS 114.51 – ITSAJ279985A. fijiensis - CBS 119.49 – ITSFJ491679A. foetidus - CBS 121.28 – ITSFJ491683 = A. lacticoffeatus - CBS101883 – ITS DQ900604A. foetidus _Naka._ Thom andRaperA. niger var. awamori _Nakazawa_Al-MusallamA. niger var. awamori_Nakazawa_ Al-MusallamA. lacticoffeatus - CBS 101883 –ITS DQ900604A. heteromorphus - CBS 117.55 –ITS AJ280013A. foetidus var. pallidus Naka.,Simo and WatanabeA. niger var. nanus _Mont._ Al-MusallamA. niger var. ficuum _Reich._KozakiewiczA. niger - CBS 554.65 – ITSAJ223852A. homomorphus - CBS 101889 –ITS EF166063Raper A. foetidus and Fennel var. (1965) acidus Naka.,Simo and WatanabeA. Al-Musallam niger var. usamii (1980) _Sakaguchi etal._ Al-MusallamA. Kozakiewicz citricus var. (1989) citricus _Wehmer_Moss.A. Samson piperis et - CBS al. (2007); 112811 Perrone – ITSDQ900603 et al. (2008)A. Varga ibericus et al. -(2011)CBS 121593 – ITSAY656625A. niger var. intermedius _Speg._Al-MusallamA. acidus KozakiewiczA. sclerotiicarbonarius - CBS121057 – ITS EU159216A. indologenus - CBS 114.80 –ITS AL 280005A. foetidus Thom and RaperA. citricus var. pallidus _Naka.,Simo and Watanabe KozakiewiczA. sclerotioniger - CBS115572 – ITS DQ900603A. japonicus - CBS 114.51 – ITSAJ279985A. tubingensis - CBS 134.48 –ITS AJ223853A. neoniger - CBS 115656 – ITSFJ491682A. uvarum - CBS 121591 – ITSAM745751A. niger - CBS 554.65 – ITSAJ223852A. va<strong>de</strong>nsis - CBS 113365 –ITS AY585549A. piperis - CBS 112811 – ITSDQ900603A. saccharolyticus - CBS 127449– ITS HM853552A. sclerotiicarbonarius - CBS121057 – ITS EU159216A. sclerotioniger - CBS 115572 –ITS DQ900606A. tubingensis - CBS 134.48 – ITSAJ223853A. uvarum – CBS 121.595 – ITSJQ 316520A. va<strong>de</strong>nsis - CBS 113365 – ITSAY585549A. violaceofuscus - CBS 123.27 –ITS FJ491678Table 1. Species concepts of black aspergilli according to various authors.Journal of Basic & Applied Genetics | 2012 | Volume 23 | Issue 2 | Article 3 - research
ASPERGILLUS SECTION NIGRI22MATERIALS AND METHODSBiological materialThe strains used in this study were 14 isolatesbelonging to Aspergillus section Nigri of threecommercial yerba mate forms: five strains frommilled yerba mate, without ageing (referred asYMCHA); four strains from elaborated yerba mate(referred as YMA); and 5 strains from composedyerba mate (referred as YMCA). In addition, twoAspergillus carbonarius OTA+ standard strainswith known capacity to produce ochratoxin wereinclu<strong>de</strong>d, which were provi<strong>de</strong>d by the University ofBuenos Aires (UBA).The section Nigri strains initially were classifiedby microbiological classic methods, using Klich(2002) co<strong>de</strong>s, by taking into account main macroandmicro-morphology criteria.Extraction of genomic DNAThe fungal strains isolated from different commercialyerba mate forms were sown in YES (Yeast ExtractSucrose) liquid medium in or<strong>de</strong>r to obtain largeamounts of mycelium. Mycelia was filtered andwashed with Tris-HCl 0.1 M (pH 8) EDTA 0.02 M(pH 8). DNA extraction was carried out with buffersolution (Tris-HCl 0.1 M pH8, NaCl 1.5 M, EDTA0.05 M pH8) at 60º C, containing Proteinase K0.1mg/mL, β-mercaptoethanol 10mM and SDS 2 %(p/v). DNA was purified with chloroform: isoamilycalcohol (24:1 v/v) and potassium acetate 3M, andthen was precipitated with isopropyl alcohol(Fonseca, 2012).Amplification of ribosomal DNARibosomal DNA fragments (ITS1 – 5.8S – ITS2) of14 isolates of section Nigri and two A. carbonariusOTA+ standard strains, were amplified andsequenced. For the amplification reaction primersITS1, 5’ TTCGTAGGTGAACCTGCGG, and ITS4,5’ TCCTCCGCTTATTGATATGC (White et al.,1990) were used. The amplification reactions wereprepared in a final volume of 20 µL, containing buffer1X; MgCl2 2.5 mM; dNTP 200 µM; 10 pMol of eachprimer; Taq DNA polymerase 0.5 U and templateDNA 5 ng/µL. PCR cycling was programmed to 35cycles after an initial <strong>de</strong>naturation of 4 min at 94º C.Each amplification cycle consisted of the followingsteps: <strong>de</strong>naturation (94º C, 40 s), hybridization (50ºC, 40 s), and extension (72º C, 40 s). Finally, a finalextension of 10 min at 72º C was realized.Agarose gels at 1% (p/v) and 2% (p/v) wereperformed, containing 10 mg/mL of ethidiumbromi<strong>de</strong>, visualized with UV transiluminator, andfinally photographed with digital camera. Gelscontaining 1% (p/v) agarose were used to visualizegenomic DNA and those with 2 % (p/v) agarosewere used to visualize PCR products.The concentration of DNA samples was semiquantifiedby comparison to the intensity of themarker.Sequencing of the regions ITS1 – 5.8S – ITS2Sequencing reactions of PCR products wereperformed by Macrogen sequencing services(Kumchun-ku, Seoul, Korea).Bioinformatic study of the obtained sequencesThe obtained sequences were compared with those<strong>de</strong>posited in Database of the National Center forBiotechnology Information (NCBI, www.ncbi.nlm.nih.gov), with BLAST Search tool. SequencedITS1-5.8S-ITS2 regions and the sequences ofinterest retrieved from NCBI database were alignedby using the CLUSTAL W sequence editor on-lineversion (Thompson et al., 1994). The alignmentswere trimmed, overhangs were removed and gapswere corrected, prior to phylogenetic calculationswith BIOEDIT software (Sequence AlignmentEditor), for obtaining sequences of the same size andalso for comparing the same regions. The sequenceswere submitted to Database of the National Centerfor Biotechnology Information (accession numbers:JF318957, JF436881, JF436882, JF436883,JF436884, JF436885, JF436886, JF436887,JF436888, JF436889, JF436890, JF436891,JF436892, JF436893, JF436894, JF436895).To allow an appropriate phylogenetic analyses,sequences of Aspergillus section Nigri that wereJournal of Basic & Applied Genetics | 2012 | Volume 23 | Issue 2 | Article 3 - research
23 ASPERGILLUS SECTION NIGRIcited in Abarca et al. (2004) and Varga et al. (2011)were inclu<strong>de</strong>d in the present study (accessionnumbers: AJ280009, EU159211, AM087614,AJ280010, DQ900605, FJ491684, DQ900602,AJ280014, EU482439, FJ491679, FJ491683,AJ280013, EF166063, AY656625, JX291167.1,JQ316520.1, AJ279985, DQ900604, FJ491682,AJ223852, DQ900603, EU159216, HM853552,DQ900606, AJ223853, AY585549, FJ491678,L76747.1, AB000535, AF128852, AF203800,AJ000933, AY373938).The parsimony analyses were performed withTNT version 1.1 (Willi Hennig Society Edition).Two methods were used: Bootstrap (Felsenstien,1985) and Parsimony Jackknifing (Farris et al.,1996). Both analyses inclu<strong>de</strong>d 1000 resampledmatrices. The existence of local optima for data setsbeyond 40–50 taxa has long been well-informed(Maddison, 1991). In all analyses, Emericellanidulans CBS 12135 (AJ000933) was used as anout-group.RESULTSAnalysis of genomic DNA amplificationNucleic acid extraction of 14 fungal isolates fromdifferent commercial yerba mate forms (previouslyi<strong>de</strong>ntified as species of Nigri section) and two A.carbonarius OTA+ standard strains were analyzed.The PCR reaction with primers ITS1 and ITS4amplified a fragment of approximately 600 bp foreach isolate. The size of the amplified product wasin close agreement with the expected fragment sizein Aspergillus species (563 to 613 bp, according toWhite et al., 1990).Bioinformatics study of the obtained sequencesThe obtained sequences of each isolated werecompared with <strong>de</strong>posited sequences in NCBIdatabase, using BLAST as a search tool. In mostcases, the high i<strong>de</strong>ntity values obtained allowed usto assure that these species belong to Aspergillussection Nigri, always with i<strong>de</strong>ntity values above98 %. Seven strains of yerba mate (referred asYMCHA 73, YMCHA 71, YMCHA 55, YMA120, YMA 119, YMA 10 and YMCA 29) weremorphologically and molecularly <strong>de</strong>fined as A.niger; three strains (referred as YMCHA 69, YMCA18 and YMCA 2) were <strong>de</strong>fined as A. tubingensis;and one strain (referred as YMCHA 63) was <strong>de</strong>finedas A. brasiliensis; all strains belong to the A. nigercla<strong>de</strong>. In addition, two standard strains (referredas PATRON I and PATRON II) were <strong>de</strong>fined asA. carbonarius, that belongs to the A. carbonariuscla<strong>de</strong> (Figure 1). However, three isolates of yerbamate (referred as YMCA 11, YMA 2 and YMCA 9)were morphologically <strong>de</strong>fined only as Aspergillussection Nigri species, and molecularly <strong>de</strong>fined asAspergillus spp. (Figure 1).Phylogenetic AnalysesGood quality sequences of approximately 600 bpwere first aligned and then trimmed, and sequences532 bp in size were obtained, prior to carrying outphylogenetic calculations.Study of parsimony was done using Bootstrapand Jackknife analyses. Parsimony analysis resultedin 100 equally parsimonious trees 568 steps long,performing 100 RAS + TBR cycles. Our data setconsisted of 134 parsimony informative characters.Both, analyses, Bootstrap and Jackknife, yiel<strong>de</strong>dnearly the same topology, and presented minimaldifferences in support values. Our trees showed thatall isolated strains of yerba mate are inclu<strong>de</strong>d in theA. niger and A. carbonarius cla<strong>de</strong>s, except for theisolated strain referred as YMCA 11 (Figure 1).DISCUSSIONUntil a few years ago, systematic studies ofmicroorganisms were based almost exclusively onmorphological criteria (classical microbiologicalclassification). However, the number of toolsactually used in systematic studies has increased.Nowadays, both morphological and molecularcriteria are taken into account (Perez Valencia et al.,2005).In this study, and for taxonomic organization offungi, were consi<strong>de</strong>red the classical microbiologicalclassification by morphological criteria andmolecular techniques by amplification of ITS1,Journal of Basic & Applied Genetics | 2012 | Volume 23 | Issue 2 | Article 3 - research
ASPERGILLUS SECTION NIGRI24Figure 1. Phylogenetic analysis. Group support, assessed with 1000 Bootstrapping and Parsimony Jackknifing replicates.Numbers above branches correspond to Bootstrap support. Jackknife supports are given in parentheses.Journal of Basic & Applied Genetics | 2012 | Volume 23 | Issue 2 | Article 3 - research
25 ASPERGILLUS SECTION NIGRI5.8S and ITS2 regions. These regions are commonlyused in fungi because they are composed of variablenucleoti<strong>de</strong>s sequences that allow the examination ofphylogenetic positions or relationships at species orintraspecies level (Fungaro, 2000; Lee et al., 2000).In Aspergillus section Nigri there are verysubtle differences between species, being forthis reason one of the most difficult groups forclassification and i<strong>de</strong>ntification. Consequently,classical microbiological criteria are insufficientfor classification (Abarca et al., 2004; Varga et al.,2011). In this study, and by applying morphologicalcriteria, we could accurately classify the isolatedstrains at the species level. However, it was necessaryto confirm the morphological classification withmolecular information obtained by amplificationof ITS1, 5.8S and ITS2 regions and by contrastingthem with those in NCBI database. Classicalmicrobiological classification and molecular dataensured the correct strain classification at the genuslevel.Most of the isolated strains belonged toAspergillus section Nigri, invariably with highi<strong>de</strong>ntity values, except in three cases (YMCA11, YMA 2 y YMCA 9) which could only bemorphologically <strong>de</strong>fined as Aspergillus sectionNigri and molecularly <strong>de</strong>fined as Aspergillus spp.,reflecting the confusing and complex taxonomy ofthis section. These exceptional cases either maybelong to the A. niger aggregate or the bioinformaticsanalysis using solely the ITS conserved regions wasinsufficient for the correct molecular i<strong>de</strong>ntificationof Aspergillus section Nigri. Some authors havecited other conserved regions as useful for molecularclassification, such as the calmodulin or parts of β-tubulin sequences (Peterson, 2000; Abarca et al.,2004; Varga et al., 2011).With respect to the phylogenetic analysis ofAspergillus section Nigri, in previous studies withamplification of ITS regions, Parenicova et al.(2000) reported that A. carbonarius could be easilydistinguished from other black aspergilli. They citedthat A. carbonarius forms a separate cla<strong>de</strong> withinthe biseriate black aspergilli. Then, Parenicova etal. (2001) reported that ITS sequences could beused to distinguish uniseriate aspergilli in a separatecla<strong>de</strong> from a general cla<strong>de</strong> containing biseriatespecies and species belonging to section Flavi andCircumdati; but could not be used for differentiationwithin uniseriate species.In this study, were observed four differentgeneral cla<strong>de</strong>s of Aspergillus strains, section Flavi,section Circumdati, and two general clusters ofsection Nigri: one general cluster containing A.aculeatus and A. homomorphus cla<strong>de</strong>s; and theother general cluster with A. heteromorphus cla<strong>de</strong>and A. niger cla<strong>de</strong> which inclu<strong>de</strong>s A. carbonariuscla<strong>de</strong>. A. carbonarius formed a separate branch intoA. niger cla<strong>de</strong> (biseriate species), as reported byParenicova et al. (2000). But then, it was observedthat in Aspergillus section Nigri, both biseriate(A. niger, A. carbonarius, A. heteromorphus andA. homomorphus cla<strong>de</strong>s) and uniseriate species(A. aculeatus cla<strong>de</strong>) formed two general cla<strong>de</strong>sseparated from section Flavi cla<strong>de</strong> and sectionCircumdati cla<strong>de</strong> (Figure 1). It was not observedthat the uniseriate species formed a separate cla<strong>de</strong>from all others, as previously cited by Parenicovaet al. (2000).Based on phylogenetic analysis of ITS sequencedata, Varga et al. (2011) reported that Aspergillussection Nigri formed two general clusters: one clustercontaining A. aculeatus and A. homomorphus cla<strong>de</strong>sand the other cluster containing A. heteromorphuscla<strong>de</strong> and A. niger cla<strong>de</strong> with A. carbonarius cla<strong>de</strong>,as observed in this study.In this phylogenetic analysis it is possible tovisualize that some of the isolated strains of yerbamate belong to A. niger cla<strong>de</strong> so it can be arguedthat YMA 2 and YMCA 9 strains, which weremorphologically <strong>de</strong>fined as Aspergillus sectionNigri and molecularly <strong>de</strong>fined as Aspergillus spp.,also belong to section Nigri cla<strong>de</strong>. Likewise, it wasobserved that YMCA 11 strain belongs to sectionFlavi; it was molecularly referred as A. flavus, beingthe only strain that was poorly characterized byclassical microbiological methods (Figure 1).In addition, parsimony analyses performedwith Bootstrap and Jackknife methods, revealingminimal differences between the values obtainedwith both methods; this allows us to assure that thephylogenetic analyses performed were consistentand also they were in accordance with other currentreports (Varga et al., 2011).Moreover, in this study, and in or<strong>de</strong>r to observewhether toxin production had implications forphylogeny, were consi<strong>de</strong>red sequences of knownspecies with OTA capability, as PenicilliumJournal of Basic & Applied Genetics | 2012 | Volume 23 | Issue 2 | Article 3 - research
ASPERGILLUS SECTION NIGRI26verrucosum, Aspergillus ochraceus and patterns Iand II strains. The results did not show that thesespecies were part of the same cla<strong>de</strong>, the ochratoxinA production does not seem to have implications onthe phylogeny of ochratoxin A-producing specieswhen ITS sequences were consi<strong>de</strong>red (Figure 1).Some authors reported that a chloroperoxidase genepresumably takes part in ochratoxin biosynthesisin P. verrucosum, so the use of this sequence onphylogenetic analysis can be useful for discriminatethe ochratoxin A-producing species from others(Geiser et al., 2007; Varga et al., 2011).Our results show that Aspergillus section Nigrihas a polyphyletic origin and that it is composed oftwo general clusters, one containing A. aculeatusand A. homomorphus cla<strong>de</strong>s and the othercontaining A. heteromorphus cla<strong>de</strong> and A. nigercla<strong>de</strong> which inclu<strong>de</strong>s A. carbonarius cla<strong>de</strong>. Also,the uniseriate species (A. aculeatus cla<strong>de</strong>) did notappear as a different group in relation to the biseriatespecies in Aspergillus genus phylogeny. We canalso conclu<strong>de</strong> that the taxonomic classification ofAspergillus section Nigri still remains as confusingand complex topic, and to date, it is necessary totake several precautions for studying the phylogenyof Aspergillus section Nigri.LITERATURE CITEDAbarca M.L., Accensi F., Cano J., Cabañes F.J.(2004) Taxonomy and significance of blackAspergilli. Anton van Leeuwnhoek Inter. J. Gen.and Molec. Microbiol. 86: 33-49.Al-Musalllam A. (1980) Revision of the blackAspergillus species. Thesis. University ofUtrecht, The Netherlands.Castrillo M.L. (2010) Caracterización morfológicay confirmación molecular <strong>de</strong> Aspergillussección Nigri aislados <strong>de</strong> yerba mate (Ilexparaguariensis). Tesis <strong>de</strong> Grado. Fac. Cs.Exactas, Qcas. y Naturales, UNAM. Misiones,<strong>Argentina</strong>.Domsch K.H., Gams W., An<strong>de</strong>rson T.H. (1980)Compendium of soil fungi. Acad. Press, London,UK.Farris J.S., Albert V.A., Källersjö M., LipscombD., Kluge A.G. (1996) Parsimony Jackknifingoutperforms Neighbor-Joining. Cladistics 12:99-124.Felsenstein J. (1985) Confi<strong>de</strong>nce limits onphylogenies, an approach using the Bootstrap.Evolution 38: 16-24.Fonseca M.I. (2012) Utilización <strong>de</strong> hongos <strong>de</strong>pudrición blanca <strong>de</strong> la provincia <strong>de</strong> Misiones enprocesos <strong>de</strong> biopulpado: Aspectos bioquímicosy moleculares <strong>de</strong> sistemas ligninolíticosinvolucrados y prospección biotecnológica.Tesis Doctoral, Fac. Bqca, Qca y Fcia, UNT.Tucumán, <strong>Argentina</strong>.Franco E. (2005) Aspergillus sección Nigri,estudio fisiológico y molecular <strong>de</strong> especiesocratoxigénicas. Tesis Doctoral, Fac. Veterinaria,UAB. Barcelona, España.Fungaro M.H.P. (2000) PCR na Micologia.Biotecnol. Ciênc. e Desenvol. 17: 12-16.Geiser D.M., Klich M.A., Frisvad J.C., PetersonS.W., Varga J., Samsom R.A. (2007) The currentestatus of species recongnition and i<strong>de</strong>ntificationin Aspergillus. Study Mycol. 59: 1-10.Klich M.A. (2002) I<strong>de</strong>ntification of commonAspergillus species. Centraalbureau voorschimmelcultures, Utrecht, The Netherlands.Kozakiewicz Z. (1989) Aspergillus species on storedproducts. Mycological Papers 161: 1-188.Lee J.S., Ko K.S., Jung H.S. (2000) Phylogeneticanalysis of Xylaria based on nuclearribosomal ITS1-5.8S-ITS2 sequences. FEMSMicrobiology Letters 187: 89-93.Maddison D. (1991) The discovery and importanceof multiple islands of most parsimonious trees.Syst. Zool. 40: 315-328.Noonim P., Mahakarnchanakul W., Varga J., FrisvadJ.C., Samson R.A. (2008). Two new speciesof Aspergillus section Nigri from Thai coffeeJournal of Basic & Applied Genetics | 2012 | Volume 23 | Issue 2 | Article 3 - research
27 ASPERGILLUS SECTION NIGRIbeans. International Journal of Systematic andEvolutionary Microbiology 58: 1727-1734.Parenicova L., Kester H.C., Benen J.A., VisserJ. (2000) Characterization of a novelendopolygalacturonase fron Aspergillus nigerwith unique kinetic properties. FEBS Lett. 2-3:333-336.Parenicova L., Skouboe P., Frisvad J., Samson R.A.,Rossen L., ten Hoor-Suykerbuyk M., Visser J.(2001) Combined molecular and biochemicalapproach i<strong>de</strong>ntifies Aspergillus japonicus andAspergillus aculeatus as two species. Appl.Environ. Microbiol. 2: 521-527.Pérez Valencia L.I., Santerre A., VillallobosArámbula A.R., Galván Corona A., Torres-Torres M.G., Rodríguez Contreras A., GuzmánDávalos L. (2005) Extracción <strong>de</strong> DNA yamplificación <strong>de</strong> secuencias <strong>de</strong>l ITS <strong>de</strong>l DNAr<strong>de</strong> Gano<strong>de</strong>rma (Fungí, Basidiomycetes) para suuso en el análisis filogenético. CUCBA. 8 pp.Perrone G., Varga J., Susca A., Frisvad J.C., Stea G.(2008) Aspergillus uvarum sp. nov., an uniseriateblack Aspergillus species isolated from grapesin Europe. International Journal of Systematicand Evolutionary Microbiology 58: 1032-1039.Peterson S.T. (2000) Phylogenetic relationships inAspergillus based on rDNA sequence analysis.In: Samson R.A., Pitt J.I. (Eds) Integration ofmo<strong>de</strong>rn taxonomic methods for Penicilliumand Aspergillus classification. Harw. Acad.Publishers, Amsterdam, The Netherlands, pp.323-355.Samson R.A., Noonim P., Meijer M., Houbraken J.,Frisvad J.C., Varga J. (2007) Diagnostic tools toi<strong>de</strong>ntify black Aspergilli. Studies in Mycology59: 129-146.Thompson J.D., Higgins D.G., Gibson T.J. (1994)CLUSTAL W, improving the sensitivity ofprogresive multiple sequence alignment throughsequence weighting, position-specific gappenalties and weight matrix choice. Nucl. Acids.Res. 22: 4673-4680.Varga J., Rigó K., Tóth B., Téren J., KozakiewiczZ. (2003) Evolutionary relationships amongAspergillus species producing economicallyimportant micotoxins. Food Technol.Biotechnol. 41: 29-36.Varga J., Frisvad J.C., Kocsubé S., Brankovics B.,Tóth B., Szigeti G., Samson R.A. (2011) Newand revisited species in Aspergillus sectionNigri. Studies Mycol. 69: 1-17.White T.J., Burns T., Lee S., Taylor J. (1990)Amplification and direct sequencing of fungalribosomal RNA genes for phylogenetics. In:Innis M.A., Gelfand D.H., Sninsky J.J., WhiteT.J. (Eds.) PCR Protocols: A gui<strong>de</strong> to methodsand applications. Acad Press, San Diego, pp.315-322.Yokotsuka T., Sasaki M. (1998) Fermented proteinfoods in the Orient: shoyu and miso in Japan. In:Wood B.J.B. (Ed.) Microbiology of fermentedfoods. Blackie Acad. and Profess, London.Pitt J.I., Hocking A.D. (1997) Fungi and FoodSpoilage. Ed. Blackie Acad. and Profess.London. UK.Raper K.B., Fennell D.I. (1965) The genusAspergillus. Willians and Wilkins, Baltimore.Samson R.A., Houbraken J., Kuijpers A., MickF.J., Frisvad J. (2004) New ochratoxin A orsclerotium species in Aspergillus section Nigri.Studies Mycol. 50: 46-61.Journal of Basic & Applied Genetics | 2012 | Volume 23 | Issue 2 | Article 3 - research
ISSN: 1852-6233POLIMORFISMO EN LOS GENES ESTEAROIL-COENZIMAA DESATURASA Y ACIL-COA: DIACILGLICEROLACILTRANSFERASA 1 EN EL GANADO SIBONEY DE CUBAAcosta A. 1 *, Uffo O. 1 , Ronda R. 1 , Fernan<strong>de</strong>s Z. 2 , Lopes F. 3 ,Gomes-Filho M.A. 2 , Barbosa S.B.P. 31Laboratorio <strong>de</strong> Genética Molecular (GenMol), Centro Nacional <strong>de</strong> Sanidad Agropecuaria (CEN-SA) PO Box 10, San José <strong>de</strong> las Lajas, CP 32700, Mayabeque, Cuba.2Laboratório Fisiologia Animal Molecular Aplicada (FAMA), Departamento <strong>de</strong> Morfologia eFisiologia Animal, Universida<strong>de</strong> Fe<strong>de</strong>ral Rural <strong>de</strong> Pernambuco (UFRPE), CEP 55292-901, Recife,Pernambuco, Brasil.3Programa <strong>de</strong> Gerenciamento <strong>de</strong> Rebanhos Leiteiros do Nor<strong>de</strong>ste (PROGENE), Departamento <strong>de</strong>Zootecnia, UFRPE, CEP 55292-901, Recife, Pernambuco, Brasil.* acabad80@gmail.comABSTRACTMilk fat composition is one of the factors influencing the nutritional quality of dairy products. We studied the A293V polymorphisms in theStearoyl-Coenzyme A Desaturase locus (SCD) and the K232A polymorphisms in the Acyl CoA: Diacylglycerol Acyltransferase 1 locus (DGAT1).Both enzymes have an important role in lipid metabolism. The aims of the present study was to <strong>de</strong>termine gene frequencies for both loci in the breedSiboney <strong>de</strong> Cuba (N=165). The methodology for both loci was amplification created restriction sites (ACRS). We observed that the SCD A allele andthe DGAT1 A allele were the most frequent in the studied population. Three genotypes were i<strong>de</strong>ntified at each locus, with the following frequencies:0.821, 0.172 and 0.007 for genotypes AA, AS and SS, respectively, at the SCD locus and 0.686, 0.212 and 0.102 for genotypes AA, AK and KK,respectively, at the DGAT1 locus. The SCD locus was in Hardy-Weinberg equilibrium, whereas a <strong>de</strong>viation from the Hardy-Weinberg equilibrium(p
POLIMORFISMO EN GANADO CUBANO DE GENES SCD Y DGAT129INTRODUCCIÓNEs creciente el interés en la composición <strong>de</strong>ácidos grasos en la leche como parámetro <strong>de</strong> granimportancia para evaluar la calidad nutricional <strong>de</strong> lamisma (Morris et al., 2007; Schennink et al., 2008;Schennink et al., 2009a; Schennink et al. 2009b).Se conoce que la concentración <strong>de</strong> ácidos grasosen la leche está influenciada en gran medida porla alimentación que reciben los animales (Jenkinsy McGuire, 2006), pero la bibliografía sugiere queel estudio <strong>de</strong> genes candidatos asociados a estecarácter pudiese contribuir a obtener produccioneslácteas <strong>de</strong> mayor valor nutricional (Schennink etal., 2008; Signorelli et al., 2009; Conte et al., 2010;Wang et al., 2011).En diferentes investigaciones se propone elestudio como genes candidatos a estearoil-coenzimaA <strong>de</strong>saturasa (Stearoyl-Coenzyme A DesaturaseSCD) y a Acil-CoA: diacilglicerol aciltransferasa1 (Acyl CoA: Diacylglycerol Acyltransferase 1DGAT1) (Mele et al., 2007; Näslund et al., 2008;Schennink et al., 2008; Maharani et al., 2012).En el locus SCD se <strong>de</strong>scribe un polimorfismo <strong>de</strong>nucleótido simple (Single Nucleoti<strong>de</strong> Polymorphism,SNP) en el exón 5 que causa la sustitución <strong>de</strong>laminoácido alanina (alelo A) por valina (aleloV) en la posición 293 <strong>de</strong> la ca<strong>de</strong>na aminoacídica(Taniguchi et al., 2004). Se ha <strong>de</strong>scrito una relaciónsignificativa entre el polimorfismo A293V <strong>de</strong>llocus SCD con producción <strong>de</strong> leche, contenido <strong>de</strong>grasa y la composición <strong>de</strong> la fracción lipídica <strong>de</strong>la leche (Mele et al., 2007; Macciotta et al., 2008;Kgwatalala et al., 2009a Mao et al., 2012). En ellocus DGAT1 la sustitución aminoacídica <strong>de</strong> lisina(alelo K) por alanina (alelo A) en la posición 232se asocia a variaciones en la composición <strong>de</strong> ácidosgrasos en la leche (Kaupe et al., 2007; Schennink etal., 2007), así como al contenido <strong>de</strong> grasa y proteínaen la misma (Signorelli et al., 2009).Siboney <strong>de</strong> Cuba es una raza sintética obtenidaa partir <strong>de</strong>l cruzamiento 5 ⁄ 8Holstein - 3 ⁄ 8CebúCubano, la cual juega un papel prepon<strong>de</strong>rante en laproducción láctea en el país. El objetivo <strong>de</strong>l presentetrabajo fue <strong>de</strong>terminar las frecuencias génicas <strong>de</strong> lospolimorfismos A293V <strong>de</strong>l locus SCD y K232A <strong>de</strong>llocus DGAT1 en la raza Siboney <strong>de</strong> Cuba.MATERIALES Y MÉTODOSAnimales y obtención <strong>de</strong>l material genéticoCumpliendo las normas establecidas <strong>de</strong>l comité <strong>de</strong>ética y bienestar animal, se tomaron muestras <strong>de</strong>sangre periférica <strong>de</strong> 165 vacas <strong>de</strong> la raza Siboney<strong>de</strong> Cuba. Se emplearon 0.5 ml <strong>de</strong> 0.5 M EDTAcomo anticoagulante y se procedió a la extraccióny purificación <strong>de</strong>l ADN mediante el método <strong>de</strong>precipitación salina <strong>de</strong>scrito por Miller et al. (1988).Genotipado <strong>de</strong> los loci SCD y DGAT1Los polimorfismos <strong>de</strong> interés en estos dos loci,fueron estudiados a partir <strong>de</strong>l <strong>de</strong>sarrollo <strong>de</strong> lametodología <strong>de</strong> ACRS combinada con el empleo <strong>de</strong>la reacción en ca<strong>de</strong>na <strong>de</strong> la polimerasa (PolymeraseChain Reaction, PCR) en ambos casos. Losoligonucleótidos empleados en la PCR fuerondiseñados con el empleo <strong>de</strong>l programa Vector NTIAdvance TM 11.0 (Invitrogen Corporation 2008)(Tabla 1). El volumen final <strong>de</strong> la reacción fue <strong>de</strong>25 µL constituida por buffer <strong>de</strong> reacción 10X(conteniendo 10mM TrisHCl, pH 9; 50mM KCl y 0,1% Triton X-100), 50mM MgCl 2, 1,25mM dNTPs,20nmol/μL <strong>de</strong> oligonucleótido correspondiente y5U/μL <strong>de</strong> polimerasa ADN comercial (Fermentas),completándose el volumen final con agua. Losprogramas <strong>de</strong> amplificación empleados para ambosloci fueron similares, variando sólo en la temperatura<strong>de</strong> alineamiento. Dichos programas constaron <strong>de</strong>94 o C por 5min en la etapa <strong>de</strong> <strong>de</strong>snaturalización,seguido por 32 ciclos <strong>de</strong> 94 o C por 1min, 1min <strong>de</strong>alineamiento y 72 o C por 1min; el tiempo final <strong>de</strong>extensión fue <strong>de</strong> 5min a 72 o C.A partir <strong>de</strong> 10µL <strong>de</strong>l producto amplificado seprocedió a la digestión con las enzimas específicaspara cada uno <strong>de</strong> los fragmentos (Tabla 1). Latemperatura <strong>de</strong> incubación fue <strong>de</strong> 37 o C durante 3hs. La visualización <strong>de</strong>l producto digerido se realizóen gel <strong>de</strong> agarosa al 2%, TBE 0,5X, con tinción <strong>de</strong>Blue Green Loading Dye I (LGC Biotecnologia),empleando 0,3μL por cada 5μL <strong>de</strong> productodigerido.Journal of Basic & Applied Genetics | 2012 | Volume 23 | Issue 2 | Article 4 - research
POLIMORFISMO EN GANADO CUBANO DE GENES SCD Y DGAT131Cuba (p
32 POLIMORFISMO EN GANADO CUBANO DE GENES SCD Y DGAT1Figura 1. Amplificación y digestión <strong>de</strong> SCD, Línea M: MPM50pb, Línea 1: producto amplificado, Línea 2:genotipos AA, Línea 3: genotipos AV, Línea 4:genotipos VV, Línea 5: control negativo.Figura 2. Amplificación y digestión <strong>de</strong> DGAT1 Línea M:MPM 50pb, Línea 1: producto amplificado, Línea2: genotipos AA, Línea 3: genotipos KK, Línea 4:genotipos AK, Línea 5: control negativo.CONCLUSIONESSe i<strong>de</strong>ntificaron las dos variantes alélicas en losloci estudiados. Los alelos SCD A y DGAT1 A fueronlos <strong>de</strong> mayor frecuencia en la población Siboney <strong>de</strong>Cuba. Se observó que el locus SCD se encuentrabajo la condición <strong>de</strong> equilibrio Hardy-Weinberg,no siendo así la condición para el locus DGAT1(p
POLIMORFISMO EN GANADO CUBANO DE GENES SCD Y DGAT133taurus cattle breeds. Journal of Dairy Research71: 182-187.Kgwatalala P.M., Ibeagha-Awemu E.M., MustafaA.F., Zhao X. (2009a) Stearoyl-CoA <strong>de</strong>saturase1 genotype and stage of lactation influences milkfatty acid composition of Canadian Holsteincows. Animal Genetics 40: 609-615.Kgwatalala P.M., Ibeagha-Awemu E.M., MustafaA.F., Zhao X. (2009b) Influence of stearoylcoenzymeA <strong>de</strong>saturase 1 genotype and stage oflactation on fatty acid composition of CanadianJersey cows. Journal of Dairy Science 92: 1220-1228.Komisarek J., Dorynek Z. (2009) EffectofABCG2, PPARGC1A, OLR1 andSCD1 genepolymorphism on estimated breeding valuesfor functional and production traits in PolishHolstein-Friesian bulls. Journal of AppliedGenetics 50: 125-132.Lacorte G., Machado M., Martinez M., Campos A.,Maciel R., Verneque R., Teodoro R., Peixoto M.,Carvalho M., Fonseca C. (2006) DGAT1 K232Apolymorphism in Brazilian cattle breeds. Genet.Mol. Res. 5: 475-482.Macciotta N.P.P., Mele M., Conte G., Serra A.,Cassandro M., Dal Zotto R., Cappio Borlino A.,Pagnacco G., Secchiari P. (2008) AssociationBetween a Polymorphism at the Stearoyl CoADesaturase Locus and Milk Production Traits inItalian Holsteins. Journal of Dairy Science 91:3184-3189.Maharani D., Jung Y., Jung W., Jo C., Ryoo S., LeeS., Yeon S., Lee J. (2012) Association of fivecandidate genes with fatty acid compositionin Korean cattle. Molecular Biology Reports.doi:10.1007/s11033-011-1426-6Mao Y.J., Chen R.J., Chang L.L., Chen Y., Ji D.J.,Wu X.X., Shi X.K., Wu H.T., Zhang M.R., YangZ.P., König S., Yang L.G. (2012) Effects ofSCD1- and DGAT1-genes on production traitsof Chinese Holstein cows located in the DeltaRegion of Yangtze River. Livestock Science.doi:10.1016/j.livsci.2011.12.019Matsuhashi T., Maruyama S., Uemoto Y.,Kobayashi N., Mannen H., Abe T., SakaguchiS., Kobayashi E. (2010) Effects of FASN, SCD,SREBP1 and GH gene polymorphisms on fattyacid composition and carcass traits in JapaneseBlack cattle. Journal of Animal Science. doi:10.2527/jas.2010-3121Mele M., Conte G., Castiglioni B., Chessa S.,Macciotta N.P.P., Serra A., Buccioni A.,Pagnacco G., Secchiari P. (2007) Stearoyl-Coenzyme A Desaturase Gene Polymorphismand Milk Fatty Acid Composition in ItalianHolsteins. Journal of Dairy Science 90: 4458-4465.Miller S.A., Dykes D.D., Polesky H.F. (1988) Asimple salting out procedure for extractingDNA from human nucleated cells. Nucleic AcidResearch 16: 12-15.Moioli B., Contarini G., Avalli A., Catillo G., OrrùL., De Matteis G., Masoero G., Napolitano F.(2007) Short Communication: Effect of Stearoyl-Coenzyme A Desaturase Polymorphism on FattyAcid Composition of Milk. Journal of DairyScience 90: 3553-3558.Morris C.A., Cullen N.G., Glass B.C., HyndmanD.L., Manley T.R., Hickey S.M., McEwan J.C.,Pitchford W.S., Bottema C.D.K., Lee M.A.H.(2007) Fatty acid synthase effects on bovineadipose fat and milk fat. Mammalian Genome18: 64-74.Näslund J., Fikse W.F., Pielberg G.R., Lundén A.(2008) Frequency and Effect of the BovineAcyl-CoA:Diacylglycerol Acyltransferase 1(DGAT1) K232A Polymorphism in SwedishDairy Cattle. Journal of Dairy Science 91: 2127-2134.Raymond M., Rousset F. (1995) Genepop(Version-1.2) - Population-Genetics Softwarefor Exact Tests and Ecumenicism. Journal ofHeredity 86: 248-249.Rousset F. (2008) Genepop’007: a completereimplementation of the Genepop software forWindows and Linux. Mol. Ecol. Resources 8: 103-106.Journal of Basic & Applied Genetics | 2012 | Volume 23 | Issue 2 | Article 4 - research
34 POLIMORFISMO EN GANADO CUBANO DE GENES SCD Y DGAT1Schennink A., Bovenhuis H., Léon-KloosterzielK.M., Van Arendonk J.A.M., Visker M.H.P.W.(2009a) Effect of polymorphisms in the FASN,OLR1, PPARGC1A, PRL and STAT5A genes onbovine milk-fat composition. Animal Genetics40: 909-916.Schennink A., Stoop W.M., Visker M.H.P.W., Van<strong>de</strong>r Poel J.J., Bovenhuis H., Van ArendonkJ.A.M. (2009b) Short communication: Genomewi<strong>de</strong>scan for bovine milk-fat composition. II.Quantitative trait loci for long-chain fatty acids.Journal of Dairy Science 92: 4676-4682.Schennink A., Heck J., Bovenhuis H., Visker M.,Van Valenberg H., Van Arendonk J. (2008) Milkfatty acid unsaturation: genetic parameters an<strong>de</strong>ffects of stearoyl-CoA <strong>de</strong>saturase (SCD1)and acyl CoA: diacylglycerol acyltransferase 1(DGAT1). Journal of Dairy Science 91: 2135-2143.Schennink A., Stoop W.M., Visker M.H.P.W., HeckJ.M.L., Bovenhuis H., Van Der Poel J.J., VanValenberg H.J.F., Van Arendonk J.A.M. (2007)DGAT1 un<strong>de</strong>rlies large genetic variation inmilk-fat composition of dairy cows. AnimalGenetics 38: 467-473.Wang X., Chen R., Yang Z., Mao Y., Ji D.,Chen Y., Chang L., Li Y., Li R. (2011)Genetic Polymorphism of the SCD1 Geneand Its Associations with Milking Traitsin Chinese Holstein. Chinese Journal ofAnimal and Veterinary Sciences. doi:CNKI:SUN:XMSY.0.2011-07-019Winter A., Krämer W., Werner F.A.O., Kollers S.,Kata S., Durstewitz G., Buitkamp J., WomackJ.E., Thaller G., Fries R. (2002) Associationof a lysine-232/alanine polymorphism in abovine gene encoding acyl-CoA: diacylglycerolacyltransferase (DGAT1) with variation at aquantitative trait locus for milk fat content.Proceedings of the National Aca<strong>de</strong>my ofSciences 99: 9300-9305.AGRADECIMIENTOSLos autores quieren agra<strong>de</strong>cer el soportefinanciero brindado por el proyecto CAPES-MES085-09, Brasil-Cuba para la realización <strong>de</strong> estainvestigación. También agra<strong>de</strong>cemos las facilida<strong>de</strong>sbrindadas por la Dirección Nacional <strong>de</strong> Genéticay la Empresa Valle <strong>de</strong> Perú para la obtención <strong>de</strong>muestras <strong>de</strong>l rebaño Siboney <strong>de</strong> Cuba.Signorelli F., Orrù L., Napolitano F., De Matteis G.,Scatà M.C., Catillo G., Marchitelli C., MoioliB. (2009) Exploring polymorphisms and effectson milk traits of the DGAT1, SCD1 and GHRgenes in four cattle breeds. Livestock Science125: 74-79.Spelman R.J., Ford C.A., McElhinney P., GregoryG.C., Snell R.G. (2002) Characterization ofthe DGAT1 Gene in the New Zealand DairyPopulation. Journal of Dairy Science 85: 3514-3517.Taniguchi M., Utsugi T., Oyama K., Mannen H.,Kobayashi M., Tanabe Y., Ogino A., Tsuji S.(2004) Genotype of stearoyl-CoA <strong>de</strong>saturaseis associated with fatty acid composition inJapanese Black cattle. Mammalian Genome 14:142-148.Journal of Basic & Applied Genetics | 2012 | Volume 23 | Issue 2 | Article 4 - research
ISSN: 1852-6233LA APTITUD COMBINATORIA ESPECÍFICA EN EL MAÍZ(Zea mays L. ssp. mays) PARA DOBLE PROPÓSITO EN RÍOCUARTO, CÓRDOBA, ARGENTINA.Di Santo H.¹, Castillo E.¹, Ferreira A.¹, Grassi E.¹, Ferreira V.¹¹Genética, Facultad <strong>de</strong> Agronomía y Veterinaria. Universidad Nacional <strong>de</strong> Río Cuarto.egrassi@ayv.unrc.edu.arABSTRACTThe dual purpose maize is useful in mixed farming establishments because they are suitable to the purposes of grain crop and direct or <strong>de</strong>ferredfeed for livestock. A breeding plan to improve land maize populations for forage use is carried out at the National University of Río Cuarto. The aimof this work was to <strong>de</strong>termine the Specific Combining Ability of inbred lines through the productive performance of their single-cross hybrids. Adiallel cross was performed, and eighteen traits of the single cross hybrids were studied during three years. A completely randomized block <strong>de</strong>signwith three replicates was used, and ANOVA for data analysis was carried out. Specific combining ability trials showed significant positive valuesfor most traits. This allowed i<strong>de</strong>ntifying and classifying single-cross hybrids according to their potential usability. Seven single-cross hybrids werechosen: one for dual purpose aptitu<strong>de</strong>, three for grain yield or high <strong>de</strong>ferred forage production and three for silage in milk-dough grain stage. It isconsi<strong>de</strong>red necessary to confirm the performance and productivity of promising single-cross hybrids varying regional environments and agronomicconditions set against commercial simple cross hybrids to verify the production potential and stability.Key words: maize, inbred lines, single cross-hybrids, agronomic uses.RESUMENLos maíces doble propósito son útiles en los establecimientos <strong>de</strong> producción mixta ya que se adaptan a los propósitos <strong>de</strong> cosecha <strong>de</strong> grano yalimento directo o diferido para el ganado. En la Universidad Nacional <strong>de</strong> Río Cuarto se ejecuta un proyecto <strong>de</strong> mejoramiento <strong>de</strong> maíz forrajero apartir <strong>de</strong> poblaciones locales. El objetivo fue <strong>de</strong>terminar la aptitud combinatoria específica (ACE) <strong>de</strong> líneas endocriadas. Se realizó el cruzamientodialélico y durante tres campañas se analizó la ACE <strong>de</strong> las líneas a través <strong>de</strong> sus híbridos, empleando 18 caracteres; el diseño fue en bloquescompletos al azar con tres repeticiones y los datos se analizaron mediante ANOVA. Los ensayos <strong>de</strong> ACE mostraron valores positivos y significativospara la mayoría <strong>de</strong> los caracteres evaluados. Esto permitió i<strong>de</strong>ntificar y clasificar los híbridos simples según su potencial aptitud <strong>de</strong> uso. Del total<strong>de</strong> híbridos simples se eligieron siete, uno por su aptitud para doble propósito, tres por su alta producción <strong>de</strong> forraje diferido o grano y tres paraensilado en estado lechoso-pastoso. Se consi<strong>de</strong>ra necesario confirmar el comportamiento y productividad <strong>de</strong> los híbridos simples promisoriosvariando ambientes regionales y condiciones agronómicas contrastándolos con testigos comerciales a fin <strong>de</strong> verificar el potencial <strong>de</strong> producciónasí como su estabilidad.Palabras clave: maíz, líneas endocriadas, híbridos simples, usos agronómicos.Journal of Basic & Applied Genetics | 2012 | Volume 23 | Issue 2 | Article 5 - research
APTITUD COMBINATORIA EN EL MAÍZ PARA DOBLE PROPÓSITO36INTRODUCCIÓNEl maíz, Zea mays L. ssp. mays (Iltis y Doebley,1980), es uno <strong>de</strong> los cultivos más antiguos, ocupael segundo lugar a nivel mundial en volumen<strong>de</strong> producción y tiene gran importancia socioeconómicaya sea para alimento humano o animalo como fuente <strong>de</strong> un gran número <strong>de</strong> productosindustriales (Watson, 1988; Fussell, 1999).La planta <strong>de</strong> maíz es un excelente forraje parael ganado bovino <strong>de</strong> carne y <strong>de</strong> leche. Se utilizacomo forraje en varias etapas <strong>de</strong>l crecimiento, <strong>de</strong>s<strong>de</strong>estado juvenil <strong>de</strong> pasto hasta la emisión <strong>de</strong> la panojao más a<strong>de</strong>lante. Para obtener la máxima producción<strong>de</strong> Materia Seca (MS) digestible por hectárea conla máxima energía (forraje energético), el estado<strong>de</strong> grano lechoso-pastoso es el más a<strong>de</strong>cuado ysupera a cualquier otro cultivo anual. En ese estadoes el cultivo i<strong>de</strong>al para ensilar (Gallais et al., 1976;Paliwal et al., 2001).El cultivo está ampliamente difundido en losestablecimientos <strong>de</strong> producción mixta <strong>de</strong> la regiónsubhúmeda-semiárida argentina. En la alimentaciónanimal se emplea como grano, forraje ver<strong>de</strong>, silajeen estado <strong>de</strong> grano lechoso-pastoso y pastoreo enpie cuando se prevé mala cosecha <strong>de</strong> grano o <strong>de</strong>lrastrojo. La obtención <strong>de</strong> materiales con diferentesaptitu<strong>de</strong>s <strong>de</strong> utilización para los sistemas mixtosregionales <strong>de</strong>bería combinar la producción <strong>de</strong>grano con caracteres <strong>de</strong> gramíneas forrajeras, talescomo alta cantidad <strong>de</strong> materia seca total, toleranciaa sequía, macollamiento, rebrote y plasticidad(Reynoso, 1996). La <strong>de</strong>finición más simple paraun maíz doble propósito es el que consi<strong>de</strong>ra laproducción <strong>de</strong> grano y como alternativa el pastoreoen estado vegetativo y reproductivo temprano, elpicado y el pastoreo <strong>de</strong>l cultivo diferido.La superficie sembrada en la <strong>Argentina</strong> fue <strong>de</strong>aproximadamente 4,56 x 10 6 has en la campaña2010/11, mientras que en la región subhúmedasemiáridafue <strong>de</strong> 1,657 x 10 6 has, <strong>de</strong> las cuales,68,9 % correspondieron a la provincia <strong>de</strong> Córdoba,8,4 % a San Luis y 22,6 % a La Pampa. La regiónmencionada aportó el 29,7 % <strong>de</strong> la producciónnacional (SIIA, 2012). Los registros históricosindican que el 90 % <strong>de</strong>l maíz se cosecha como granopara consumo humano o animal y el resto se <strong>de</strong>stinaa silaje o consumo directo o diferido por el ganado;este último <strong>de</strong>stino ocupa alre<strong>de</strong>dor <strong>de</strong> 468.000 hasen la región subhúmeda-semiárida (INDEC, 2005).Sin embargo, en las últimas dos campañas se estimauna superficie <strong>de</strong> maíz picado para silaje <strong>de</strong> entre750.000 y 850.000 has (CACF, 2012; Maizar, 2012).En 1908, G.H. Shull fue el primero quesugirió la utilización <strong>de</strong> los híbridos F 1producto<strong>de</strong> la cruza entre líneas endocriadas (en Crow,1998). Sprague y Tatum (1942) <strong>de</strong>finieron lostérminos aptitud combinatoria general (ACG) yaptitud combinatoria específica (ACE) en relaciónal comportamiento relativo <strong>de</strong> las líneas al sercruzadas, don<strong>de</strong> ACG <strong>de</strong>signa el comportamientopromedio <strong>de</strong> una línea en combinaciones híbridas,y ACE <strong>de</strong>signa la <strong>de</strong>sviación <strong>de</strong> cada combinacióncon respecto a la ACG <strong>de</strong> los progenitores(Hallauer y Miranda Filho, 1988; Quemé <strong>de</strong> Leónet al., 1991).El conocimiento <strong>de</strong> la aptitud combinatoria <strong>de</strong>los progenitores permite seleccionar aquellos <strong>de</strong>buen comportamiento en una serie <strong>de</strong> cruzamientose i<strong>de</strong>ntificar combinaciones específicas <strong>de</strong>comportamiento superior (Gutiérrez <strong>de</strong>l Río etal., 2004; Castañón-Nájera et al., 2005; De laCruz-Lázaro et al., 2010). Una vez que se hanseleccionado las líneas endocriadas teóricamentemejores basándose en su buena aptitud combinatoriageneral, es necesario i<strong>de</strong>ntificar los cruzamientossimples, <strong>de</strong> tres vías o dobles que producirán losmayores rendimientos (Sprague y Tatum, 1942;Allard, 1978). El <strong>de</strong>sarrollo <strong>de</strong> cultivares híbridossimples requiere analizar los resultados <strong>de</strong> loscruzamientos dialélicos (Russel, 1973; Allard,1978; Hallauer y Miranda Filho, 1988).La <strong>Argentina</strong> posee como antece<strong>de</strong>ntes lacreación <strong>de</strong> una variedad <strong>de</strong> maíz doble propósito ymacolladora en la EEA Bor<strong>de</strong>nave, don<strong>de</strong> se obtuvoel cultivar “Don Faustino INTA” (Gorostegui,1971) y se realizaron varios trabajos con distintogermoplasma <strong>de</strong> maíz y sus parientes silvestres enel Instituto Fitotécnico Santa Catalina <strong>de</strong> la UN <strong>de</strong>La Plata, EEA Pergamino-INTA, UN <strong>de</strong> La Pampa,UN <strong>de</strong> Lomas <strong>de</strong> Zamora (Magoja y Pischedda,1988; Troiani et al., 1988; Paccapelo y Molas, 1996;Torrecillas y Bertoia, 2000).A partir <strong>de</strong> un proyecto <strong>de</strong>stinado almejoramiento <strong>de</strong> maíz para uso forrajero iniciadocon tres poblaciones locales macolladoras, en la UNRío Cuarto se efectuaron seis ciclos <strong>de</strong> selecciónrecurrente <strong>de</strong> medios hermanos (Lonnquist, 1964),Journal of Basic & Applied Genetics | 2012 | Volume 23 | Issue 2 | Article 5 - research
37APTITUD COMBINATORIA EN EL MAÍZ PARA DOBLE PROPÓSITOobteniendo el Grado <strong>de</strong> Determinación Genética ylos coeficientes <strong>de</strong> variación genética <strong>de</strong> líneas S 1y S 2(Grassi et al., 2006). En base a una prueba topcross se evaluó la ACG y se eligieron cinco líneaspara la formación <strong>de</strong> híbridos simples y estudiar suvalidación agronómica (Grassi et al., 2009; Grassi,2009).El objetivo propuesto en este trabajo fue<strong>de</strong>terminar la aptitud combinatoria específica <strong>de</strong>líneas endocriadas <strong>de</strong> maíz, seleccionadas porsu aptitud combinatoria general, a través <strong>de</strong> loshíbridos simples obtenidos a partir <strong>de</strong>l cruzamientodialélico, i<strong>de</strong>ntificando los más aptos para doblepropósito en base a caracteres morfofisiológicos y<strong>de</strong> producción.MATERIALES Y MÉTODOSLos ensayos <strong>de</strong> aptitud combinatoria especifica(ACE) se realizaron en el Campo <strong>de</strong> Docencia yExperimentación <strong>de</strong> la UN <strong>de</strong> Río Cuarto (33° 06’22’’ S; 64° 17’ 52’’ O) ubicado a 443 msnm en lalocalidad <strong>de</strong> Las Higueras, Departamento RíoCuarto, Córdoba. El suelo es un Haplustol típicocon 1,6 % <strong>de</strong> materia orgánica. El área cuenta conuna temperatura media anual <strong>de</strong> 16,5° C. El períodolibre <strong>de</strong> heladas es <strong>de</strong> 240 días (entre septiembre ymayo). Las precipitaciones poseen un valor medio<strong>de</strong> 800 mm anuales con un régimen monzónicoirregular con aproximadamente 80 % <strong>de</strong> lasprecipitaciones concentradas en el semestre máscálido (octubre a marzo).Durante las campañas agrícolas 2004/2005,2006/07 y 2007/08 se sembraron cinco líneasendocriadas, elegidas en base a una prueba top crosspara la <strong>de</strong>terminación <strong>de</strong> la ACG, y los 20 híbridossimples obtenidos a partir <strong>de</strong>l cruzamiento dialélicocompleto <strong>de</strong> dichas líneas. Los ensayos se sembraronel día 19 <strong>de</strong> octubre <strong>de</strong> 2004, 10 <strong>de</strong> noviembre <strong>de</strong>2006 y 7 <strong>de</strong> noviembre <strong>de</strong> 2007. Los materiales <strong>de</strong>dispusieron en un diseño <strong>de</strong> bloques completos alazar, con tres repeticiones. Cada parcela consistióen dos surcos a 0,70 metros <strong>de</strong> separación y unalongitud <strong>de</strong> 3 metros (4,20 m 2 ). Se sembraron arazón <strong>de</strong> cinco semillas por metro lineal, con doblegolpe, para (con un raleo posterior) garantizar una<strong>de</strong>nsidad <strong>de</strong> cosecha <strong>de</strong> aproximadamente 71.000plantas ha -1 . La unidad experimental consistió enplantas individuales realizándose tres submuestreospor parcela.Se evaluaron caracteres morfofisológicos, enestado R 3-R 4y al final <strong>de</strong>l ciclo <strong>de</strong>l cultivo:- Morfofisiológicos: altura total (m) <strong>de</strong> laplanta, número <strong>de</strong> tallos por planta, número <strong>de</strong>espigas por planta, número <strong>de</strong> espigas por tallo.- En estado R 3-R 4: peso ver<strong>de</strong> (g) <strong>de</strong> plantaentera, peso ver<strong>de</strong> (g) <strong>de</strong> espigas sin chala porplanta, porcentaje <strong>de</strong> espiga ver<strong>de</strong> sin chalapor planta, porcentaje <strong>de</strong> espiga seca sinchala por planta, porcentaje <strong>de</strong> materia seca<strong>de</strong> espiga sin chala por planta, peso seco (g)<strong>de</strong> planta entera, peso seco (g) <strong>de</strong> espigas sinchala por planta, porcentaje <strong>de</strong> materia secatotal.- Al final <strong>de</strong>l ciclo <strong>de</strong>l cultivo: peso seco(g) <strong>de</strong> planta entera, peso seco (g) <strong>de</strong> espigassin chala por planta, número <strong>de</strong> granos porplanta, peso (g) <strong>de</strong> granos por planta, peso (g)<strong>de</strong> 1000 granos, índice <strong>de</strong> cosecha.Los valores obtenidos <strong>de</strong> los ensayos <strong>de</strong> ACE seanalizaron mediante un análisis dialélico conjunto(Griffins, 1956) utilizando el siguiente mo<strong>de</strong>lo:Y ij= µ + g i+ g j+ s ij+ a k+ ga ik+ ga jk+ sa ijk+ r l +ε ij,don<strong>de</strong>, µ= media general <strong>de</strong>l ensayo; g i= efectos<strong>de</strong> la aptitud combinatoria general asociada alprogenitor i; g j= efectos <strong>de</strong> la aptitud combinatoriageneral asociada al progenitor j; s ij= efectos<strong>de</strong> la aptitud combinatoria especifica entre losprogenitores i y j; a k= efecto <strong>de</strong>l ambiente k; ga ikyga jk= efectos <strong>de</strong> la interacción entre la ACG <strong>de</strong> losprogenitores i y j y el ambiente k; sa ijk= interacción<strong>de</strong> la aptitud combinatoria especifica entre losprogenitores i y j y el ambiente k ; r l= efecto <strong>de</strong> larepetición l; ε ij= error experimental. Se aclara que eneste mo<strong>de</strong>lo Y ijy ε son, respectivamente, la mediaijexperimental y el error aleatorio medio asociados alos tratamientos <strong>de</strong> or<strong>de</strong>n ij (Cruz, 2006).Este mo<strong>de</strong>lo, correspondiente al mo<strong>de</strong>loexperimental I propuesto por Griffins (1956),incluye los progenitores, híbridos F 1con recíprocos,aleatorizados en los bloques respectivos. El análisisse llevó a cabo utilizando el aplicativo computacionalen genética y estadística GENES (Cruz, 2006). LosJournal of Basic & Applied Genetics | 2012 | Volume 23 | Issue 2 | Article 5 - research
APTITUD COMBINATORIA EN EL MAÍZ PARA DOBLE PROPÓSITO38significados <strong>de</strong> los efectos genéticos <strong>de</strong> ACG yACE <strong>de</strong> las variables medidas se evaluaron con unaprueba “t”, a través <strong>de</strong> su error estándar. El errorestándar <strong>de</strong> una media <strong>de</strong> tratamiento se calculóa partir <strong>de</strong> la raíz cuadrada <strong>de</strong>l cociente entre elcuadrado medio <strong>de</strong>l error <strong>de</strong>l residuo y el número<strong>de</strong> repeticiones (Steel y Torrie, 1988).RESULTADOS Y DISCUSIÓNLos ensayos se <strong>de</strong>sarrollaron bajo condicioneshídricas a<strong>de</strong>cuadas, don<strong>de</strong> las precipitaciones <strong>de</strong>los tres ciclos superaron al promedio históricocorrespondiente. Las campañas 2004/05 y 2006/07se iniciaron con menor recarga hídrica en el perfil<strong>de</strong>l suelo <strong>de</strong>bido a un atraso en el inicio <strong>de</strong> las lluviasprimaverales. Durante el período crítico <strong>de</strong>l cultivo,las precipitaciones fueron abundantes por lo que elcultivo no experimentó periodos <strong>de</strong> <strong>de</strong>ficiencia <strong>de</strong>humedad edáfica.Los valores medios y <strong>de</strong>svíos para los caracteresconsi<strong>de</strong>rados en los tres años <strong>de</strong> ensayo se resumen enla Tabla 1. Algunos <strong>de</strong> los caracteres <strong>de</strong> producciónmedidos en R 3-R 4y fin <strong>de</strong> ciclo se proyectaron ahectárea con el objetivo <strong>de</strong> dimensionar los valoresobtenidos. La materia seca total en estado lechosopastoso(62.900 kg ha - 1) fue similar y en algunoscasos superior a los encontrados por Arias et al.(2003), Centeno et al. (2009; 2010), Di Nucci<strong>de</strong> Be<strong>de</strong>ndo et al. (2009) y De León et al. (2011)empleando distintos híbridos comerciales.Los valores <strong>de</strong> MS total observada a fin <strong>de</strong> ciclo(24.345 kg ha -1 ) se correspon<strong>de</strong>n con los valoresobservados en ensayos sobre maíz para uso comopastura diferida para la alimentación <strong>de</strong> ganadobovino (Maresca et al., 2006; Castaldo et al., 2009).El peso <strong>de</strong> grano promedio registrado (10.106 kgha -1 ) fue superior o similar al obtenido en diferenteslocalida<strong>de</strong>s <strong>de</strong> la provincia <strong>de</strong> Buenos Aires, ensuelos con 2,5-3% <strong>de</strong> materia orgánica y 180-200 kg ha -1 <strong>de</strong> urea (Cirilo, 2004; Ferraris, 2004;Ventimiglia y Torrens Baudrix, 2012).Los valores <strong>de</strong> F y el significado obtenido <strong>de</strong>los análisis <strong>de</strong> varianza conjuntos <strong>de</strong> los caracteresmedidos en los híbridos simples se presentan en lasTablas 2, 3 y 4. La ACG fue altamente significativapara los caracteres altura <strong>de</strong> planta y espigas porplanta y significativa para espigas por tallo y pesover<strong>de</strong> <strong>de</strong> espigas en estado R 3-R 4. La ACE fue muyaltamente significativa en altura <strong>de</strong> planta, pesover<strong>de</strong> <strong>de</strong> planta entera y peso ver<strong>de</strong> <strong>de</strong> espigasen estado R 3-R 4; los caracteres tallos por planta yespigas por tallo presentaron ACE significativa. LaACE recíproca fue no significativa en los cuatrocaracteres (Tabla 2). No se observaron interaccionescon el año, salvo para altura <strong>de</strong> planta don<strong>de</strong> la ACGtuvo interacción altamente significativa.Los efectos <strong>de</strong> ACG fueron altamentesignificativos para porcentaje <strong>de</strong> espiga ver<strong>de</strong> yporcentaje <strong>de</strong> espiga seca en estado R 3-R 4. Losefectos <strong>de</strong> ACE fueron significativos para losseis caracteres (muy altamente significativos enporcentaje <strong>de</strong> espiga seca, porcentaje <strong>de</strong> materiaseca <strong>de</strong> espiga, peso seco <strong>de</strong> planta entera y pesoseco <strong>de</strong> espigas en estado R 3-R 4). El ER presentósignificación únicamente en porcentaje <strong>de</strong> espigaver<strong>de</strong> en estado R 3-R 4.La interacción ACG x Año fue altamentesignificativa en % <strong>de</strong> materia seca total y lainteracción <strong>de</strong> ER x Año fue significativa en loscaracteres peso seco <strong>de</strong> planta entera y peso seco<strong>de</strong> espigas. Los caracteres <strong>de</strong> fin <strong>de</strong> ciclo (Tabla4) mostraronm efectos <strong>de</strong> ACG muy altamentesignificativos en el peso <strong>de</strong> 1000 semillas, mientrasque los efectos <strong>de</strong> ACE fueron muy altamentesignificativos en todos ellos, salvo para índice <strong>de</strong>cosecha que se mostraron altamente significativos.Los efectos <strong>de</strong> ACE recíproca y las interacciones <strong>de</strong>aptitud combinatoria y año fueron no significativosen todos los casos.Caracteres morfofisiológicosLos valores <strong>de</strong> ACE para los caracteresmorfofisiológicos evaluados previo al corte en R 3-R 4se presentan en la Tabla 5. Trece híbridos simplespresentaron efectos significativos para altura <strong>de</strong>planta, don<strong>de</strong> se <strong>de</strong>stacan 4x20, 20x4, 20x26 y26x3 como los <strong>de</strong> mayor ACE para este carácter.Los híbridos 3x4, 4x3, 26x4 y 26x20 acompañanese efecto con la relación espiga/tallo y 28x4 connúmero <strong>de</strong> espigas por planta, respectivamente. Noexisten valores significativos <strong>de</strong> efecto <strong>de</strong> ACE paratallos por planta.Journal of Basic & Applied Genetics | 2012 | Volume 23 | Issue 2 | Article 5 - research
39 APTITUD COMBINATORIA EN EL MAÍZ PARA DOBLE PROPÓSITOCaracteres evaluados en estado R 3-R 4(granolechoso-pastoso)En la Tabla 6 se resumen los valores <strong>de</strong> ACE <strong>de</strong>los híbridos analizados para los caracteres antes<strong>de</strong>scriptos. En total, 10 HS muestran un efecto <strong>de</strong>ACE significativa en al menos un carácter. Se <strong>de</strong>stacael HS 3x26 por tener la mayor cantidad <strong>de</strong> caracterescon valores significativos <strong>de</strong> ACE positivos; éste y28x4 son los híbridos <strong>de</strong> mayor efecto <strong>de</strong> ACE parapeso ver<strong>de</strong> <strong>de</strong> espiga. El HS 26x3 sobresalió en loscaracteres peso seco <strong>de</strong> planta entera y peso seco <strong>de</strong>espigas, mientras que 20x4 se <strong>de</strong>staca en porcentaje<strong>de</strong> materia seca <strong>de</strong> espiga y ambos pesos secos.Se observa que el híbrido 28x4, que involucracomo progenitor femenino una línea con ACGnegativa (línea 28), presentó un alto valor <strong>de</strong> ACEpara peso ver<strong>de</strong> <strong>de</strong> planta entera. Este efecto fue<strong>de</strong>scripto en maíces tropicales y subtropicales don<strong>de</strong>progenitores con efectos bajos o negativos <strong>de</strong> ACGprodujeron cruzas con alto valores en los caracteresrespectivos (Guillén-<strong>de</strong> la Cruz et al., 2009; De laCruz-Lázaro et al., 2010).Caracteres evaluados en fin <strong>de</strong> ciclo <strong>de</strong>l cultivoLos efectos <strong>de</strong> la ACE para los caracteres <strong>de</strong>fin <strong>de</strong> ciclo se muestran en la Tabla 7. Nuevehíbridos simples presentaron valores positivos ysignificativos <strong>de</strong> ACE. El híbrido 28x4 sobresaliópor tener los mayores valores <strong>de</strong> ACE para pesoseco <strong>de</strong> planta entera y espigas y número y peso <strong>de</strong>granos; 20x26 se <strong>de</strong>stacó en el mayor número <strong>de</strong>caracteres positivos incluyendo peso seco <strong>de</strong> plantaentera y espiga, número y peso <strong>de</strong> granos e índice<strong>de</strong> cosecha. 4x20 y 4x28 revelan valores aceptablespara peso seco <strong>de</strong> planta entera, aunque el segundo<strong>de</strong>staca en peso seco <strong>de</strong> espigas, número y peso <strong>de</strong>granos.La importancia <strong>de</strong> cada híbrido simple secuantificó en relación a sus efectos <strong>de</strong> aptitudcombinatoria específica posicionándolos <strong>de</strong> acuerdoa la cantidad <strong>de</strong> caracteres en don<strong>de</strong> dicho efecto <strong>de</strong>ACE fue positivo y significativo. De esta manerase i<strong>de</strong>ntificaron ocho híbridos simples que reúnenlas características buscadas, tanto para uso comoforraje para ensilar en estado lechoso-pastoso, comopara pastoreo diferido o producción <strong>de</strong> grano en fin<strong>de</strong> ciclo (Tabla 8).El híbrido 28x4 se <strong>de</strong>staca como posible genotipopara uso doble propósito; los híbridos 20x26, 4x28,4x20 y 4x3 tienen ten<strong>de</strong>ncia a la producción <strong>de</strong>forraje diferido o grano; y los híbridos 20x4, 3x26y 26x3 resultan favorables para la producción <strong>de</strong>forraje para ensilar en estado R 3-R 4.El HS 26x3, incluido en el listado anterior, <strong>de</strong>bióeliminarse <strong>de</strong>l programa <strong>de</strong> mejoramiento <strong>de</strong>bido ala escasa semilla existente y a la gran dificultad <strong>de</strong>producción <strong>de</strong> semilla viable que presenta el mismo.Esto es <strong>de</strong>bido a que la línea 26, involucrada en estehíbrido como progenitor femenino, posee gran<strong>de</strong>sinconvenientes a nivel <strong>de</strong> fertilidad y sanidad.Si bien se pudieron <strong>de</strong>tectar híbridos <strong>de</strong> losdiferentes tipos forrajeros consi<strong>de</strong>rados y en especial<strong>de</strong>l tipo doble propósito, será necesario confirmarsu comportamiento y productividad en diferentesambientes regionales contrastándolos con testigoscomerciales.Journal of Basic & Applied Genetics | 2012 | Volume 23 | Issue 2 | Article 5 - research
APTITUD COMBINATORIA EN EL MAÍZ PARA DOBLE PROPÓSITO40Variable 2004/05 2006/07 2007/08 MediaAP 210,00 ± 23,75 112,80 ± 26,38 206,31 ± 23,40 176,37±51,27TP 1,47 ± 0,38 1,10 ± 0,20 2,06 ± 0,68 1,54±0,61EP 1,51 ± 0,44 1,48 ± 0,43 2,46 ± 0,86 1,81±0,76ET 1,06 ± 0,24 1,36 ± 0,32 1,30 ± 0,37 1,24±0,34PVTLP 762,27 ± 242,15 803,22 ± 234,65 1093,65 ± 886,38±319,63PVELP 257,50 ± 84,48 170,74 ± 56,80 225,82 359,70 ± 91,72 218,02±86,56% EVLP 35,20 ± 7,52 21,28 ± 5,63 20,68 ± 3,68 25,72±8,90% ESLP 51,20 ± 10,40 29,28 ± 8,72 34,44 ± 8,61 38,31±13,19% MSELP 66,01 ± 9,15 37,13 ± 10,45 32,09 ± 8,74 45,08±17,70PSTLP 302,17 ± 123,38 215,54 ± 64,83 198,28 ± 62,76 238,67±98,97PSELP 157,75 ± 76,79 68,45 ± 31,92 72,42 ± 30,11 99,54±65,49% MSLP 43,44 ± 7,16 27,02 ± 6,48 18,25 ± 2,57 29,57±11,94PSTFC 251,48 ± 72,84 304,60 ± 99,09 472,62 ± 216,36 342,90±171,42PSEFC 156,81 ± 51,32 175,68 ± 64,23 197,33 ± 93,62 176,61±73,51NG 551,19 ± 184,29 640,35 ± 250,07 598,68 ± 267,65 596,74±238,49PG 129,59 ± 46,92 142,71 ± 56,25 154,73 ± 73,32 142,34±60,45P1000 234,47 ± 31,52 229,99 ± 30,14 258,74 ± 31,79 241,07±33,50IC 0,54 ± 0,21 0,45 ± 0,11 0,32 ± 0,08 0,43±0,17Tabla 1. Valores medios y <strong>de</strong>svíos estándares para caracteres analizados en Ensayos <strong>de</strong> AptitudCombinatoria Específica (EACE) <strong>de</strong> líneas endocriadas e híbridos simples <strong>de</strong> maíz entres ciclos <strong>de</strong> producción (2004/05, 2006/07, 2007/08). Río Cuarto, Córdoba.Ref.: AP= altura <strong>de</strong> planta (cm); TP= número <strong>de</strong> tallos por planta; EP= número <strong>de</strong>espigas por planta; ET= número <strong>de</strong> espigas por tallo; PVTLP= peso ver<strong>de</strong> (g) <strong>de</strong>planta entera en R3-R4; PVELP= peso ver<strong>de</strong> (g) <strong>de</strong> espigas sin chala por planta enR3-R4; %EVLP= % <strong>de</strong> espiga ver<strong>de</strong> por planta en R3-R4; % ESLP= % <strong>de</strong> espiga secapor planta en R3-R4; % MSELP= % <strong>de</strong> materia seca <strong>de</strong> espigas sin chala en R3-R4;PSTLP= peso seco (g) <strong>de</strong> planta entera en R3-R4; PSELP= peso seco (g) <strong>de</strong> espigassin chala/planta en R3-R4; % MSLP= % <strong>de</strong> materia seca total en R3-R4; PSTFC= pesoseco (g) <strong>de</strong> planta entera en fin <strong>de</strong> ciclo; PSEFC= peso seco (g) <strong>de</strong> espigas sin chala porplanta en fin <strong>de</strong> ciclo; NG= número <strong>de</strong> granos por planta; PG= peso (g) <strong>de</strong> granos porplanta; P1000= peso (g) <strong>de</strong> 1000 granos; IC= índice <strong>de</strong> cosecha.Fuente <strong>de</strong>VariaciónAP TP EP ETHíbrido 12,04 ns 2,20 ns 2,68 ns 2,10 nsACG. 8,04 ** 3,48 ns 7,96 ** 6,87 *ACE. 32,48 *** 2,42 * 2,20 ns 2,53 *ER 0,56 ns 1,21 ns 0,61 ns 0,51 nsHíbrido x Año 1,06 ns 0,76 ns 0,13 ns 0,38 nsACG x Año 2,54 ** 0,82 ns 0,17 ns 0,23 nsACE x Año 0,67 ns 0,88 ns 0,08 ns 0,43 nsER x Año 0,85 ns 0,62 ns 0,15 ns 0,40 nsTabla 2. Valores <strong>de</strong> F y significación <strong>de</strong>l análisis <strong>de</strong> varianza conjunta para caracteresmorfofisiológicos en los Ensayos <strong>de</strong> Aptitud Combinatoria Específica (EACE) <strong>de</strong>híbridos simples y líneas endocriadas <strong>de</strong> maíz (2004/05, 2006/07, 2007/08). RíoCuarto, Córdoba.REF: AP= altura <strong>de</strong> planta (cm); TP= número <strong>de</strong> tallos por planta; EP= número <strong>de</strong>espigas por planta; ET= número <strong>de</strong> espigas por tallo; ACG= aptitud combinatoriageneral; ACE.= aptitud combinatoria específica directa; ER= ACE efecto recíproco.*, **, *** = significativo para p
41 APTITUD COMBINATORIA EN EL MAÍZ PARA DOBLE PROPÓSITOFuente <strong>de</strong>VariaciónPVTLP PVELP %EVLP %ESLP %MSELP PSTLP PSELP %MSLPHíbrido 4,04ns 4,68ns 4,69ns 7,12ns 4,20ns 3,14ns 2,87ns 2,24nsACG. 3,56ns 4,34* 7,67** 9,62** 3,33ns 1,20ns 1,85ns 2,74nsACE. 8,85*** 11,30*** 2,61* 11,34*** 7,64*** 11,06*** 6,23*** 2,51*ER 0,38ns 0,31ns 3,48** 1,17ns 1,97ns 0,46ns 0,49ns 1,31nsHíbrido x Año 0,57ns 0,55ns 0,44ns 0,49ns 0,76ns 1,12ns 1,34ns 1,29nsACG x Año 0,52ns 0,38n 0,99ns 0,83ns 1,77ns 0,85ns 0,88ns 3,22**ACE x Año 0,52ns 0,47ns s0,45ns 0,41ns 0,54ns 0,66ns 1,25ns 0,88nsER x Año 0,65ns 0,69ns 0,21ns 0,43ns 0,56ns 1,69* 1,62* 0,93nsTabla 3. Valores <strong>de</strong> F y significación <strong>de</strong>l análisis <strong>de</strong> varianza conjunta para caracteres en estado R3-R4en los Ensayos <strong>de</strong> Aptitud Combinatoria Específica (EACE) <strong>de</strong> híbridos simples y líneasendocriadas <strong>de</strong> maíz (2004/05, 2006/07, 2007/08). Río Cuarto, Córdoba.Ref: PVTL= peso ver<strong>de</strong> (g) <strong>de</strong> planta entera en R3-R4; PVELP= peso ver<strong>de</strong> (g) <strong>de</strong> espigassin chala por planta en R3-R4; % EVLP= % <strong>de</strong> espiga ver<strong>de</strong> por planta en R3-R4; % ESLP=% <strong>de</strong> espiga seca por planta en R3-R4; % MSELP= % <strong>de</strong> materia seca <strong>de</strong> espigas sin chala enR3-R4; PSTLP= peso seco (g) <strong>de</strong> planta entera en R3-R4; PSELP= peso seco (g) <strong>de</strong> espigassin chala/planta en R3-R4; % MSLP= % <strong>de</strong> materia seca total en R3-R4; ACG= aptitudcombinatoria general; ACE= aptitud combinatoria específica directa; ER= ACE. efectorecíproco. *, **, *** = significativo para p < 0,05, p < 0,01 y p < 0,001, respectivamente; ns =no significativo.Fuente <strong>de</strong>VariaciónPSTFC PSEFC NG PG P1000 ICHíbrido 3,70 ns 5,62 ns 3,16 ns 5,27 ns 4,97 ns 3,43 nsACG 2,74 ns 1,59 ns 0,23 ns 0,88 ns 16,83 *** 2,86 nsACE 6,63 *** 11,01 *** 5,65 *** 9,36 *** 5,67 *** 4,93 **ER ER1,22 ns 1,37 ns 1,15 ns 1,56 ns 0,44 ns 1,02 nsHíbrido x Año 0,74 ns 0,62 ns 1,11 ns 0,77 ns 0,62 ns 0,42 nsACG. x Año 0,96 ns 0,70 ns 1,24 ns 0,68 ns 0,53 ns 0,33 nsACE x Año 0,71 ns 0,65 ns 1,29 ns 0,91 ns 0,62 ns 0,56 nsER x AñoER0,69 ns 0,56 ns 0,88 ns 0,68 ns 0,65 ns 0,32 nsTabla 4. Valores <strong>de</strong> F y significación <strong>de</strong>l análisis <strong>de</strong> varianza conjunta para caracteres en fin <strong>de</strong> cicloen los Ensayos <strong>de</strong> Aptitud Combinatoria Específica (EACE) <strong>de</strong> híbridos simples y líneasendocriadas <strong>de</strong> maíz (2004/05, 2006/07, 2007/08). Río Cuarto, Córdoba.Ref.: PSTFC= peso seco (g) <strong>de</strong> planta entera en fin <strong>de</strong> ciclo; PSEFC= peso seco (g) <strong>de</strong>espigas sin chala por planta en fin <strong>de</strong> ciclo; NG= número <strong>de</strong> granos por planta; PG= peso(g) <strong>de</strong> granos por planta; P1000= peso (g) <strong>de</strong> 1000 granos; IC= índice <strong>de</strong> cosecha; ACG=aptitud combinatoria general; ACE= aptitud combinatoria específica directa; ER= ACE efectorecíproco. *, **, *** = significativo para p < 0,05, p < 0,01 y p < 0,001, respectivamente; ns=no significativo.Journal of Basic & Applied Genetics | 2012 | Volume 23 | Issue 2 | Article 5 - research
APTITUD COMBINATORIA EN EL MAÍZ PARA DOBLE PROPÓSITO42MaterialGenéticoAP TP EP ET3x3 -24,44** -0,06 -0,18 0,093x4 5,37 -0,01 -0,01 -0,17*3x20 9,2* 0,04 0,06 -0,0023x26 9,17* 0,04 0,22 0,023x28 0,7 -0,01 -0,01 0,064x3 (1) 1,11 0,01 -0,01 -0,17*4x4 -36,11** -0,09 0,16 0,46**4x20 15,78** 0,02 -0,1 -0,064x26 5,09 0,06 -0,17 -0,114x28 9,87* 0,02 0,11 -0,1320x3 (1) 8,37* 0,02 0,04 -0,0620x4 (1) 15,41** 0,05 -0,16 -0,1420x20 -46,96** -0,09 -0,22 -0,0120x26 13,18** 0,01 0,24 0,0620x28 8,8* 0,02 0,01 0,0126x3 (1) 13,89** 0,03 0,03 0,0726x4 (1) 7,41 a 0,05 -0,28 -0,15 a26x20 (1) 7,99 a 0,03 0,11 0,18 a26x26 -32,96** -0,12 -0,2 0,0626x28 5,52 0,01 -0,09 -0,0428x3 (1) 0,89 0,01 0,12 0,1128x4 (1) 8,85* 0,02 0,31 a -0,0628x20 (1) 7,04 a 0,04 -0,05 028x26 (1) 3,48 0,013 -0,09 028x28 -24,89** -0,05 0,06 0,01Tabla 5. Valores <strong>de</strong> aptitud combinatoria especifica para caracteres morfofisiológicos en 20híbridos simples y 5 líneas endocriadas progenitoras <strong>de</strong> maíz (2004/05, 2006/07,2007/08). Río Cuarto, Córdoba.Ref.: AP= altura <strong>de</strong> planta (cm); TP= número <strong>de</strong> tallos por planta; EP= número <strong>de</strong>espigas por planta; ET= número <strong>de</strong> espigas por tallo. Significación a través <strong>de</strong> unaprueba t: asignificativo al 10 %; *significativo al 5 %; **significativo al 1 %. (1)híbrido simple analizado a través <strong>de</strong> su efecto recíproco.Journal of Basic & Applied Genetics | 2012 | Volume 23 | Issue 2 | Article 5 - research
43 APTITUD COMBINATORIA EN EL MAÍZ PARA DOBLE PROPÓSITOMaterialGenéticoPVTLP PVELP %EVLP %ESLP %MSELP PSTLP PSELP %MSLP3x3-262,89** -84,14** -0,02 -0,06 a -2,87 -70,42*-44,08**-1,523x4 96,67 14,5 -0,01 -0,01 0,31 0,02 -4,77 0,073x20 120,07 27,2 0,01 0,04 2,77 30,15 18,03 -0,643x26 92,93 53,08** 0,03* 0,04 2,78 52,23 a 36,89** 3,01 a3x28 -46,77 -10,62 -0,003 -0,01 -2,98 -11,98 -6,06 -0,934x3 (1) 69,56 8,09 0 0,01 1,04 -14,55 -5,827 0,0934x4-279,86** -87,05** -0,03* -0,09** -9,36** -74,21* -42,64**-3,28*4x20 53,8 24,37 0,02 0,02 0,52 22,8 11,26 1,554x26 7,33 10,68 0,01 0,06 a 5,36* 13,89 14,57 1,54x28 122,05 37,5 a 0,01 0,02 3,18 37,5 21,58 0,1720x3 (1) 158,81* 24,7 -0,01 0,02 1,79 17,01 8,07 -0,5220x4 (1) 31,73 21,56 0,03* 0,05 a 6,51* 46,62 a 29,09* 2,6220x20- -- --0,02 -0,09** -7,87**412,02** 112,81**118,33* 54,78**-1,5520x26 139,86 a 32,23 -0,004 0,01 1,14 36,64 12,21 -0,3720x28 98,29 29,03 0,001 0,02 3,44 28,73 13,28 1,0226x3 (1) 108,06 36,76 a -0,01 0,03 1,45 79,67* 51,11** 0,0226x4 (1) 88,13 27,55 0,005 0,05 a 2,76 17,02 12,98 0,0326x20 (1) 121,05 28,6 -0,004 0,03 -0,86 18,18 8,47 -1,1126x26 -269** -97,07** -0,04** -0,12** -8,82**- -111,94* 68,55**-4,38**26x28 28,87 1,08 0,01 0,01 -0,47 9,19 4,88 0,2428x3 (1) -13,27 1,86 0,007 0,01 -1,23 -7,96 -0,99 0,8428x4 (1) 183,01* 53,21* 0,015 0,02 3,12 28,17 16,46 0,4128x20 (1) 89,42 39,29* 0,021 0,04 3,3 17,21 13,11 0,8828x26 (1) -10,41 -3,31 0,02 0,007 -0,99 -19,01 -11,1 1,8828x28-202,44** -56,99** -0,02 -0,05 -3,17 -63,43* -33,68**-0,49Tabla 6. Valores <strong>de</strong> aptitud combinatoria específica para caracteres en estadoR3-R4 en 20 híbridos simples y 5 líneas progenitoras <strong>de</strong> maíz (2004/05,2006/07, 2007/08). Río Cuarto, Córdoba.Ref: PVTLP= peso ver<strong>de</strong> (g) <strong>de</strong> planta entera en R3-R4; PVELP= pesover<strong>de</strong> (g) <strong>de</strong> espigas sin chala por planta en R3-R4; % EVLP= % <strong>de</strong>espiga ver<strong>de</strong> por planta en R3-R4; % ESLP= % <strong>de</strong> espiga seca por plantaen R3-R4; % MSELP =% <strong>de</strong> materia seca <strong>de</strong> espigas sin chala en R3-R4;PSTLP= peso seco (g) <strong>de</strong> planta entera en R3-R4; PSELP= peso seco (g)<strong>de</strong> espigas sin chala/planta en R3-R4; % MSLP= % <strong>de</strong> materia seca totalen R3-R4. Significación a través <strong>de</strong> una prueba t: asignificativo al 10 %;*significativo al 5 %; **significativo al 1 %. (1) híbrido simple analizadoa través <strong>de</strong> su efecto recíproco.Journal of Basic & Applied Genetics | 2012 | Volume 23 | Issue 2 | Article 5 - research
APTITUD COMBINATORIA EN EL MAÍZ PARA DOBLE PROPÓSITO44MaterialgenéticoPSTFC PSEFC NG PG P1000 IC3x3 -75,35 a -51,42** -149,35** -46,28**-23,79**-0,06 a3x4 34,75 21,06 32,54 15,65 10,33 -0,013x20 16,83 11,34 59,86 12,71 7,71 0,043x26 19,15 15,63 36,26 13,52 0,77 0,033x28 4,61 3,39 20,69 4,4 4,99 -0,0034x3 (1) 46,68 37,84* 79,33 29,77* 12,97 a 0,014x4 -170,67** -103,5** -276,5 -87,63**-39,76**-0,12**4x20 65,63 a 24,17 89,71 a 23,65 a 9,25 0,06 a4x26 -3,12 18,02 11,18 11,19 13,95 a 0,034x28 73,42 a 40,26* 143,08* 37,15** 6,23 0,0420x3 (1) 0,98 -0,7 13,8 2,52 4,83 0,0320x4 (1) 58,52 22,33 96,26 a 21,25 0,68 020x20 -180,59** -109,67** -403,64** -94,9-26,23**-0,23**20x26 72,94 a 47,47** 156,9** 40,9** 6,9 0,11**20x28 25,2 26,69 97,17 a 17,64 2,37 0,0226x3 (1) 24,73 -1,8 -37,39 -2,14 4,32 -0,0126x4 (1) 19,42 21,72 30,71 19,69 13,86 a 0,06 a26x20 (1) 4,38 14,86 27,49 8,88 5,56 0,16**26x26 -107,35** -85,44** -194,03** -69,79**-29,75**-0,17**26x28 18,39 4,32 -10,32 4,18 8,13 0,0128x3 (1) 3,57 3,84 21,9 9,85 10,84 0,00728x4 (1) 133,24** 56,39 a 199,54** 48,51** 5,23 0,0328x20 (1) 0,46 23,45 61,18 8,85 -0,08 0,0428x26 (1) -21,87 -20,87 -67,27 -16,3 -0,79 -0,0128x28 -121,61** -74,65** -250,62** -63,37**-21,73**-0,06Tabla 7. Valores <strong>de</strong> aptitud combinatoria específica para los caracteres analizados en fin <strong>de</strong> cicloen 20 híbridos simples y 5 líneas endocriadas progenitoras <strong>de</strong> maíz (2004/05, 2006/07,2007/08). Río Cuarto, Córdoba.Ref: PSTFC= peso seco (g) <strong>de</strong> planta entera en fin <strong>de</strong> ciclo; PSEFC= peso seco (g) <strong>de</strong>espigas sin chala por planta en fin <strong>de</strong> ciclo; NG= número <strong>de</strong> granos por planta; PG=peso (g) <strong>de</strong> granos por planta; P1000= peso (g) <strong>de</strong> 1000 granos; IC= índice <strong>de</strong> cosecha.Significación a través <strong>de</strong> una prueba t: asignificativo al 10 %; *significativo al 5 %; **significativo al 1 %. (1) híbrido simple analizado a través <strong>de</strong> su efecto recíproco.N° <strong>de</strong> caracteressegún su significaciónN° <strong>de</strong> caracteressegún el estadofenológicoHíbrido 0,01 0,05 0,1 Total MF LP FC28x4 4 2 2 8 2 2 420x26 5 2 7 1 1 520x4 1 4 2 7 1 5 13x26 2 3 1 6 1 54x28 2 2 2 6 1 1 44x20 1 4 5 1 426x3 3 1 4 1 34x3 2 1 3 1 2Tabla 8. Número <strong>de</strong> caracteres con valor positivo y significativo <strong>de</strong> aptitud combinatoriaespecífica para los híbridos simples <strong>de</strong> maíz seleccionados (2004/05, 2006/07,2007/08). Río Cuarto, Córdoba.Ref.: MF= caracteres morfofisiológicos; LP= caracteres medidos en estado R3-R4;FC= caracteres medidos a fin <strong>de</strong> ciclo.Journal of Basic & Applied Genetics | 2012 | Volume 23 | Issue 2 | Article 5 - research
45 APTITUD COMBINATORIA EN EL MAÍZ PARA DOBLE PROPÓSITOCONCLUSIONESLos ensayos permitieron <strong>de</strong>terminar laaptitud combinatoria específica <strong>de</strong> cinco líneasendocriadas <strong>de</strong> maíz a través <strong>de</strong> los 20 híbridossimples originados en el cruzamiento dialélico. Sei<strong>de</strong>ntificaron materiales con diferentes aptitu<strong>de</strong>s <strong>de</strong>uso.El híbrido simple 28x4 fue seleccionado porsu ACE presentando valores promisorios comodoble propósito. Los híbridos simples 20x26, 4x28,4x20 y 4x3 mostraron un comportamiento similar,mejor adaptados a la producción <strong>de</strong> forraje diferidoy grano. Por último, el análisis dialélico <strong>de</strong>tectó alos híbridos simples 20x4 y 3x26 como materialesmejor adaptados a la producción <strong>de</strong> forraje en estadoR 3-R 4.BIBLIOGRAFÍAAllard R.W. (1978) Principios <strong>de</strong> la mejora genética<strong>de</strong> las plantas. Editorial Omega. Barcelona,España.Arias S., Freddi A.J., Sánchez O., Arzadún M. (2003)Rendimiento <strong>de</strong> materia seca y composiciónmorfológica <strong>de</strong> híbridos <strong>de</strong> sorgo y maíz parasilaje <strong>de</strong> planta entera. XXVI Congr. Arg. Prod.Animal, RAPA 23 Supl. 1: 221-222. Mendoza.CACF (2012) Cámara <strong>Argentina</strong> <strong>de</strong> ContratistasForrajeros.Castaldo A., Pariani A., Bulnes N., Illuminati H.(2009) Evaluación <strong>de</strong> un cultivo <strong>de</strong> maizal enestado diferido. Ciencia Veterinaria 11 (1): 37-41.Castañon-Nájera G., Latournerie-Moreno L.,Mendoza-Elos M. (2005) Macro <strong>de</strong> SAS-IMLpara analizar los diseños II y IV <strong>de</strong> Griffins.Universidad y Ciencia 21: 27-35.Centeno A., Cortés E., Gallo E. (2009) Evaluación<strong>de</strong> híbridos <strong>de</strong> maíz para silo. Campaña 2008-09. Hoja <strong>de</strong> Información Técnica. UEE-INTASan Francisco-IPEM N° 222.Centeno A., Cortés E., Ciacci M.B. (2010)Evaluación <strong>de</strong> híbridos <strong>de</strong> maíz para silo.Campaña 2009-10. Hoja <strong>de</strong> InformaciónTécnica. UEE San Francisco. INTA. http://www.produccion-Animal.com.ar/produccion_y_manejo_reservas/reservas_ silos/148informe_maices_sileros_09-10.pdf (acceso julio 2012).Cirilo A.G. (2004) Fecha <strong>de</strong> siembra y rendimientoen maíz. IDIA XXI 6: 122-127.Crow J.F. (1998) 90 Years Ago: The Beginning ofHybrid Maize. Genetics 148: 923-928.Cruz C.D. (2006) Programa Genes: Biometría.Editora UFV. Viçosa (MG), Brasil.De la Cruz-Lázaro E., Castañón-Najera G., Brito-Manzano N., Gómez-Vásquez A., Robledo-Torres V., Lozano <strong>de</strong>l Río A. (2010) Heterosisy aptitud combinatoria <strong>de</strong> poblaciones <strong>de</strong> maíztropical ΦYTON (Buenos Aires) 79 (1): 11-17.De León M., Giménez R.A., Ruolo M.S. (2011)Caracterización y variabilidad <strong>de</strong> distintosgenotipos <strong>de</strong> maíz para ensilaje. EEA INTAManfredi. http://www.inta.gob.ar/documentos/caracterizacion-y-variabilidad-<strong>de</strong>-distintosgenotipos-<strong>de</strong>-maiz-para-ensilaje/(acceso julio2012).Di Nucci <strong>de</strong> Be<strong>de</strong>ndo E., Firpo M.V., Martínez M.Del H. (2009) Aptitud silera <strong>de</strong> híbridos <strong>de</strong> maíz(Campaña 2008/09). INTA EEA Paraná. http://inta.gob.ar/parana/info/documentos/aptitudsilera-<strong>de</strong>-hibridos-<strong>de</strong>-maiz-campaña-2008-09/(acceso julio 2012).Ferraris G. (2004) Ensayo comparativo <strong>de</strong> híbridoscomerciales <strong>de</strong> maíz en el área <strong>de</strong> Colón-Wheelwright. Campaña 2003/04. ProyectoRegional Agrícola. INTA Pergamino. http://www.elsitioagricola.com/articulos/ferraris/Ensayocomparativo<strong>de</strong>hibridoscomerciales<strong>de</strong>Maizenelarea<strong>de</strong>Colon-Wheelwright.asp (acceso junio2012).Fussell B. (1999) The story of corn. North PointPress, NY, USA.Journal of Basic & Applied Genetics | 2012 | Volume 23 | Issue 2 | Article 5 - research
APTITUD COMBINATORIA EN EL MAÍZ PARA DOBLE PROPÓSITO46Gallais A., Pollacsek M., Huguet L. (1976)Possibilites <strong>de</strong> selection du mais en tant queplant fourragere. Ann. Amelior. Plantes 26: 591-605.Gorostegui J. (1971) Varieda<strong>de</strong>s vegetales <strong>de</strong>lINTA, cultivares creados e introducidos <strong>de</strong>s<strong>de</strong>1958. Serie: Colección agropecuaria <strong>de</strong>l INTA19. Buenos Aires.Grassi E. (2009) Caracterización genética <strong>de</strong> maízlocal con fines forrajeros. Tesis Maestría enCiencias Agropecuarias. Facultad <strong>de</strong> Agronomíay Veterinaria. Universidad Nacional <strong>de</strong> RíoCuarto. Río Cuarto, Córdoba.Grassi E., Szpiniak B., Ferreira V. (2006) Estimación<strong>de</strong> la productividad y variación <strong>de</strong> líneasendocriadas <strong>de</strong> maíz para doble propósito. Rev.Univ. Nac. Río Cuarto 26 (1-2): 3-13.Grassi E., Reynoso L., Brun A., Ferreira A., CastilloE., Ferreira V. (2009) Líneas endocriadas <strong>de</strong>maíz: materia seca, aptitud combinatoria yagrupamiento según posibilida<strong>de</strong>s <strong>de</strong> uso. Rev.Univ. Nac. <strong>de</strong> Río Cuarto 29 (1-2): 19-36.Griffins B. (1956) Concept of general and specificcombining ability in relation to diallel crossingsistems. Aust. Jour. Biol. Sci. 9: 463-493.Guillén-De la Cruz E., De la Cruz–Lázaro E.,Castañon-Nájera G., Osorio-Osorio R., Brito-Manzano N.P., Lozano-Del Río A., López-Noverola U. (2009) Aptitud combinatoriageneral y específica <strong>de</strong> germoplasma tropical <strong>de</strong>maíz. Tropical and Subtropical Agroecosystems10: 101-107.Gutiérrez <strong>de</strong>l Río E., Espinoza Banda A., PalomoGil A., Lozano García J., Antuna O. (2004)Aptitud combinatoria <strong>de</strong> híbridos <strong>de</strong> maíz parala comarca Lagunera. Rev. Fitotecnia Mexicana27 (1): 7-11.Hallauer A.R., Miranda Filho J.B. (1988)Quantitative genetics in maize breeding. IowaState University Press, Ames, Iowa. U.S.A.Iltis H., Doebley J. (1980) Taxonomy of Zea(Gramineae). II. Subespecific categories inthe Zea mays complex and a generic synopsis.Amer. J. Bot. 67 (6): 994-1004.INDEC (2005) Instituto Nacional <strong>de</strong> Estadísticay Censos. Encuesta Nacional Agropecuaria.Buenos Aires. <strong>Argentina</strong>.Lonnquist J. (1964) A modification of the ear-torowprocedure for the improvement of maizepopulations. Crop Sci. 4: 227-228.Magoja J., Pischedda G. (1988) Aptitudcombinatória <strong>de</strong> progênies S1 <strong>de</strong>rivadas <strong>de</strong> umapoblación com introgresión <strong>de</strong> germoplasmasilvestre. XIX Congreso Argentino <strong>de</strong> Genética.UNJujuy. 28 <strong>de</strong> agosto-1 <strong>de</strong> septiembre. p.78.Maizar (2012) Asociación Maíz Argentino.Maresca S., Echeverri D., Quiroz J.L. (2006)Ensayo comparativo <strong>de</strong> sorgo y maíz diferidopara vacas <strong>de</strong> cría. EEA INTA Cuenca <strong>de</strong>lSalado; EEA INTA Balcarce. http://www.inta.gob.ar/documentos/ensayo-comparativo-<strong>de</strong>sorgo-y-maiz-diferido-para-vacas-<strong>de</strong>-cria.pdf(acceso abril 2012).Paccapelo H., Molas M. (1996) Caracterización <strong>de</strong>una población <strong>de</strong> maíz forrajero con introgresión<strong>de</strong> Zea diploperennis. Revista <strong>de</strong> investigacionesAgropecuarias Vol. 27 (1): 33-38.Paliwal R.L., Granados G., Lafitte H.R., Violic A.D.,Marathee J.P. (2001) El maíz en los trópicos:mejoramiento y producción. Usos <strong>de</strong>l maíz.En: Colección FAO: Producción y ProtecciónVegetal, N° 28. FAO, Rome (Italy).Quemé <strong>de</strong> León J., Larios Bobadilla L., Pérez RodasC., Soto León N. (1991) Aptitud combinatoria ypredicción <strong>de</strong> híbridos <strong>de</strong> maíz (Zea mays L.)<strong>de</strong> grano amarillo a partir <strong>de</strong> cruzas dialélicas,evaluadas en dos localida<strong>de</strong>s <strong>de</strong> la zona baja <strong>de</strong>Guatemala, 1989. Agronomía Mesoamericana2: 24-30.Journal of Basic & Applied Genetics | 2012 | Volume 23 | Issue 2 | Article 5 - research
47 APTITUD COMBINATORIA EN EL MAÍZ PARA DOBLE PROPÓSITOReynoso L. (1996) Variabilidad genética paramacollamiento y rebrote en el género Zea. MSc.Tesis Posgrado en Mejoramiento GenéticoVegetal. Fac. Cs. Agrarias, UN Rosario, SantaFe, <strong>Argentina</strong>.Russell A.W. (1973) Desarrollo y evaluación <strong>de</strong>líneas endocriadas <strong>de</strong> maíz. Fundación Cargill,Publicación Nº 2, Buenos Aires, <strong>Argentina</strong>.SIIA (2012) Sistema Integrado <strong>de</strong> InformaciónAgropecuaria. Ministerio <strong>de</strong> Agricultura,Gana<strong>de</strong>ría y Pesca. <strong>Argentina</strong>.Sprague G.F., Tatum L.A. (1942) General vs.specific combining ability in single crosses ofcorn. J. Amer. Soc. Agron. 34: 923-932.Steel D., Torrie J. (1988) Bioestadística: Principiosy procedimientos. Editorial McGraw-Hill/Interamericana, México.Torrecillas M., Bertoia L. (2000) Aptitudcombinatoria para caracteres forrajeros enpoblaciones nativas y compuestos raciales <strong>de</strong>maíz en <strong>Argentina</strong>. Invest. Agr. Prod. Prot. Veg.15: 80-90.Troiani H., Paccapelo H., Golberg A. (1988)Descripción botánica <strong>de</strong>l híbrido interespecíficoentre Zea mays x Zea diploperennis. Rev. Fac.Agronomía. UNLPam. Vol 3 Nº 2: 53-58.Ventimiglia L., Torrens Baudrix L. (2012) Ensayohíbridos <strong>de</strong> maíz 2011/12 (9 <strong>de</strong> Julio B.Aires). EEA Pergamino. AER 9 <strong>de</strong> Julio. INTAPergamino. http://inta.gob.ar/documentos/ensayo-hibridos-<strong>de</strong>-maiz-2011-12-9-<strong>de</strong>-juliobs.as1/atmultidownload/file?name=Ensayo_Híbridos_maíz_2011_12_9 Julio.pdf (accesojulio 2012).Watson S.A. (1988) Corn marketing, processing,and utilization. In: Sprague G.F., Dudley J.W.(Eds.) Corn and corn improvement. AmericanSociety of Agronomy. Madison, WI, USA, pp.882-940.Journal of Basic & Applied Genetics | 2012 | Volume 23 | Issue 2 | Article 5 - research