
Create successful ePaper yourself
Turn your PDF publications into a flip-book with our unique Google optimized e-Paper software.
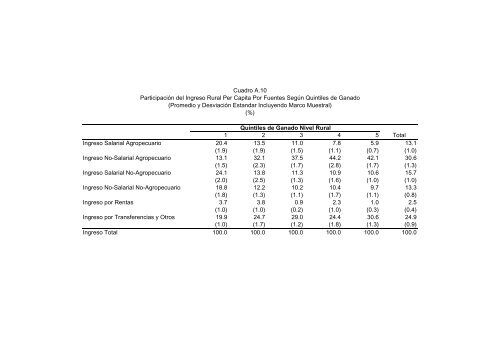
Cuadro A.10Participación del Ingreso Rural Per Capita Por Fuentes Según Quintiles de Ganado(Promedio y Desviación Estandar Incluyendo Marco Muestral)(%)Quintiles de Ganado Nivel Rural1 2 3 4 5 TotalIngreso Salarial Agropecuario 20.4 13.5 11.0 7.8 5.9 13.1(1.9) (1.9) (1.5) (1.1) (0.7) (1.0)Ingreso No-Salarial Agropecuario 13.1 32.1 37.5 44.2 42.1 30.6(1.5) (2.3) (1.7) (2.8) (1.7) (1.3)Ingreso Salarial No-Agropecuario 24.1 13.8 11.3 10.9 10.6 15.7(2.0) (2.5) (1.3) (1.6) (1.0) (1.0)Ingreso No-Salarial No-Agropecuario 18.8 12.2 10.2 10.4 9.7 13.3(1.8) (1.3) (1.1) (1.7) (1.1) (0.8)Ingreso por Rentas 3.7 3.8 0.9 2.3 1.0 2.5(1.0) (1.0) (0.2) (1.0) (0.3) (0.4)Ingreso por Transferencias y Otros 19.9 24.7 29.0 24.4 30.6 24.9(1.0) (1.7) (1.2) (1.8) (1.3) (0.9)Ingreso Total 100.0 100.0 100.0 100.0 100.0 100.0