Wind-driven coastal circulation in the Gulf of Tehuantepec, Mexico ...
Wind-driven coastal circulation in the Gulf of Tehuantepec, Mexico ...
Wind-driven coastal circulation in the Gulf of Tehuantepec, Mexico ...

You also want an ePaper? Increase the reach of your titles
YUMPU automatically turns print PDFs into web optimized ePapers that Google loves.
Ciencias Mar<strong>in</strong>as (2011), 37(4A): 443–456<strong>W<strong>in</strong>d</strong>-<strong>driven</strong> <strong>coastal</strong> <strong>circulation</strong> <strong>in</strong> <strong>the</strong> <strong>Gulf</strong> <strong>of</strong> <strong>Tehuantepec</strong>, <strong>Mexico</strong>CMCirculación costera forzada por el viento en el golfo de <strong>Tehuantepec</strong>, MéxicoFA Velázquez-Muñoz 1 *, JA Martínez 1 , C Chavanne 2,3 , R Durazo 1 , P Flament 21Facultad de Ciencias Mar<strong>in</strong>as, Universidad Autónoma de Baja California, Km 103 Carretera Tijuana-Ensenada,Ensenada, CP 22860, Baja California, México.2Departament <strong>of</strong> Oceanography, School <strong>of</strong> Ocean and Earth Science and Technology, University <strong>of</strong> Hawaii atManoa, Honolulu, Hawaii, USA.3School <strong>of</strong> Environmental Sciences, University <strong>of</strong> East Anglia, Norwich NR4 7TJ, UK.* Correspond<strong>in</strong>g author. E-mail: federico.velazquez@uabc.edu.mxABSTRACT. Sea surface current measurements and w<strong>in</strong>d stress and sea surface temperature satellite data were used to study <strong>the</strong> effect <strong>of</strong>nor<strong>the</strong>rly w<strong>in</strong>d events (Tehuanos) on <strong>coastal</strong> dynamics <strong>in</strong> <strong>the</strong> <strong>Gulf</strong> <strong>of</strong> <strong>Tehuantepec</strong>, <strong>Mexico</strong>. The w<strong>in</strong>ter 2005 observations show a significantchange <strong>in</strong> <strong>the</strong> <strong>in</strong>tensity and direction <strong>of</strong> surface currents dur<strong>in</strong>g w<strong>in</strong>d events, which is reflected <strong>in</strong> an <strong>in</strong>crease <strong>in</strong> k<strong>in</strong>etic energy and negativerelative vorticity. The analysis revealed that k<strong>in</strong>etic energy <strong>of</strong> <strong>the</strong> <strong>coastal</strong> current decreases (<strong>in</strong>creases) <strong>in</strong> periods when <strong>the</strong>re is absence(presence) <strong>of</strong> Tehuano w<strong>in</strong>d events, and that <strong>the</strong> relative vorticity has a tendency to positive values under low w<strong>in</strong>d conditions and a tendency tonegative values dur<strong>in</strong>g high w<strong>in</strong>d events. An asymmetric ocean response was observed due to w<strong>in</strong>d stress forc<strong>in</strong>g and <strong>the</strong> <strong>in</strong>teraction between apersistent <strong>coastal</strong> current and <strong>of</strong>fshore w<strong>in</strong>d stress.Key words: <strong>Gulf</strong> <strong>of</strong> <strong>Tehuantepec</strong>, <strong>coastal</strong> countercurrent, w<strong>in</strong>d-<strong>driven</strong> current, ocean eddies, <strong>of</strong>fshore w<strong>in</strong>d.RESUMEN. Con base en mediciones de corrientes superficiales del océano e <strong>in</strong>formación satelital de vientos y temperatura superficial delocéano, se estudió el efecto de los eventos de viento del norte (tehuanos) sobre la d<strong>in</strong>ámica costera en el golfo de <strong>Tehuantepec</strong>, México. Lasobservaciones realizadas durante el <strong>in</strong>vierno de 2005 mostraron un cambio significativo en la <strong>in</strong>tensidad y dirección de las corrientessuperficiales durante los eventos de viento, que se vio reflejado en un aumento de la energía c<strong>in</strong>ética y de la vorticidad relativa negativa. Elanálisis mostró que la energía c<strong>in</strong>ética de la corriente costera decrece (<strong>in</strong>crementa) en los periodos cuando hay ausencia (presencia) de eventosde viento tehuano, y que la vorticidad relativa presenta una tendencia a valores positivos bajo condiciones de viento débil y una notoriatendencia a valores negativos durante los eventos de viento <strong>in</strong>tenso. Se observó una asimetría en la respuesta del océano por el forzamiento delesfuerzo del viento y la <strong>in</strong>teracción entre una corriente costera persistente y el viento normal a la costa.Palabras clave: Golfo de <strong>Tehuantepec</strong>, contracorriente costera, corriente forzada por viento, remol<strong>in</strong>os oceánicos, viento normal a la costa.INTRODUCTIONIn w<strong>in</strong>ter, <strong>coastal</strong> ocean <strong>circulation</strong> <strong>in</strong> <strong>the</strong> <strong>Gulf</strong> <strong>of</strong><strong>Tehuantepec</strong> (GT; 16º N, 95º W) is strongly controlled by aseries <strong>of</strong> nor<strong>the</strong>rly w<strong>in</strong>d events known as Nortes or Tehuanos.These w<strong>in</strong>ds are produced when <strong>the</strong>re is a difference <strong>in</strong>atmospheric pressure between <strong>the</strong> <strong>Gulf</strong> <strong>of</strong> <strong>Mexico</strong> and <strong>the</strong>tropical Pacific, caus<strong>in</strong>g w<strong>in</strong>d to flow through <strong>the</strong> Isthmus<strong>of</strong> <strong>Tehuantepec</strong> and fan out over <strong>the</strong> waters <strong>of</strong> <strong>the</strong> GT(Steenburgh et al. 1998, Romero-Centeno et al. 2003).Tehuanos are <strong>of</strong> such an <strong>in</strong>tensity that <strong>the</strong>y generate nearshoremesoscale eddies and cool<strong>in</strong>g (Barton et al. 1993,Trasviña et al. 1995). Wyrtki (1965) and Kessler (2002)reported that w<strong>in</strong>ter <strong>circulation</strong> <strong>in</strong> <strong>the</strong> Tropical EasternPacific is characterized by a poleward geostrophic flow along<strong>the</strong> coast <strong>of</strong> Central America and <strong>Mexico</strong>. When a w<strong>in</strong>devent occurs, <strong>coastal</strong> <strong>circulation</strong> <strong>in</strong> <strong>the</strong> GT is significantlymodified.Several studies have reported <strong>the</strong> formation <strong>of</strong> mesoscaleeddies, which <strong>in</strong> satellite imagery are identified as areas <strong>of</strong>INTRODUCCIÓNDurante el <strong>in</strong>vierno, la circulación oceánica en la costadel golfo de <strong>Tehuantepec</strong> (GT; 16º N, 95º W) está controladapor una serie de eventos de viento del norte conocidos comonortes o tehuanos. Estos vientos se producen cuando existeuna diferencia de presión atmosférica entre el golfo deMéxico y el Pacífico tropical, lo que orig<strong>in</strong>a un flujo deviento a través del istmo de <strong>Tehuantepec</strong> que sale en forma deabanico sobre las aguas del GT (Steenburgh et al. 1998,Romero-Centeno et al. 2003). Los tehuanos son de tal <strong>in</strong>tensidadque generan remol<strong>in</strong>os de mesoescala y enfriamientoen el océano cerca de la costa (Barton et al. 1993, Trasviña etal. 1995). Wyrtki (1965) y Kessler (2002) <strong>in</strong>formaron que lacirculación de <strong>in</strong>vierno en el Pacífico oriental tropical estácaracterizada por una corriente geostrófica que viaja hacia elpolo a lo largo de la costa de América Central y México.Cuando se presenta un evento de viento, la circulacióncostera en el GT se modifica significativamente.443
Ciencias Mar<strong>in</strong>as, Vol. 37, No. 4A, 2011high chlorophyll a concentrations and low temperatures(Müller-Karger and Fuentes-Yaco 2000, McCla<strong>in</strong> et al. 2002,González-Silvera et al. 2004). The effects produced by aw<strong>in</strong>d event basically consist <strong>of</strong> an <strong>of</strong>fshore drag accompaniedby a decrease <strong>in</strong> sea level near <strong>the</strong> shore. A pair <strong>of</strong> eddies <strong>of</strong>opposite sign <strong>the</strong>n form on both sides <strong>of</strong> <strong>the</strong> w<strong>in</strong>d jet (Lavínet al. 1992). Satellite imagery and <strong>in</strong> situ measurements haverevealed important differences between <strong>the</strong> eddies generated(Barton et al. 1993, Trasviña et al. 1995, Müller-Karger andFuentes-Yaco 2000, González-Silvera et al. 2004). The anticycloniceddy that forms on <strong>the</strong> west side <strong>of</strong> <strong>the</strong> w<strong>in</strong>d jet isgenerally more <strong>in</strong>tense, smaller <strong>in</strong> diameter, and lasts longerthan <strong>the</strong> cyclonic eddy that forms on <strong>the</strong> east side and whichis not always visible. McCreary et al. (1989) expla<strong>in</strong> that thisasymmetry is due to an entra<strong>in</strong>ment <strong>of</strong> cold water on <strong>the</strong> side<strong>of</strong> <strong>the</strong> cyclonic eddy. Even though <strong>the</strong> results obta<strong>in</strong>ed byClarke (1988) show a symmetric response <strong>of</strong> <strong>the</strong> ocean, thisauthor suggests that <strong>the</strong> anticyclonic eddy is <strong>in</strong>tensified by<strong>the</strong> negative vorticity produced by <strong>the</strong> <strong>in</strong>ertial w<strong>in</strong>d path.Though differences have been detected <strong>in</strong> <strong>the</strong> dynamicresponse <strong>of</strong> surface currents to Tehuanos, to date <strong>the</strong>re are noreports that discuss <strong>the</strong> physical mechanisms caus<strong>in</strong>g <strong>the</strong>asymmetric response <strong>of</strong> <strong>the</strong> ocean on both sides <strong>of</strong> <strong>the</strong> w<strong>in</strong>djet. Our observations <strong>in</strong>dicate that <strong>the</strong> presence <strong>of</strong> a <strong>coastal</strong>current dur<strong>in</strong>g w<strong>in</strong>ter is one <strong>of</strong> <strong>the</strong> ma<strong>in</strong> causes <strong>of</strong> this asymmetry.The role played by <strong>the</strong> w<strong>in</strong>d stress component parallelto <strong>the</strong> coast and w<strong>in</strong>d stress divergence <strong>in</strong> <strong>the</strong> local dynamicsis also exam<strong>in</strong>ed.In this study we analyze <strong>the</strong> effect <strong>of</strong> w<strong>in</strong>d on sea surface<strong>circulation</strong> based on high-frequency radar measurements <strong>of</strong>surface currents taken <strong>of</strong>f <strong>the</strong> coast <strong>of</strong> Oaxaca betweenFebruary and April 2005. We exam<strong>in</strong>e <strong>the</strong> temporal evolution<strong>of</strong> surface velocity fields and analyze <strong>the</strong> effects caused bystrong local w<strong>in</strong>ds on <strong>the</strong> <strong>coastal</strong> dynamics. We first show <strong>the</strong>results <strong>of</strong> <strong>the</strong> ocean current observations toge<strong>the</strong>r with <strong>the</strong>w<strong>in</strong>d and sea surface temperature observations. We <strong>the</strong>nshow <strong>the</strong> spatial relationship between <strong>the</strong> w<strong>in</strong>d stress and surfacecurrent variables. F<strong>in</strong>ally, we show <strong>the</strong> comb<strong>in</strong>ed results,compar<strong>in</strong>g representative series <strong>of</strong> <strong>the</strong> w<strong>in</strong>d variables and <strong>the</strong>spatial density <strong>of</strong> k<strong>in</strong>etic energy and relative vorticity.MEASUREMENTS AND DATAFor this study we used <strong>the</strong> Cross-Calibrated, Multi-Platform (CCMP) Ocean Surface <strong>W<strong>in</strong>d</strong> Velocity Product(H<strong>of</strong>fman 1984, Atlas et al. 1996). This product provideszonal and meridional w<strong>in</strong>d component data at 6-h <strong>in</strong>tervals,with a spatial resolution <strong>of</strong> 25 km. We also used measurements<strong>of</strong> sea surface temperature from <strong>the</strong> GeostationaryOperational Environmental Satellite (GOES) product (JPLPhysical Oceanography Distributed Active Archive Center).This product provides daily images with a spatial resolution<strong>of</strong> ~5.5 km. To study <strong>the</strong> spatial and temporal variability <strong>of</strong><strong>coastal</strong> <strong>circulation</strong> <strong>in</strong> <strong>the</strong> GT, high-frequency radar (HFR)systems (16-element phased array) were <strong>in</strong>stalled at two sitesEn varios estudios se ha registrado la formación deremol<strong>in</strong>os de mesoescala, que se identifican en imágenessatelitales como zonas de alta concentración de clor<strong>of</strong>ila a ybaja temperatura (Müller-Karger y Fuentes-Yaco 2000,McCla<strong>in</strong> et al. 2002, González-Silvera et al. 2004). La explicaciónbásica de los efectos producidos por un evento deviento consiste en un arrastre hacia afuera de la costa, acompañadode una dism<strong>in</strong>ución en el nivel del mar junto a lacosta. Posteriormente, se forma un par de remol<strong>in</strong>os de signocontrario en ambos lados del chorro de viento (Lavín et al.1992). Las evidencias obtenidas de imágenes satelitales y demediciones <strong>in</strong> situ muestran diferencias importantes entre losremol<strong>in</strong>os generados (Barton et al. 1993, Trasviña et al.1995, Müller-Karger y Fuentes-Yaco 2000, González-Silveraet al. 2004). El remol<strong>in</strong>o anticiclónico que se forma al oestedel chorro de viento es generalmente más <strong>in</strong>tenso, de menordiámetro y más longevo que el remol<strong>in</strong>o ciclónico que seforma en la zona este y que no siempre es visible. McCrearyet al. (1989) explican que esta asimetría se debe al abordamientode agua fría en el lado del remol<strong>in</strong>o ciclónico. Aúncuando sus resultados muestran una respuesta simétrica delocéano, Clarke (1988) sugiere que la <strong>in</strong>tensificación delremol<strong>in</strong>o anticiclónico se debe a que la trayectoria <strong>in</strong>ercialdel viento <strong>in</strong>troduce vorticidad negativa.En resumen, se han reconocido las diferencias de la respuestad<strong>in</strong>ámica de la corriente superficial a los tehuanos; s<strong>in</strong>embargo, a la fecha no existen estudios que discutan losmecanismos físicos que causan la respuesta asimétrica delocéano a ambos lados del chorro de viento. Las observacionesque se reportan en el presente trabajo permiten suponer,como primer punto, que la presencia de una corriente costeradurante el <strong>in</strong>vierno es una de las pr<strong>in</strong>cipales causas de estaasimetría. Adicionalmente, se exam<strong>in</strong>a el papel que juegan lacomponente del esfuerzo del viento paralela a la costa y ladivergencia del esfuerzo del viento sobre la d<strong>in</strong>ámica local.En este trabajo se estudia el efecto del viento sobre lacirculación superficial del océano a partir de mediciones decorrientes superficiales con sistemas de radar de alta frecuenciaobtenidas en la costa de Oaxaca entre febrero y abril de2005. Se estudia la evolución temporal de los campos develocidad superficial y se analizan los efectos causados porlos vientos locales fuertes sobre la d<strong>in</strong>ámica costera. Como<strong>in</strong>icio, se muestran los resultados de las observaciones decorrientes en conjunto con observaciones de viento y temperaturasuperficial. Posteriormente, se muestra la relaciónespacial entre las variables del esfuerzo del viento y las variablesde la corriente superficial. F<strong>in</strong>almente, se muestran todosestos resultados de forma <strong>in</strong>tegral, mediante la comparaciónde series representativas de las variables del viento y ladensidad espacial de energía c<strong>in</strong>ética y de vorticidad relativa.MEDICIONES Y DATOSPara este trabajo se utilizaron las mediciones satelitalesde la velocidad del viento sobre la superficie del océano444
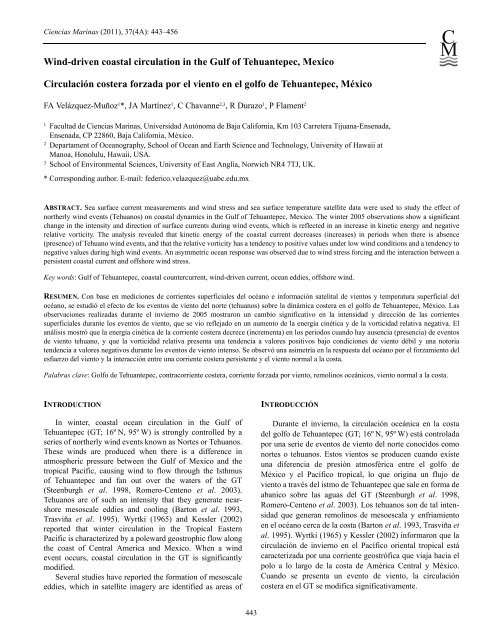
Velázquez-Muñoz et al.: <strong>W<strong>in</strong>d</strong>-<strong>driven</strong> <strong>coastal</strong> <strong>circulation</strong> <strong>in</strong> <strong>the</strong> <strong>Gulf</strong> <strong>of</strong> <strong>Tehuantepec</strong>(Santa María del Mar and Playa Cangrejo) on <strong>the</strong> nor<strong>the</strong>rnGT coast (Gurgel et al. 2000) and operated from February toApril 2005 at a frequency <strong>of</strong> 16.3 MHz. At this frequency,HFR systems typically provide a coverage <strong>of</strong> up to 120 km<strong>of</strong>fshore, depend<strong>in</strong>g on <strong>the</strong> environmental conditions. Thesystems were configured to obta<strong>in</strong> measurements every20 m<strong>in</strong>. The radial measurements from both sites were processedus<strong>in</strong>g <strong>the</strong> HFRadarmap Toolbox version 4.1 (Paduanand Cook 2004) to obta<strong>in</strong> <strong>the</strong> total velocity hourly fields <strong>in</strong> aCartesian rectangular grid <strong>of</strong> 5.5-km spatial resolution. Forthis analysis we used <strong>the</strong> first set <strong>of</strong> measurements obta<strong>in</strong>edfrom 9 February to 18 March 2005. <strong>W<strong>in</strong>d</strong> data were used tocalculate sea surface w<strong>in</strong>d stress accord<strong>in</strong>g to Large and Pond(1981) and <strong>the</strong>y were <strong>in</strong>terpolated <strong>in</strong>to <strong>the</strong> grid <strong>of</strong> <strong>the</strong>HFR observations.RESULTSThe mean w<strong>in</strong>d stress field (and standard deviation) for<strong>the</strong> period from February to March 2005 shows a welldef<strong>in</strong>edw<strong>in</strong>d jet normal to <strong>the</strong> coast <strong>of</strong> <strong>the</strong> GT (fig. 1a),extend<strong>in</strong>g ~400 km towards <strong>the</strong> southwest. Figure 1 alsoshows <strong>the</strong> change <strong>in</strong> w<strong>in</strong>d direction: close to shore, <strong>in</strong> <strong>the</strong>center <strong>of</strong> <strong>the</strong> w<strong>in</strong>d jet, <strong>the</strong> w<strong>in</strong>d is nor<strong>the</strong>rly, whereas <strong>of</strong>fshore(13–15º N), on <strong>the</strong> west side <strong>of</strong> <strong>the</strong> jet, it is nor<strong>the</strong>asterly.Maximum variability <strong>in</strong> <strong>the</strong> area covered by <strong>the</strong> w<strong>in</strong>d flowoccurs around coord<strong>in</strong>ates 15º N and 95º W, approximately120 km <strong>of</strong>fshore. The time series <strong>of</strong> <strong>the</strong> w<strong>in</strong>d components at<strong>the</strong> po<strong>in</strong>t <strong>of</strong> maximum variability is shown <strong>in</strong> figure 1b, andfour w<strong>in</strong>d events can be identified dur<strong>in</strong>g <strong>the</strong> sampl<strong>in</strong>gperiod. The first event occurred from 9 to 11 February andreached 16 m s –1 (~0.5 N m –2 ). A second less <strong>in</strong>tense event,with maximum w<strong>in</strong>d velocity <strong>of</strong> 14 m s –1 (~0.3 N m –2 ),occurred from 17 to 19 February, and it was followed by aperiod <strong>of</strong> relative calm from 22 February to 8 March. Themost <strong>in</strong>tense w<strong>in</strong>d event <strong>of</strong> <strong>the</strong> sampl<strong>in</strong>g period reacheda maximum <strong>of</strong> 18 m s –1 (~0.7 N m –2 ) and occurred from 9to 11 March, prior to a short, less <strong>in</strong>tense w<strong>in</strong>d event(~0.30 N m –2 ).The area covered by each <strong>of</strong> <strong>the</strong> HFR systems <strong>in</strong>stalledat Santa María del Mar and Playa Cangrejo is shown <strong>in</strong>figure 2a. The variation <strong>in</strong> <strong>the</strong> shades <strong>of</strong> grey <strong>in</strong>dicates <strong>the</strong>temporal coverage (%) <strong>of</strong> <strong>the</strong> data obta<strong>in</strong>ed with both HFRdur<strong>in</strong>g <strong>the</strong> sampl<strong>in</strong>g period. In <strong>the</strong> part far<strong>the</strong>st from eachsite, this percentage decreases as a consequence <strong>of</strong> <strong>the</strong> dailyvariation <strong>in</strong> <strong>the</strong> range <strong>the</strong> emitted signal reached. In this analysiswe considered only <strong>the</strong> grid nodes with more than 60%coverage. Surface current variance (shades <strong>of</strong> grey) and itsmean field (vectors) are shown <strong>in</strong> figure 2b. Variability islowest close to <strong>the</strong> coast, towards <strong>the</strong> east, and <strong>in</strong>creases <strong>of</strong>fshore,towards <strong>the</strong> southwest, and is maximum near 95.15º Wand 15.50º N, where w<strong>in</strong>d variability is maximum (seefig. 1a). It is important to note that <strong>the</strong> lowest values are associatedwith a mean current that enters <strong>the</strong> GT on <strong>the</strong> easternside, while <strong>the</strong> highest values co<strong>in</strong>cide with <strong>the</strong> area wheredel producto Cross-Calibrated, Multi-Platform (CCMP)(H<strong>of</strong>fman 1984, Atlas et al. 1996). Este producto proporcionadatos de las componentes (zonal y meridional) del viento a<strong>in</strong>tervalos de 6 h, en un arreglo con resolución espacial de25 km. También se utilizaron mediciones de la temperaturasuperficial del océano del producto de Satélite GeoestacionarioOperacional Ambiental (GOES, por sus siglas en <strong>in</strong>glés;JPL Physical Oceanography Distributed Active ArchiveCenter), que proporciona imágenes diarias con una resoluciónespacial de ~5.5 km. Con el objetivo de estudiar la variabilidadespacial y temporal de la circulación costera en el GT,se <strong>in</strong>stalaron sistemas de radar de alta frecuencia (RAF) (enun arreglo de fase de 16 canales) en dos sitios (Santa Maríadel Mar y Playa Cangrejo) en la costa norte del golfo (Gurgelet al. 2000), y se operaron entre febrero y abril de 2005 a unafrecuencia de 16.3 MHz. A esta frecuencia de operación, lossistemas RAF alcanzan una cobertura típica de hasta 120 kmmar adentro, dependiendo de las condiciones ambientales.Los sistemas se configuraron para obtener mediciones cada20 m<strong>in</strong>. Las mediciones radiales de ambos sitios fueron procesadasmediante las rut<strong>in</strong>as HFRadarmap Toolbox (versión4.1) de Paduan y Cook (2004) para obtener los campos horariosde velocidad total en una malla rectangular cartesiana de5.5 km de resolución espacial. Para este trabajo se utilizó elprimer conjunto de mediciones comprendido del 9 de febreroal 18 de marzo de 2005. Los datos de viento se utilizaron paracalcular el esfuerzo del viento sobre la superficie del océanode acuerdo con Large y Pond (1981) y se <strong>in</strong>terpolaron a lamalla de las observaciones de los sistemas RAF.RESULTADOSEl campo promedio y la desviación estándar del esfuerzodel viento, para el periodo de febrero a marzo de 2005, muestranun chorro de viento bien def<strong>in</strong>ido normal a la costa delGT (fig. 1a), que se extiende ~400 km hacia el suroeste. En lafigura 1a, también es evidente el cambio en la dirección delviento: cerca de la costa, en el centro del chorro, el viento esdel norte, mientras que mar adentro (13–15º N), en el ladooccidental del chorro, cambia a un viento del noreste. Lamáxima variabilidad en la zona donde se extiende el flujo deviento se localiza alrededor de las coordenadas 15º N, 95º W,aproximadamente a 120 km de la costa. En la figura 1b, sepuede observar la serie de tiempo de las componentes delviento en el punto de máxima variabilidad, y se identificancuatro eventos de viento durante el periodo de observaciones.El primer evento transcurrió del 9 al 11 de febrero y alcanzólos 16 m s –1 (~0.5 N m –2 ). Un segundo evento de menor <strong>in</strong>tensidad,con un máximo en la velocidad del viento de 14 m s -1(~0.3 N m –2 ), se presentó del 17 al 19 de febrero, seguido deun periodo de calma relativa entre el 22 de febrero y el 8 demarzo. El evento más <strong>in</strong>tenso en el periodo de observacionesalcanzó un máximo de 18 m s –1 (~0.7 N m –2 ) y se presentódel 9 al 11 de marzo, previo a un evento de viento de cortaduración y menor <strong>in</strong>tensidad (~0.30 N m –2 ).445
Ciencias Mar<strong>in</strong>as, Vol. 37, No. 4A, 2011<strong>the</strong> mean current moves southwestwards; this is related tochanges <strong>in</strong> direction as a result <strong>of</strong> <strong>the</strong> direct <strong>in</strong>fluence <strong>of</strong> <strong>the</strong>w<strong>in</strong>d.To illustrate <strong>the</strong> changes <strong>in</strong> sea surface <strong>circulation</strong> producedby nor<strong>the</strong>rly w<strong>in</strong>d events, as an example, <strong>in</strong> figure 3we compare <strong>the</strong> daily means <strong>of</strong> <strong>the</strong> surface current and seasurface temperature fields obta<strong>in</strong>ed for weak w<strong>in</strong>d or nonexistentw<strong>in</strong>d conditions and dur<strong>in</strong>g a Tehuano event. Themean current fields for 16 and 17 February (fig. 3a, b) correspondto a period <strong>of</strong> relatively calm w<strong>in</strong>d between <strong>the</strong> firsttwo events, while those for 19 and 20 February (fig. 3c, d)correspond to a Tehuano event. The white arrows <strong>in</strong>dicatemean w<strong>in</strong>d direction and <strong>in</strong>tensity taken from <strong>the</strong> CCMPproduct for those days. Dur<strong>in</strong>g <strong>the</strong> calm period (fig. 3a, b),which can be considered a period <strong>of</strong> relaxation or adjustmentafter <strong>the</strong> w<strong>in</strong>d event, a warm current can be observed flow<strong>in</strong>g171615141312( , ) (Nm )_ 21110-100 -98 -96 -94 -92 -90yx0.20-0.2-0.4-0.6-0.8-1200508/02 15/02 22/02 01/03 08/03 15/03Time (days/month)0.160.120.080.040.00<strong>W<strong>in</strong>d</strong> stress root mean square (Nm _ 2 )Figure 1. (a) Mean w<strong>in</strong>d stress calculated for <strong>the</strong> period from 1February to 31 March 2005. Mean square error <strong>of</strong> w<strong>in</strong>d stress isrepresented by shades <strong>of</strong> grey. (b) Time series <strong>of</strong> <strong>the</strong> zonalcomponent ( x , th<strong>in</strong> l<strong>in</strong>e) and meridional component ( y , thick l<strong>in</strong>e)<strong>of</strong> w<strong>in</strong>d stress at <strong>the</strong> maximum po<strong>in</strong>t <strong>of</strong> variability located at 15º Nand 95º W. The sampl<strong>in</strong>g period (9 February to 18 March 2005) isdelimited by dashed l<strong>in</strong>es. The grey-toned bars <strong>in</strong>dicate <strong>the</strong>periods when Tehuano events occurred.Figura 1. (a) Esfuerzo del viento promedio calculado para elperiodo del 1 de febrero al 31 de marzo de 2005. En tonos de grisse representa el error cuadrático medio del esfuerzo del viento.(b) Serie de tiempo de las componentes zonal ( x , línea delgada) ymeridional ( y , línea gruesa) del esfuerzo del viento en el punto demáxima variabilidad, localizado en 15º N, 95º W. El periodo demediciones está delimitado entre líneas punteadas. Las barras decolor gris muestran los periodos de eventos tehuanos.El área de cobertura de cada uno de los sistemas RAF<strong>in</strong>stalados en Santa María del Mar y Playa Cangrejo se muestraen la figura 2a. La variación en la tonalidad de gris muestrala cobertura temporal (%) de datos obtenidos con ambosRAF durante el periodo de mediciones. En la parte lejana acada uno de los sitios de los RAF, este porcentaje dism<strong>in</strong>uyócomo consecuencia de la variación diaria en el alcance de laseñal emitida. Para este trabajo se consideraron sólo losnodos de malla que contenían más del 60% de cobertura temporal.En la figura 2b se muestra la varianza (escala de grises)de la corriente superficial y su campo promedio (vectores).La menor variabilidad está cerca de la costa, hacia el este, yaumenta hacia afuera de la costa, en dirección suroeste, conun valor máximo cerca de 95.15º W y 15.50º N, donde lavarianza del viento es máxima (ver fig. 1a). Es importanteresaltar que los valores menores de la varianza están asociadosa una corriente media que entra al GT por el este, mientrasque los valores mayores co<strong>in</strong>ciden con la zona dondela corriente media fluye hacia el suroeste; lo anterior estárelacionado con cambios en la dirección por la <strong>in</strong>fluenciadirecta del viento.Para ilustrar los cambios en la circulación superficial producidapor los vientos del norte, como un ejemplo, en lafigura 3 se contrastan los promedios diarios de los campos decorriente superficial y de temperatura superficial del marobtenidos para condiciones de viento débil o casi <strong>in</strong>existentey durante un evento de viento tehuano. Los campos decorriente promedio para el 16 y 17 de febrero (fig. 3a, b)corresponden al periodo entre los primeros dos eventoscuando el viento está en relativa calma, mientras que aquellospara el 19 y 20 de febrero (fig. 3c, d) corresponden a unevento de viento tehuano. En este caso, las flechas blancas<strong>in</strong>dican la dirección e <strong>in</strong>tensidad promedio del viento tomadasdel producto CCMP para esos días. En el periodo decalma (fig. 3a, b), que se puede considerar como un periodode relajación o de ajuste posterior al evento de viento, sepuede observar una corriente cálida que fluye a lo largo de lacosta, del este hacia el oeste de la zona de cobertura; esteflujo de corriente cálida también se puede considerar como elflujo medio que existiría en ausencia de tehuanos, con unavelocidad media de la corriente de ~0.4 m s –1 y una temperatura2 ºC más alta que el agua que la rodea. Aunque no semuestran todas las figuras de la secuencia de mediciones, esimportante señalar que en ausencia de vientos fuertes, seobserva que el flujo cálido que entra al GT por el este espersistente. El 18 de febrero comenzó un evento de vientocon duración de 48 h. Durante el 19 y 20 de febrero (fig. 3c,d) se puede observar que, en la parte oriental del área decobertura (hacia el este del eje del chorro de viento), lacorriente costera se dirige hacia el suroeste. En el lado occidental,la corriente cerca de la costa <strong>in</strong>vierte su dirección yconverge con la corriente costera del este, y forman un flujoque sigue la dirección del chorro del viento mar adentro.La posición del chorro se evidencia por la zona de menor446
Velázquez-Muñoz et al.: <strong>W<strong>in</strong>d</strong>-<strong>driven</strong> <strong>coastal</strong> <strong>circulation</strong> <strong>in</strong> <strong>the</strong> <strong>Gulf</strong> <strong>of</strong> <strong>Tehuantepec</strong>16.59016.50.6Latitude (°N)1615.5756045HFR temporal coverage (%)Latitude (°N)1615.50.50.40.30.20.115-95.5 -95 -94.5 -94Longitude (°W)3015-95.5 -95 -94.5 -94Longitude (°W)0Figure 2. (a) Percentage <strong>of</strong> data obta<strong>in</strong>ed dur<strong>in</strong>g <strong>the</strong> sampl<strong>in</strong>g period us<strong>in</strong>g two high-frequency radar (HFR) systems <strong>in</strong>stalled at Santa Maríadel Mar (STM) and Playa Cangrejo (CAN). The spatial grid resolution is 5.5 km. (b) Mean field <strong>of</strong> sea surface current (SSC) dur<strong>in</strong>g <strong>the</strong>sampl<strong>in</strong>g period <strong>in</strong> <strong>the</strong> area where coverage was at least 60%. Mean square error <strong>of</strong> surface current velocity is represented by shades <strong>of</strong> grey.The regions <strong>in</strong>dicated by black l<strong>in</strong>es correspond to <strong>the</strong> spatial coverage area <strong>of</strong> each HFR system.Figura 2. (a) Porcentaje de datos obtenidos durante el periodo de mediciones con los sistemas de radar de alta frecuencia (HFR) <strong>in</strong>stalados enSanta María del Mar (STM) y Playa Cangrejo (CAN). La resolución espacial de la malla es de 5.5 km. (b) Campo medio de la corrientesuperficial del mar (SSC) durante el periodo de mediciones en la región donde la cobertura fue al menos del 60%. En tonos de gris serepresenta el error cuadrático medio de la velocidad de la corriente superficial. Las regiones de semi-arco que se <strong>in</strong>dican con líneas negrascorresponden a la zona de cobertura espacial de cada uno de los sistemas de HFR.along <strong>the</strong> coast from <strong>the</strong> east to <strong>the</strong> west <strong>of</strong> <strong>the</strong> HFR coveragearea, which can also be considered a mean flow that wouldexist <strong>in</strong> <strong>the</strong> absence <strong>of</strong> Tehuanos, with mean current speed <strong>of</strong>~0.4 m s –1 and a temperature 2 ºC higher than that <strong>of</strong> <strong>the</strong> surround<strong>in</strong>gwater. Though we do not show all <strong>the</strong> images <strong>of</strong> <strong>the</strong>sequence <strong>of</strong> measurements, it is important to note that <strong>in</strong> <strong>the</strong>absence <strong>of</strong> strong w<strong>in</strong>ds, <strong>the</strong> warm flow enter<strong>in</strong>g <strong>the</strong> GT on<strong>the</strong> eastern side is persistent. On 18 February, a w<strong>in</strong>d eventbegan and lasted 48 h. On 19 and 20 February (fig. 3c, d), <strong>the</strong><strong>coastal</strong> current flows southwestwards on <strong>the</strong> eastern side <strong>of</strong><strong>the</strong> coverage area (to <strong>the</strong> east <strong>of</strong> <strong>the</strong> w<strong>in</strong>d jet axis). On <strong>the</strong>western side, <strong>the</strong> nearshore current reverses direction andconverges with <strong>the</strong> <strong>coastal</strong> current from <strong>the</strong> east, form<strong>in</strong>g aflow that moves <strong>in</strong> <strong>the</strong> direction <strong>of</strong> <strong>the</strong> <strong>of</strong>fshore w<strong>in</strong>d jet. Thejet’s position is evidenced by <strong>the</strong> area <strong>of</strong> lower temperaturethat extends <strong>of</strong>fshore. After two days <strong>of</strong> <strong>in</strong>tense w<strong>in</strong>d, evidence<strong>of</strong> an anticyclonic structure can be observed on <strong>the</strong> leftside <strong>of</strong> <strong>the</strong> coverage area (fig. 3d). In <strong>the</strong> <strong>in</strong>stantaneous surfacecurrent map sequence for <strong>the</strong> days after 20 February (notshown), it is possible to observe that this structure movessouthwards and <strong>in</strong>creases <strong>in</strong> size, while a current aga<strong>in</strong> flowsfrom <strong>the</strong> east to <strong>the</strong> west <strong>of</strong> <strong>the</strong> GT. A very similar pattern canbe observed <strong>in</strong> <strong>the</strong> sequence <strong>of</strong> images obta<strong>in</strong>ed after <strong>the</strong>events <strong>of</strong> 10–12 February and 8–11 March (not shown). It isimportant to note, however, that <strong>the</strong> <strong>in</strong>itial conditions werenot similar <strong>in</strong> <strong>the</strong> images obta<strong>in</strong>ed prior to <strong>the</strong>se events. We<strong>the</strong>refore suggest that <strong>the</strong> effect produced by a w<strong>in</strong>d event isso significant that it modifies <strong>the</strong> surface <strong>circulation</strong> <strong>in</strong> asimilar way regardless <strong>of</strong> <strong>the</strong> <strong>in</strong>itial condition <strong>of</strong> <strong>the</strong> currentfield. The scant variability observed near <strong>the</strong> eastern coast(fig. 2b) suggests that w<strong>in</strong>d has less <strong>of</strong> an effect on <strong>the</strong> <strong>coastal</strong>current on <strong>the</strong> eastern side, whereas <strong>the</strong> area <strong>of</strong> hightemperatura que se extiende hacia afuera de la costa. Despuésde dos días de viento <strong>in</strong>tenso, se observa la evidencia de unaestructura anticiclónica en el lado izquierdo de la zona decobertura (fig. 3d). En la secuencia <strong>in</strong>stantánea de mapas decorriente, para los días después del 20 de febrero (nomostrada), es posible observar que esta estructura se muevehacia el sur y aumenta de tamaño, mientras que una corrientedel este fluye nuevamente hacia el oeste a través del GT. Sepuede observar un patrón muy similar al descrito anteriormenteen la secuencia de imágenes obtenidas después de loseventos del 10 al 12 de febrero y del 8 al 11 de marzo (nomostrada). S<strong>in</strong> embargo, es importante mencionar que no seobserva una condición <strong>in</strong>icial similar en las imágenes previasa los eventos señalados. Esto permite proponer que el efectoque produce un evento de viento es tan significativo quemodifica de forma muy similar la circulación superficial s<strong>in</strong>importar la condición <strong>in</strong>icial del campo de corrientes. La bajavariabilidad observada cerca de la costa oriental (fig. 2b)sugiere que la corriente costera se ve menos afectada por elviento en el lado este, mientras que la zona de alta variabilidaden la costa occidental está relacionada con los cambiosde magnitud y dirección en la corriente y la formación deremol<strong>in</strong>os anticiclónicos durante algunos eventos tehuanos.D<strong>in</strong>ámicaPara evaluar el efecto del esfuerzo del viento sobre lad<strong>in</strong>ámica de la circulación costera en el GT, se calcularon,mediante diferencias f<strong>in</strong>itas e <strong>in</strong>terpolación, el rotacional y ladivergencia del esfuerzo del viento para cada punto de lamalla donde se tenían las mediciones de los sistemas RAF.Asimismo, con las velocidades de la corriente superficial, se447
Ciencias Mar<strong>in</strong>as, Vol. 37, No. 4A, 2011variability on <strong>the</strong> western coast is related to <strong>the</strong> changes <strong>in</strong>magnitude and direction <strong>of</strong> <strong>the</strong> current and to <strong>the</strong> formation<strong>of</strong> anticyclonic eddies dur<strong>in</strong>g some Tehuano events.DynamicsTo assess <strong>the</strong> effect <strong>of</strong> w<strong>in</strong>d stress on <strong>coastal</strong> <strong>circulation</strong><strong>in</strong> <strong>the</strong> GT, f<strong>in</strong>ite differences and <strong>in</strong>terpolation methods werecalcularon la energía c<strong>in</strong>ética (E k ) y la vorticidad relativa (en los nodos de la malla del área de cobertura de los sistemasRAF. Para cada nodo de la malla en la figura 2a, se calculó elcoeficiente de correlación entre las series de tiempo de lacomponente zonal ( x ), la componente meridional ( y ), elrotacional ( × ) y la divergencia () del esfuerzo delviento y las series de tiempo de E k (fig. 4a–d) y de (fig. 4e–h).Latitude (°N)1615.515Latitude (°N)1615.515-95.5 -95 -94.5 -94Longitude (°W)-95.5 -95 -94.5 -94Longitude (°W)26 27 28 29 30 31 32SST (°C)Figure 3. Daily averages <strong>of</strong> surface current superposed on GOES sea surface temperature (SST) imagery after a nor<strong>the</strong>rly w<strong>in</strong>d event on(a) 16 February 2005 and (b) 17 February 2005. Surface current fields and SST for (c) 19 February 2005 and (d) 20 February 2005, when aTehuano event occurred. White arrows <strong>in</strong>dicate <strong>the</strong> w<strong>in</strong>d field (STM = Santa María del Mar; CAN = Playa Cangrejo).Figura 3. Promedios diarios de la corriente superficial sobrepuesta en imágenes de temperatura superficial del mar (SST, por sus siglas en<strong>in</strong>glés) del producto GOES después de un evento de viento del norte (a) el 16 de febrero de 2005 y (b) el 17 de febrero de 2005. Campos decorrientes superficiales y SST para el (c) 19 de febrero de 2005 y (d) 20 de febrero de 2005, cuando se observó un evento de viento tehuano.Las flechas blancas muestran el campo de viento (STM = Santa María del Mar; CAN = Playa Cangrejo).448
Velázquez-Muñoz et al.: <strong>W<strong>in</strong>d</strong>-<strong>driven</strong> <strong>coastal</strong> <strong>circulation</strong> <strong>in</strong> <strong>the</strong> <strong>Gulf</strong> <strong>of</strong> <strong>Tehuantepec</strong>used to calculate <strong>the</strong> w<strong>in</strong>d stress curl and divergence for eachgrid po<strong>in</strong>t for which <strong>the</strong>re were HFR measurements. Moreover,us<strong>in</strong>g surface current velocities, we calculated k<strong>in</strong>eticenergy (E k ) and relative vorticity ( for <strong>the</strong> grid nodes <strong>of</strong> <strong>the</strong>area covered by <strong>the</strong> HFR systems. For each grid node <strong>in</strong>figure 2a we calculated <strong>the</strong> correlation coefficient between<strong>the</strong> time series <strong>of</strong> <strong>the</strong> w<strong>in</strong>d stress zonal component ( x ),meridional component ( y ), curl ( × ), and divergence(), and <strong>the</strong> time series <strong>of</strong> E k (fig. 4a–d) and (fig. 4e–h).The highest correlation values were obta<strong>in</strong>ed with E k(fig. 4a–d). Zonal w<strong>in</strong>d stress showed greater (negative) correlationwith E k to <strong>the</strong> west <strong>of</strong> 94.7º W (fig. 4a), that is, where x is negative, and as E k is positive, <strong>the</strong> westward x favors <strong>the</strong>currents. The mean w<strong>in</strong>d stress field shown <strong>in</strong> figure 1a helpsto understand this relationship, s<strong>in</strong>ce x changes sign around94.5º W and does not co<strong>in</strong>cide with <strong>the</strong> w<strong>in</strong>d jet axis or <strong>the</strong>axis <strong>of</strong> maximum variability (~95ºW). In contrast, <strong>the</strong> spatialdistribution <strong>of</strong> <strong>the</strong> correlation between y and E k (fig. 4b) ismore uniform and negative, and suggests an <strong>in</strong>crease <strong>in</strong> E kthroughout <strong>the</strong> doma<strong>in</strong> because y is dom<strong>in</strong>antly negative.Consider<strong>in</strong>g that E k is def<strong>in</strong>ed as positive, <strong>the</strong> correlationsshown <strong>in</strong> figure 4(a, b) <strong>in</strong>dicate that <strong>in</strong>creases <strong>in</strong> E k are associatedwith <strong>in</strong>creases <strong>in</strong> <strong>the</strong> <strong>in</strong>tensity <strong>of</strong> <strong>the</strong> negative w<strong>in</strong>dstress components.The w<strong>in</strong>d stress curl <strong>in</strong> <strong>the</strong> GT is <strong>the</strong> most <strong>in</strong>tense <strong>of</strong>Mexican seas (Chelton et al. 2001). Dur<strong>in</strong>g Tehuano events,<strong>the</strong> curl is <strong>in</strong>tense and asymmetric on both sides <strong>of</strong> <strong>the</strong> w<strong>in</strong>djet axis. Consequently, <strong>the</strong> spatial correlation with E k (fig. 4c)is positive to <strong>the</strong> east <strong>of</strong> <strong>the</strong> w<strong>in</strong>d jet axis (where <strong>the</strong> curl ispositive) and negative to <strong>the</strong> west (where <strong>the</strong> curl is negative),<strong>in</strong>dicat<strong>in</strong>g that × favors <strong>the</strong> production <strong>of</strong> E k on bothsides <strong>of</strong> <strong>the</strong> w<strong>in</strong>d jet axis. The spatial distribution <strong>of</strong> <strong>the</strong>correlation between and E k is more homogeneous andpositive with<strong>in</strong> <strong>the</strong> area covered by <strong>the</strong> HFR systems (fig.4d). This suggests that E k and are coherent. This f<strong>in</strong>d<strong>in</strong>g<strong>in</strong>dicates <strong>the</strong> importance <strong>of</strong> <strong>the</strong> effect produced by onoceanic <strong>circulation</strong> <strong>in</strong> <strong>the</strong> GT, which can be as significant asthat <strong>of</strong> y and × .The spatial correlations between <strong>the</strong> w<strong>in</strong>d stress variablesand (fig. 4e–h) are <strong>of</strong> lesser magnitude than those correspond<strong>in</strong>gto E k . None<strong>the</strong>less, it is important to <strong>in</strong>dicate that<strong>the</strong> highest values occurred <strong>in</strong> <strong>the</strong> area where an anticyclonicstructure was identified (i.e., <strong>the</strong> west side <strong>of</strong> <strong>the</strong> coveragearea). Of particular relevance are <strong>the</strong> correlations between yand (fig. 4f) and between and (fig. 4h). This suggeststhat <strong>the</strong> most important effect produced by w<strong>in</strong>d stress on is <strong>the</strong> formation <strong>of</strong> an anticyclonic structure because, with<strong>in</strong><strong>the</strong> extent <strong>of</strong> <strong>the</strong> coverage area, <strong>the</strong>re is no evidence <strong>of</strong> <strong>the</strong>generation <strong>of</strong> <strong>the</strong> cyclonic counterpart on <strong>the</strong> east side <strong>in</strong> <strong>the</strong>event <strong>of</strong> surface <strong>circulation</strong> hav<strong>in</strong>g a symmetric w<strong>in</strong>d-eventresponse. Contrary to <strong>the</strong> prior f<strong>in</strong>d<strong>in</strong>gs, <strong>the</strong> negative values<strong>of</strong> <strong>the</strong> correlation between x and ω (fig. 4e) and between × and ω (fig. 4g) on <strong>the</strong> east side are larger <strong>in</strong> magnitudethan <strong>the</strong> positive values on <strong>the</strong> west side. These resultsLos valores de correlación más altos se obtuvieron con E k(fig. 4a–d). El esfuerzo del viento en la dirección zonalpresentó una correlación (negativa) mayor con E k al oeste de94.7ºW (fig. 4a), es decir, donde x es negativa, y al ser E kpositiva, x en dirección al oeste favorece a las corrientes. Elcampo promedio del esfuerzo del viento (figura 1a) ayuda aentender esta relación, ya que x cambia de signo alrededor de94.5ºW y no co<strong>in</strong>cide con el eje del chorro de viento o demáxima variabilidad (~95ºW). En contraste, la distribuciónespacial de la correlación entre y y E k (fig. 4b) es másuniforme y negativa, y sugiere un aumento de E k en todo eldom<strong>in</strong>io dado que y es dom<strong>in</strong>antemente negativa. Considerandoque E k es def<strong>in</strong>ida positiva, las correlaciones mostradasen la figura 4(a, b) <strong>in</strong>dican que los aumentos de E k estánasociados con aumentos en la <strong>in</strong>tensidad de las componentesdel esfuerzo del viento en dirección negativa.El rotacional del esfuerzo del viento en el GT es el más<strong>in</strong>tenso en los mares mexicanos (Chelton et al. 2001).Durante los eventos tehuanos, el rotacional es <strong>in</strong>tenso yantisimétrico a ambos lados del eje del chorro viento. Consecuentemente,la correlación espacial con E k (fig. 4c) espositiva al este del eje del chorro de viento (donde el rotacionales positivo) y negativa al oeste (donde el rotacional esnegativo), lo que revela que × favorece la producciónde E k en ambos lados del eje del chorro de viento. Ladistribución espacial de la correlación entre y E k es muyhomogénea y positiva dentro del área de cobertura de lossistemas RAF (fig. 4d). Esto implica que E k y soncoherentes. Este resultado establece la importancia del efectoque produce sobre la circulación oceánica en el GT, quepuede ser tan significativa como la de y y la de × .Las correlaciones espaciales entre las variables delesfuerzo del viento y la (fig. 4e–h) son de menor magnitudque las correspondientes con E k . No obstante, es importanteseñalar que los valores de mayor correlación se ubican en lazona donde se ha identificado la generación de una estructuraanticiclónica (i.e., en el lado oeste de la zona de cobertura delos sistemas RAF). En particular destacan las correlacionesentre y y (fig. 4f), y entre y (fig. 4h). Esto sugiereque el efecto más importante producido por el esfuerzodel viento sobre es la formación de una estructura anticiclónica,ya que, hasta donde alcanzan las mediciones decorriente superficial, no existen evidencias de la generaciónde la contraparte ciclónica en el lado este en el supuesto casode que la respuesta de la circulación superficial ante eventosde viento fuese simétrica. En contraste con los resultadosanteriores, se puede observar que los valores negativos de lacorrelación entre x y ω (fig. 4e), y entre × y ω (fig. 4g)en la parte oriental son más grandes en magnitud que losvalores positivos en la parte occidental. Estos resultadospermiten suponer que hay un efecto más significativo de y y durante el periodo <strong>in</strong>icial de los eventos de viento, debidoa que la dirección del viento es prácticamente hacia el sur,con una componente mínima en dirección paralela a la costa.449
Ciencias Mar<strong>in</strong>as, Vol. 37, No. 4A, 201116.516Latitude (°N)15.51516.516Latitude (°N)15.51516.516Latitude (°N)15.51516.516Latitude (°N)15.515-95.5 -95 -94.5 -94Longitude (°W)r-95.5 -95 -94.5 -94Longitude (°W)-0.6 -0.4 -0.2 0 0.2 0.4 0.6Figure 4. Two-dimensional correlation maps between <strong>the</strong> (a) zonal component ( x ), (b) meridional component ( y ), (c) curl ( × ), and(d) divergence () <strong>of</strong> w<strong>in</strong>d stress and k<strong>in</strong>etic energy (E k ), and between (e) x , (f) y , (g) × , and (h) and relative vorticity () (STM =Santa María del Mar; CAN = Playa Cangrejo).Figura 4. Mapas de correlación bidimensional entre (a) la componente zonal ( x ), (b) la componente meridional ( y ), (c) el rotacional ( × )y (d) la divergencia () del esfuerzo del viento y la energía c<strong>in</strong>ética (E k ), y entre (e) x , (f) y , (g) × y (h) y la vorticidad relativa ()(STM = Santa María del Mar; CAN = Playa Cangrejo).450
Velázquez-Muñoz et al.: <strong>W<strong>in</strong>d</strong>-<strong>driven</strong> <strong>coastal</strong> <strong>circulation</strong> <strong>in</strong> <strong>the</strong> <strong>Gulf</strong> <strong>of</strong> <strong>Tehuantepec</strong><strong>in</strong>dicate a more significant effect <strong>of</strong> y and dur<strong>in</strong>g <strong>the</strong><strong>in</strong>itial period <strong>of</strong> <strong>the</strong> w<strong>in</strong>d events, s<strong>in</strong>ce w<strong>in</strong>d direction ismostly southwards, with a m<strong>in</strong>imum component parallel to<strong>the</strong> coast. As <strong>the</strong> w<strong>in</strong>d events develop and <strong>in</strong>tensify, w<strong>in</strong>ddirection changes to SSW due to <strong>the</strong> Coriolis effect, <strong>in</strong>creas<strong>in</strong>g<strong>the</strong> values <strong>of</strong> x and negative × on <strong>the</strong> west side. Thisresults <strong>in</strong> a greater <strong>in</strong>fluence <strong>of</strong> w<strong>in</strong>d on sea surface currentson <strong>the</strong> west side, where an anticyclonic structure is generatedand subsequently moves southwesterwards.DISCUSSIONTo determ<strong>in</strong>e <strong>the</strong> overall effect <strong>of</strong> w<strong>in</strong>ds on sea surfacecurrents, figure 5 shows <strong>the</strong> temporal variation <strong>of</strong> w<strong>in</strong>d stresscurl (fig. 5a) and divergence (fig. 5b) at <strong>the</strong> po<strong>in</strong>t <strong>of</strong> maximumvariability <strong>of</strong> w<strong>in</strong>d stress (see fig. 1a), and <strong>the</strong> temporalvariation <strong>of</strong> <strong>the</strong> spatial density <strong>of</strong> k<strong>in</strong>etic energy (E k *, fig. 5c)and relative vorticity (*, fig. 5d):A medida que los eventos de viento se desarrollan e<strong>in</strong>tensifican, la dirección del viento cambia hacia el SSOdebido al efecto de la fuerza de Coriolis, y se <strong>in</strong>crementan losvalores de x y de × negativo hacia el lado oeste. Loanterior resulta en una mayor <strong>in</strong>fluencia del viento sobre lascorrientes superficiales del océano en el lado oeste, donde segenera una estructura anticiclónica que posteriormente sedesplaza con dirección suroeste.DISCUSIÓNCon el objetivo de encontrar de forma <strong>in</strong>tegral el efectodel viento sobre la corriente superficial, la figura 5 muestra lavariación temporal del rotacional (fig. 5a) y la divergencia(fig. 5b) del esfuerzo del viento en el punto de máxima variabilidaddel esfuerzo del viento (ver fig. 1a), y la variacióntemporal de la densidad espacial de energía c<strong>in</strong>ética (E k *,fig. 5c) y de vorticidad relativa (*, fig. 5d):E k *=1A-- E d A k A(1)E k *=1A-- E d A k A(1)*=1A-- d AA(2)1* =A-- d AA(2)where A is <strong>the</strong> HFR coverage area. The w<strong>in</strong>d stress curl timeseries shows negative values dur<strong>in</strong>g <strong>the</strong> Tehuano events,whereas <strong>the</strong> divergence time series shows more frequentoscillations with sign changes (fig. 5a, b). Figure 5(c, d)clearly shows that w<strong>in</strong>d events produce <strong>in</strong>creases <strong>in</strong> E k *and negative *. All <strong>the</strong> time series <strong>of</strong> <strong>the</strong> zonal ( x ) andmeridional ( y ) w<strong>in</strong>d stress components (fig. 1b), as well ascurl ( × ) and divergence () (fig. 5a, b) correlated with<strong>the</strong> E k * and * time series for (a) <strong>the</strong> entire sampl<strong>in</strong>g period,(b) <strong>the</strong> periods <strong>of</strong> <strong>in</strong>tense nor<strong>the</strong>rly w<strong>in</strong>ds, and (c) <strong>the</strong> periods<strong>of</strong> calm. The results <strong>of</strong> <strong>the</strong> correlation analysis are shown <strong>in</strong>table 1. The correlations <strong>in</strong>clud<strong>in</strong>g all data and only <strong>the</strong>Tehuano data are slightly lower, except for <strong>the</strong> correlationbetween x and *, which stops be<strong>in</strong>g significant dur<strong>in</strong>gTehuano events. Tak<strong>in</strong>g this <strong>in</strong>to account, we provide <strong>the</strong>follow<strong>in</strong>g <strong>in</strong>terpretation <strong>of</strong> <strong>the</strong> results for <strong>the</strong> periods whennor<strong>the</strong>rly w<strong>in</strong>d events occur and do not occur.We noted relatively high correlations between E k * (–0.52,–0.42) and <strong>the</strong> two w<strong>in</strong>d stress components ( x , y ) dur<strong>in</strong>gTehuano events. As k<strong>in</strong>etic energy is def<strong>in</strong>ed as positive,<strong>the</strong>se negative correlations <strong>in</strong>dicate that <strong>in</strong>creases <strong>in</strong> E k * arecaused by SSW w<strong>in</strong>ds, that is, with negative x and y (seefig. 1b); however, <strong>the</strong> fact that <strong>the</strong> magnitude <strong>of</strong> y is greaterthan that <strong>of</strong> x suggests that E k * is ma<strong>in</strong>ly generated by y . In<strong>the</strong> absence <strong>of</strong> Tehuanos or dur<strong>in</strong>g weak w<strong>in</strong>d conditions, <strong>the</strong>correlation with y weakens (–0.29), while <strong>the</strong> correlationbetween E k * and x rema<strong>in</strong>s important (–0.45). This suggeststhat <strong>in</strong> <strong>the</strong> absence <strong>of</strong> nor<strong>the</strong>rly w<strong>in</strong>d events <strong>the</strong> zonal w<strong>in</strong>dcontributes to decrease E k *, s<strong>in</strong>ce <strong>the</strong> direction <strong>of</strong> <strong>the</strong> w<strong>in</strong>ddonde A es el área de cobertura de ambos sistemas RAF. Laserie de tiempo del rotacional del esfuerzo del viento presentavalores negativos durante los eventos tehuanos, mientras quela serie temporal de la divergencia muestra oscilaciones demayor frecuencia con cambios de signo (fig. 5a, b). La figura5(c, d) muestra con claridad que los eventos de viento producen<strong>in</strong>crementos de E k * y de * negativa. Cada una de lasseries temporales de las componentes zonal ( x ) y meridional( y ) (fig. 1b), del rotacional ( × ) y de la divergencia ()(fig. 5a, b) del esfuerzo del viento se correlacionaron con lasseries de tiempo de E k * y * para (a) todo el periodo demediciones, (b) los periodos de viento <strong>in</strong>tenso del norte y(c) los periodos de calma. Los resultados del análisis decorrelación se muestran en la tabla 1. Las correlaciones que<strong>in</strong>cluyen todos los datos y únicamente los correspondientes alos tehuanos son ligeramente menores, a excepción de lacorrelación entre x y *, que deja de ser significativadurante los tehuanos. Tomando en cuenta lo anterior, a cont<strong>in</strong>uaciónse describe la <strong>in</strong>terpretación de los resultados paralos periodos con presencia y ausencia de vientos del norte.La E k * presenta correlaciones relativamente altas (–0.52,–0.42) con las dos componentes del esfuerzo del viento( x , y ) durante los eventos tehuanos. Dado que la energíac<strong>in</strong>ética es def<strong>in</strong>ida positiva, estas correlaciones de signonegativo <strong>in</strong>dican que los aumentos de E k * son causados porvientos hacia el SSO, es decir, con x y y negativas (verfig. 1b); s<strong>in</strong> embargo, el hecho de que la magnitud de y esmayor que la de x sugiere que E k * se genera pr<strong>in</strong>cipalmentepor y . En periodos con ausencia de tehuanos o durante451
Ciencias Mar<strong>in</strong>as, Vol. 37, No. 4A, 2011Fig. 510-1-208/02 15/02 22/02 01/03 08/03 15/03a10-1-208/02 15/02 22/02 01/03 08/03 15/03b10108/02 15/02 22/02 01/03 08/03 15/03c0-1d08/02 15/02 22/02 01/03 08/03 15/03Time (days/month)Figure 5. Time series <strong>of</strong> (a) w<strong>in</strong>d stress curl ( × ), (b) w<strong>in</strong>d stress divergence (), and <strong>the</strong> spatial density <strong>of</strong> (c) k<strong>in</strong>etic energy (E k *) and(d) relative vorticity (*). The sampl<strong>in</strong>g period (9 February to 18 March 2005) is delimited by dashed l<strong>in</strong>es. The grey-toned bars <strong>in</strong>dicate <strong>the</strong>periods when ua events occurred.Figura 5. Series de tiempo de (a) el rotacional del esfuerzo del viento ( × ), (b) la divergencia del esfuerzo del viento () y la densidadespacial de (c) energía c<strong>in</strong>ética (E k *) y (d) vorticidad relativa (*). El periodo de mediciones está delimitado entre líneas punteadas y fue del9 de febrero al 18 de marzo de 2005. Las barras de color gris muestran los periodos de eventos tehuanos.452
Velázquez-Muñoz et al.: <strong>W<strong>in</strong>d</strong>-<strong>driven</strong> <strong>coastal</strong> <strong>circulation</strong> <strong>in</strong> <strong>the</strong> <strong>Gulf</strong> <strong>of</strong> <strong>Tehuantepec</strong>Table 1. Scalar correlation values <strong>of</strong> <strong>the</strong> time series <strong>of</strong> <strong>the</strong> spatialdensity <strong>of</strong> k<strong>in</strong>etic energy (E k *) and relative vorticity (*) with <strong>the</strong>representatative time series <strong>of</strong> <strong>the</strong> w<strong>in</strong>d stress zonal component( x ), meridional component ( y ), curl ( × ), and divergence ()at 15º N and 95º W. The correlation was calculated consider<strong>in</strong>g <strong>the</strong>data obta<strong>in</strong>ed dur<strong>in</strong>g <strong>the</strong> entire sampl<strong>in</strong>g period, and <strong>in</strong> <strong>the</strong>presence and absence <strong>of</strong> nor<strong>the</strong>rly w<strong>in</strong>d events. Values <strong>in</strong> bold arestatistically significant (95%).Tabla 1. Valores de correlación escalar de las series de tiempo de ladensidad espacial de energía c<strong>in</strong>ética (E k *) y vorticidad relativa(*) con las series de tiempo representativas de las componenteszonal ( x ) y meridional ( y ), del rotacional ( × ) y de ladivergencia () del esfuerzo del viento en el punto 15º N, 95º W.La correlación calculada se presenta al considerar todos los datosobtenidos durante el período de mediciones, y aquellos obtenidosen presencia y ausencia de los eventos de viento tehuano. Losvalores en negritas son estadísticamente significativos (al 95%).All data With Tehuanos Without TehuanosE k * * E k * * E k * * x –0.54 0.21 –0.52 0.16 –0.45 –0.11 y –0.46 0.43 –0.42 0.36 –0.29 0.02 × –0.46 0.38 –0.42 0.33 –0.27 –0.26 0.45 –0.38 0.42 –0.32 0.37 0.09(eastward) is contrary to that <strong>of</strong> <strong>the</strong> poleward <strong>coastal</strong> current(westward). The correlation coefficient between × andE k * is only significant dur<strong>in</strong>g <strong>the</strong> Tehuano events (–0.42). On<strong>the</strong> o<strong>the</strong>r hand, <strong>the</strong> relation between and E k * is significant<strong>in</strong> <strong>the</strong> presence (0.42) and absence (0.37) <strong>of</strong> <strong>the</strong>se events.This <strong>in</strong>dicates that negative × produces <strong>in</strong>creases <strong>in</strong>k<strong>in</strong>etic energy dur<strong>in</strong>g <strong>the</strong> Tehuano events, whereas doesso all <strong>the</strong> time.One <strong>of</strong> <strong>the</strong> ma<strong>in</strong> effects <strong>of</strong> w<strong>in</strong>d on <strong>the</strong> ocean is <strong>the</strong> production<strong>of</strong> relative vorticity. The generation <strong>of</strong> mesoscaleeddies <strong>in</strong> <strong>the</strong> GT is directly related to Tehuano events(Stumpf 1975, Stumpf and Legeckis 1977), which have beenobserved by satellite images (Müller-Karger and Fuentes-Yaco 2000, McCla<strong>in</strong> et al. 2002, González-Silvera et al.2004) and direct measurements (Barton et al. 1993, Trasviñaet al. 1995). Our observations presented here<strong>in</strong> corroborate<strong>the</strong> close relationship between <strong>the</strong> w<strong>in</strong>d stress components( x , y ) and relative vorticity (figs. 1b, 5d). Our results showthat * has low correlation with x when Tehuano eventsoccur (0.16) and do not occur (–0.11), and does not evenreach statistically significant values. The fact that <strong>the</strong> correlationbetween * and y is high (0.36) dur<strong>in</strong>g Tehuanos andnull (0.02) when <strong>the</strong>y are absent <strong>in</strong>dicates that <strong>the</strong> production<strong>of</strong> vorticity occurs ma<strong>in</strong>ly dur<strong>in</strong>g w<strong>in</strong>d events due to <strong>the</strong>contribution <strong>of</strong> y . On <strong>the</strong> o<strong>the</strong>r hand, <strong>in</strong> <strong>the</strong> absence <strong>of</strong> w<strong>in</strong>devents, * does not show any relationship with <strong>the</strong> w<strong>in</strong>dassociatedvariables, <strong>in</strong>dicat<strong>in</strong>g that <strong>the</strong>re is ano<strong>the</strong>r significantsource, besides w<strong>in</strong>d, that produces relative vorticity.vientos débiles la correlación con y se vuelve débil (–0.29),mientras que la correlación entre E k * y x es aún importante(–0.45). Esto sugiere que en ausencia de eventos de vientoexiste cierta contribución del viento zonal para dism<strong>in</strong>uir E k *,ya que la dirección del viento (al este) es opuesta a la de lacorriente costera que va hacia el polo (al oeste). El coeficientede correlación entre × y E k * sólo es significativodurante los tehuanos (–0.42). Por otro lado, la relación entre y E k * es significativa tanto en la presencia (0.42) comoen la ausencia (0.37) de estos eventos. Esto <strong>in</strong>dica quedurante los tehuanos, un × negativo produce aumentos deenergía c<strong>in</strong>ética, mientras que lo hace durante todo eltiempo.Uno de los pr<strong>in</strong>cipales efectos del viento sobre el océanoes la producción de vorticidad relativa. Se ha demostrado quela generación de remol<strong>in</strong>os de mesoescala en el GT está asociadadirectamente a los eventos tehuanos (Stumpf 1975,Stumpf y Legeckis 1977), los cuales han sido observadosmediante imágenes satelitales (Müller-Karger y Fuentes-Yaco 2000, McCla<strong>in</strong> et al. 2002, González-Silvera et al.2004) y estudios de mediciones directas (Barton et al. 1993,Trasviña et al. 1995). Las observaciones que se presentanaquí corroboran la relación estrecha entre las componentesdel esfuerzo del viento ( x , y ) y la vorticidad relativa (verfigs. 1b y 5d). Los resultados muestran que * tiene muybaja correlación con x en presencia (0.16) y ausencia (–0.11)de eventos tehuanos y ni siquiera alcanza valores estadísticamentesignificativos. El hecho de que la correlación de *con y es alta (0.36) durante los tehuanos y nula (0.02) enausencia de éstos muestra que la producción de vorticidadocurre, pr<strong>in</strong>cipalmente, durante eventos de viento debida a lacontribución de y . Por otra parte, en ausencia de eventosde viento, * no muestra relación alguna con las variablesasociadas al viento, lo que <strong>in</strong>dica que existe otra fuente significativa,además del viento, que produce vorticidad relativa.Durante los vientos del norte, la correlación entre * y × es positiva (0.33) y la correlación entre * y es negativa(–0.32), y es significativa en ambos casos. Fuera de loseventos de viento tehuano, los valores de correlación sonbajos (–0.26 y 0.09). Estos resultados <strong>in</strong>dican que los aumentosde * durante los eventos de viento están relacionadoscon aumentos de × negativo y positiva. Lo anteriorcomprueba la importancia que puede tener sobre la circulaciónsuperficial, que puede llegar a ser tan significativacomo la del × .CONCLUSIONESEste trabajo presenta observaciones de corrientes ytemperatura superficial obtenidas frente a la costa del GT quemuestran la variabilidad temporal del océano cerca de lacosta en un periodo de tiempo donde se presentan fuerteseventos de viento. La circulación costera en <strong>in</strong>vierno,después de un evento tehuano, muestra una corriente que453
Ciencias Mar<strong>in</strong>as, Vol. 37, No. 4A, 2011Dur<strong>in</strong>g nor<strong>the</strong>rly w<strong>in</strong>d events, <strong>the</strong> correlation between *and × is positive (0.33) and <strong>the</strong> correlation between *and is negative (–0.32), and it is significant <strong>in</strong> bothcases. In <strong>the</strong> absence <strong>of</strong> Tehuanos, <strong>the</strong> correlation values arelow (–0.26 and 0.09). These results <strong>in</strong>dicate that <strong>in</strong>creases <strong>in</strong>* dur<strong>in</strong>g w<strong>in</strong>d events are related to <strong>in</strong>creases <strong>in</strong> negative × and positive . This also confirms <strong>the</strong> significanteffect that can have on surface <strong>circulation</strong>, which can beas significant as that <strong>of</strong> × .CONCLUSIONSIn this study we present surface temperature and currentobservations oba<strong>in</strong>ed <strong>in</strong> <strong>the</strong> GT show<strong>in</strong>g <strong>the</strong> nearshore oceantemporal variability <strong>in</strong> a period <strong>of</strong> time when strong w<strong>in</strong>devents occur. W<strong>in</strong>ter <strong>coastal</strong> <strong>circulation</strong> after a Tehuano eventshows a persistent current flow<strong>in</strong>g from east to west at amean speed <strong>of</strong> ~0.4 m s –1 , result<strong>in</strong>g <strong>in</strong> <strong>the</strong> <strong>in</strong>flow to <strong>the</strong> GT <strong>of</strong>a warm water mass. This current enter<strong>in</strong>g on <strong>the</strong> east side isvery persistent dur<strong>in</strong>g <strong>the</strong> sampl<strong>in</strong>g period and is associatedwith an area <strong>of</strong> low variability <strong>of</strong>f <strong>the</strong> east coast. Barton et al.(2009) also reported <strong>the</strong> presence <strong>of</strong> a 100-km-wide <strong>coastal</strong>current <strong>of</strong> ~0.2 m s –1 dur<strong>in</strong>g w<strong>in</strong>ter. More recently, <strong>the</strong> resultsobta<strong>in</strong>ed by Flores-Vidal et al. (2011) show that this currentis persistent throughout <strong>the</strong> year. At <strong>the</strong> beg<strong>in</strong>n<strong>in</strong>g <strong>of</strong> <strong>the</strong>w<strong>in</strong>d events <strong>the</strong> <strong>coastal</strong> surface current deviates southwestwardsand is associated with a decrease <strong>in</strong> surface temperaturebelow <strong>the</strong> w<strong>in</strong>d jet axis. As <strong>the</strong> w<strong>in</strong>d events develop, <strong>the</strong>current on <strong>the</strong> west side reverses and converges with <strong>the</strong>current enter<strong>in</strong>g on <strong>the</strong> east side. Both currents converge <strong>in</strong><strong>the</strong> nor<strong>the</strong>rn part <strong>of</strong> <strong>the</strong> GT and flow southwards below <strong>the</strong>w<strong>in</strong>d jet axis. The formation <strong>of</strong> an anticyclonic structure thatcaptures a patch <strong>of</strong> cold upwelled water is observed on <strong>the</strong>west side, but <strong>the</strong> formation <strong>of</strong> its cyclonic counterpart is notobserved on <strong>the</strong> opposite side, at least not with<strong>in</strong> <strong>the</strong> HFRcoverage area. This w<strong>in</strong>d-<strong>driven</strong> dynamics is ano<strong>the</strong>r <strong>of</strong> ourf<strong>in</strong>d<strong>in</strong>gs that is <strong>in</strong> agreement with that reported by Bartonet al. (2009).Contrary to that reported by Trasviña and Barton (2008),who observed a dipole structure <strong>in</strong> summer, <strong>the</strong> formation <strong>of</strong>a cyclonic eddy on <strong>the</strong> east side <strong>of</strong> <strong>the</strong> GT cannot be dist<strong>in</strong>guished<strong>in</strong> our w<strong>in</strong>ter observations despite <strong>the</strong> use <strong>of</strong> seasurface temperature imagery to speculate beyond <strong>the</strong> areacovered by <strong>the</strong> HFR systems. We assume that <strong>the</strong> ma<strong>in</strong> discrepancyproduc<strong>in</strong>g this response is <strong>the</strong> difference between<strong>the</strong> duration and <strong>in</strong>tensity <strong>of</strong> <strong>the</strong> w<strong>in</strong>d events, which arelonger last<strong>in</strong>g (up to six days) but less <strong>in</strong>tense (~10 m s –1 ) <strong>in</strong>summer relative to <strong>the</strong> w<strong>in</strong>ter pulses that last two to threedays but reach speeds <strong>of</strong> up to 18 m s –1 .To date, <strong>the</strong> eddies generated <strong>in</strong> <strong>the</strong> GT have been studiedafter <strong>the</strong>y have been formed (Trasviña et al. 1995) and, as<strong>the</strong>y occur far from shore, when <strong>the</strong>y can be identified <strong>in</strong>satellite images; however, <strong>the</strong> physical mechanisms thatgenerate <strong>the</strong>se eddies and <strong>the</strong> reason why <strong>the</strong>y are not<strong>the</strong> same <strong>in</strong> size and <strong>in</strong>tensity have not yet been clearlyfluye de manera persistente de este a oeste a una velocidadpromedio de ~0.4 m s –1 ; esto provoca la entrada de una masade agua cálida al GT. Esta corriente que entra por el este fuemuy persistente durante el periodo de observaciones y estáasociada con una zona de baja variabilidad hacia el estefrente a la costa. Este resultado es congruente con el trabajode Barton et al. (2009), quienes registran la presencia de unacorriente costera de ~0.2 m s –1 y 100 km de ancho durante el<strong>in</strong>vierno. Recientemente, los resultados de Flores-Vidal et al.(2011) muestran que esta corriente es persistente durante todoel año. Durante el <strong>in</strong>icio de los eventos de viento la corrientecostera superficial se desvía hacia el suroeste y está asociadacon un descenso en la temperatura superficial por debajo deleje del chorro de viento. Conforme se desarrollan dichoseventos, la corriente del lado oeste se <strong>in</strong>vierte de tal formaque genera convergencia costera con la corriente que entrapor el este. Ambas corrientes convergen en la parte norte delGT y fluyen hacia el sur por debajo del eje del chorro deviento. En el lado oeste se observa parte de la formación deuna estructura anticiclónica que captura una mancha de aguafría, producto de la surgencia y la mezcla producidas por elviento, mientras que en el lado opuesto no se observa la formaciónde su contraparte ciclónica, por lo menos no dentrodel área de cobertura de los sistemas RAF. Esta d<strong>in</strong>ámicaforzada por el viento es otro resultado de nuestras medicionesque está de acuerdo con el trabajo de Barton et al. (2009).A diferencia de lo registrado por Trasviña y Barton(2008) para la circulación de verano, donde se muestra lapresencia de una estructura en forma de dipolo, en las observacionesde <strong>in</strong>vierno del presente estudio no se pudo dist<strong>in</strong>guirla formación del remol<strong>in</strong>o ciclónico en el lado este delGT, aun cuando se usaron las imágenes de la temperaturasuperficial del mar para especular más allá de la zona decobertura de los sistemas RAF. Se puede suponer que la pr<strong>in</strong>cipaldiscrepancia que produce esta respuesta es la diferenciaentre la duración e <strong>in</strong>tensidad de los eventos de viento, loscuales son más duraderos (hasta 6 días) pero de menor<strong>in</strong>tensidad (~10 m s –1 ) en verano con respecto a los “pulsos”de <strong>in</strong>vierno que duran de dos a tres días pero alcanzan velocidadesde hasta 18 m s –1 .Hasta la fecha, los remol<strong>in</strong>os generados en el GT han sidoestudiados una vez que se han formado (Trasviña et al. 1995)y cuando ya es posible identificarlos con imágenes satelitales,debido a que se encuentran lejos de la costa; s<strong>in</strong> embargo,no se han establecido de forma clara cuáles son los mecanismosfísicos que generan dichos remol<strong>in</strong>os y el motivo por elcual no son iguales en tamaño e <strong>in</strong>tensidad. Los resultadosque se presentan aquí apoyan la hipótesis planteada de que laasimetría entre las características de ambos remol<strong>in</strong>os esproducida, o al menos <strong>in</strong>tensificada, por la presencia de lacorriente costera observada, la cual no ha sido considerada entrabajos anteriores donde se discute sobre la formación yevolución de los remol<strong>in</strong>os.Los resultados de los cálculos de correlación, que consideranpor primera vez la componente del viento paralela a la454
Velázquez-Muñoz et al.: <strong>W<strong>in</strong>d</strong>-<strong>driven</strong> <strong>coastal</strong> <strong>circulation</strong> <strong>in</strong> <strong>the</strong> <strong>Gulf</strong> <strong>of</strong> <strong>Tehuantepec</strong>identified. The results presented <strong>in</strong> <strong>the</strong> present study support<strong>the</strong> hypo<strong>the</strong>sis that <strong>the</strong> asymmetry between <strong>the</strong> characteristics<strong>of</strong> both eddies is produced, or at least <strong>in</strong>tensified, by <strong>the</strong>presence <strong>of</strong> <strong>the</strong> <strong>coastal</strong> current observed, which has not beenconsidered <strong>in</strong> prior reports discuss<strong>in</strong>g <strong>the</strong> formation andevolution <strong>of</strong> <strong>the</strong>se eddies.The results <strong>of</strong> <strong>the</strong> correlation estimates, which for <strong>the</strong> firsttime consider <strong>the</strong> w<strong>in</strong>d component parallel to <strong>the</strong> coast andw<strong>in</strong>d stress divergence, <strong>in</strong>dicate that <strong>the</strong> k<strong>in</strong>etic energy <strong>of</strong><strong>the</strong> surface current is well related to <strong>the</strong> variation <strong>in</strong> w<strong>in</strong>dstress dur<strong>in</strong>g <strong>the</strong> entire sampl<strong>in</strong>g period and dur<strong>in</strong>g nor<strong>the</strong>rlyw<strong>in</strong>d events. In <strong>the</strong> absence <strong>of</strong> w<strong>in</strong>d events, however, <strong>the</strong>correlation is much higher us<strong>in</strong>g only <strong>the</strong> zonal component<strong>of</strong> w<strong>in</strong>d stress, which suggests a direct effect on <strong>circulation</strong>,weaken<strong>in</strong>g <strong>the</strong> westward flow<strong>in</strong>g current and, <strong>the</strong>refore,caus<strong>in</strong>g a decrease <strong>in</strong> k<strong>in</strong>etic energy. On <strong>the</strong> o<strong>the</strong>r hand, relativevorticity had high correlations only with <strong>the</strong> <strong>of</strong>fshorecomponent, w<strong>in</strong>d stress curl and divergence throughout <strong>the</strong>sampl<strong>in</strong>g period and dur<strong>in</strong>g Tehuano events, which meansthat <strong>the</strong> significant <strong>in</strong>creases <strong>in</strong> negative relative vorticitywere produced dur<strong>in</strong>g <strong>the</strong> w<strong>in</strong>d events.Based on this study, we suggest that <strong>coastal</strong> <strong>circulation</strong> <strong>in</strong><strong>the</strong> GT is also related to <strong>the</strong> zonal component <strong>of</strong> w<strong>in</strong>d stress.On <strong>the</strong> o<strong>the</strong>r hand, <strong>the</strong> apparent importance <strong>of</strong> w<strong>in</strong>d stressdivergence <strong>in</strong>dicates that o<strong>the</strong>r mechanisms are <strong>in</strong>volved, <strong>in</strong>addition to Ekman transport and pump<strong>in</strong>g, and turbulent mix<strong>in</strong>g,which should be studied <strong>in</strong> <strong>the</strong> future to fully understand<strong>the</strong> processes that produce surface cool<strong>in</strong>g.ACKNOWLEDGEMENTSThe present study was supported by <strong>the</strong> Mexican Councilfor Science and Technology (CONACYT projects U40822-F,62520, 85018, and direcIOA), by a UC MEXUS-CONACYTcollaborative research grant, and by <strong>the</strong> Autonomous University<strong>of</strong> Baja California (UABC projects 311, 323, and 341).The first author acknowledges receipt <strong>of</strong> a PhD scholarshipfrom CONACYT, and support from <strong>the</strong> CONACYT mixedfund<strong>in</strong>gprogram (2005) and <strong>the</strong> UABC for a research stay at<strong>the</strong> University <strong>of</strong> Hawaii. The acquisition <strong>of</strong> satellite imagesand data was supported by SEP-2004-C01-48164 andUABC. Special thanks to <strong>the</strong> academic staff and students <strong>of</strong>Mar University at Puerto Angel and <strong>of</strong> <strong>the</strong> OceanographicResearch Station (Mexican Navy M<strong>in</strong>istry) at Sal<strong>in</strong>a Cruz for<strong>the</strong>ir assistance dur<strong>in</strong>g <strong>the</strong> transportation, <strong>in</strong>stallation, andoperation <strong>of</strong> <strong>the</strong> radar systems on <strong>the</strong> coast <strong>of</strong> Oaxaca. Thevaluable comments <strong>of</strong> three anonymous reviewers are highlyappreciated.costa y la divergencia del esfuerzo del viento, <strong>in</strong>dican que laenergía c<strong>in</strong>ética de la corriente superficial está bien relacionadacon la variabilidad del esfuerzo del viento durante todoel periodo de mediciones y durante los tehuanos. S<strong>in</strong>embargo, en ausencia de eventos de viento, la correlación esmucho mayor cuando se utiliza sólo la componente zonal delesfuerzo, lo que sugiere una acción directa sobre la circulación,al debilitar la corriente costera que va hacia el oeste y,por tanto, producir una dism<strong>in</strong>ución en la energía c<strong>in</strong>ética.Por otra parte, la vorticidad relativa sólo tiene correlacionesaltas con la componente normal a la costa, el rotacional y ladivergencia del esfuerzo del viento durante todo el periodo demediciones y durante los tehuanos; esto implica que losaumentos significativos observados en la vorticidad relativanegativa se produjeron durante los eventos de viento.A partir de este estudio se puede señalar que la circulacióncostera en el GT está también relacionada con lacomponente zonal del esfuerzo del viento. Por otra parte, laimportancia aparente de la divergencia del esfuerzo delviento nos sugiere la <strong>in</strong>fluencia de otros mecanismos implicados,además del bombeo y el transporte de Ekman, y lamezcla turbulenta, que deberían ser estudiados en un futuropara tener un entendimiento completo de los procesos queproducen el enfriamiento observado en la superficie.AGRADECIMIENTOSEl presente trabajo fue apoyado por el Consejo Nacionalde Ciencia y Tecnología (CONACYT; proyectos U40822-F,62520, 85018 y direcIOA), por el proyecto de colaboraciónUCMexUS-CONACYT y por la Universidad Autónoma deBaja California (UABC; proyectos 311, 323 y 341). Se agradecea CONACYT el apoyo otorgado al primer autor para labeca de doctorado y la estancia de trabajo en la Universidadde Hawaii a través del programa Beca Mixta 2005. La adquisiciónde las imágenes y datos satelitales fue apoyado a travésdel proyecto SEP-2004-C01-48164 y la UABC. Por último,pero no menos importante, queremos también agradecer alpersonal académico y estudiantes de la Universidad del Mar,campus Puerto Angel, y de la Estación de InvestigaciónOceanográfica de Sal<strong>in</strong>a Cruz de la Secretaria de Mar<strong>in</strong>aArmada de México el apoyo br<strong>in</strong>dado para la logística deltraslado, la <strong>in</strong>stalación y la operación de los sistemas de radarde alta frecuencia en la costa de Oaxaca. Se agradece tambiéna los tres revisores anónimos sus valiosos comentarios paramejorar el manuscrito.English translation by Christ<strong>in</strong>e Harris.REFERENCESAtlas R, H<strong>of</strong>fman RN, Bloom SC, Jusem JC, Ardizzone J. 1996. Amultiyear global surface w<strong>in</strong>d velocity data set us<strong>in</strong>g SSM/Iw<strong>in</strong>d observations. Bull. Am. Meteorol. Soc. 77: 869–882.Barton ED, Argote ML, Brown J, Kosro PM, Lavín MF, Robles JM,Smith RL, Trasviña A, Vélez HS. 1993. Supersquirt: Dynamics<strong>of</strong> <strong>the</strong> <strong>Gulf</strong> <strong>of</strong> <strong>Tehuantepec</strong>, <strong>Mexico</strong>. Oceanography 6: 23–30.455
Ciencias Mar<strong>in</strong>as, Vol. 37, No. 4A, 2011Barton ED, Lavín MF, Trasviña A. 2009. Coastal <strong>circulation</strong> andhydrography <strong>in</strong> <strong>the</strong> <strong>Gulf</strong> <strong>of</strong> <strong>Tehuantepec</strong>, <strong>Mexico</strong>, dur<strong>in</strong>g w<strong>in</strong>ter.Cont. Shelf Res. 29: 485–500.Clarke AJ. 1988. Inertial w<strong>in</strong>d path and sea surface temperaturepatterns near <strong>the</strong> <strong>Gulf</strong> <strong>of</strong> <strong>Tehuantepec</strong> and <strong>Gulf</strong> <strong>of</strong> Papagayo.J. Geophys. Res. 93(C12): 15491–15501.Chelton DB, Esbensen SK, Schlax MG, Thum N, Freilich MH,Wentz FJ, Gentemann CL, McPhaden MJ, Schopf PS. 2001.Observations <strong>of</strong> coupl<strong>in</strong>g between surface w<strong>in</strong>d stress and seasurface temperature <strong>in</strong> <strong>the</strong> Eastern Tropical Pacific. J. Clim. 14:1479–1498.Flores-Vidal X, Durazo R, Flament P, Chavanne C. 2011.Circulación costera en ausencia de viento en el Golfo de<strong>Tehuantepec</strong>, México: Observaciones con radares de altafrecuencia. Cienc. Mar. 37(4A): 493–512.González-Silvera A, Santamaría-del-Ángel E, Millán-Núñez R,Manzo-Monroy H. 2004 Satellite observations <strong>of</strong> mesoscaleeddies <strong>in</strong> <strong>the</strong> gulfs <strong>of</strong> <strong>Tehuantepec</strong> and Papagayo (EasternTropical Pacific). Deep-Sea Res. II 51: 587–600.Gurgel KW, Antonischki G, Essen HH, Schlick T. 2000. WellenRadar (WERA): A new ground-wave HF radar for ocean remotesens<strong>in</strong>g. Coast. Eng. 37: 219–234.H<strong>of</strong>fman RN. 1984. SASS w<strong>in</strong>d ambiguity removal by directm<strong>in</strong>imization. Mon. Wea<strong>the</strong>r Rev. II 112: 1829–1852.Kessler WS. 2002. Mean three-dimensional <strong>circulation</strong> <strong>in</strong> <strong>the</strong>Nor<strong>the</strong>ast Tropical Pacific. J. Phys. Oceanogr. 32: 2457–2471.Large WG, Pond S. 1981. Open ocean momentum flux measurements<strong>in</strong> moderate to strong w<strong>in</strong>ds. J. Phys. Oceanogr. 11:324–336.Lavín MF, Robles JM, Argote ML, Barton ED, Smith R, Brown J,Kosro M, Trasviña A, Vélez HS, García J. 1992. Física delGolfo de <strong>Tehuantepec</strong>. Cienc. Desarr. VXVIII(103): 98–108.McCla<strong>in</strong> CR, Christian JR, Signor<strong>in</strong>i SR, Lewis MR, Asanuma I,Turk D, Dupouy-Douchement C. 2002. Satellite ocean-colorobservations <strong>of</strong> <strong>the</strong> tropical Pacific Ocean. Deep-Sea Res. II 49:2533–2560.McCreary JP, Lee HS, Enfield DB. 1989. The response <strong>of</strong> <strong>the</strong> <strong>coastal</strong>ocean to strong <strong>of</strong>fshore w<strong>in</strong>ds: With application to <strong>circulation</strong>s<strong>in</strong> <strong>the</strong> gulfs <strong>of</strong> <strong>Tehuantepec</strong> and Papagayo. J. Mar. Res. 47:81–109.Müller-Karger FE, Fuentes-Yaco C. 2000. Characteristics <strong>of</strong> w<strong>in</strong>dgeneratedr<strong>in</strong>gs <strong>in</strong> <strong>the</strong> eastern tropical Pacific Ocean. J. Geophys.Res. 105(C1): 1271–1284.Paduan J, Cook M. 2004. HFRadarmap toolbox for MATLAB,Naval Postgraduate School, Monterey, California (available athttp://www.oc.nps.navy.mil/radlab/HFRadarmapToolbox/).Romero-Centeno R, Zavala-Hidalgo J, Gallegos A, O’Brien JJ.2003. Isthmus <strong>of</strong> <strong>Tehuantepec</strong> w<strong>in</strong>d climatology and ENSOsignal. J. Clim. 16: 2628–2639.Steenburgh WJ, Schultz DM, Colle BA. 1998. The structure andevolution <strong>of</strong> gap outflow over <strong>the</strong> <strong>Gulf</strong> <strong>of</strong> <strong>Tehuantepec</strong>, <strong>Mexico</strong>.Mon. Wea<strong>the</strong>r Rev. 126: 2673–2691.Stumpf HG. 1975. Satellite detection <strong>of</strong> upwell<strong>in</strong>g <strong>in</strong> <strong>the</strong> <strong>Gulf</strong> <strong>of</strong><strong>Tehuantepec</strong>, <strong>Mexico</strong>. J. Phys. Oceanogr. 5: 383–388.Stumpf HG, Legeckis RV. 1977. Satellite observations <strong>of</strong> mesoscaleeddy dynamics <strong>in</strong> <strong>the</strong> eastern tropical Pacific Ocean. J. Phys.Oceanogr. 7: 648–658.Trasviña A, Barton ED. 2008. Summer <strong>circulation</strong> <strong>in</strong> <strong>the</strong> Mexicantropical Pacific. Deep-Sea Res. I 55: 587–607.Trasviña A, Barton ED, Brown J, Vélez HS, Kosro PM, Smith RL.1995. Offshore w<strong>in</strong>d forc<strong>in</strong>g <strong>in</strong> <strong>the</strong> <strong>Gulf</strong> <strong>of</strong> <strong>Tehuantepec</strong>,<strong>Mexico</strong>: The asymmetric <strong>circulation</strong>. J. Geophys. Res.100(C10): 20649–20663.Wyrtki K. 1965. Surface currents <strong>of</strong> <strong>the</strong> eastern tropical Pacificocean. Inter-Am. Trop. Tuna Comm. Bull. 9 (5): 271–304.Received December 2010;accepted May 2011.456