

Producción mundial de manzanas y peras
inta_produccion-mundial-de-manzanas-y-peras_0
inta_produccion-mundial-de-manzanas-y-peras_0

You also want an ePaper? Increase the reach of your titles
YUMPU automatically turns print PDFs into web optimized ePapers that Google loves.
Mayo, 2016<br />
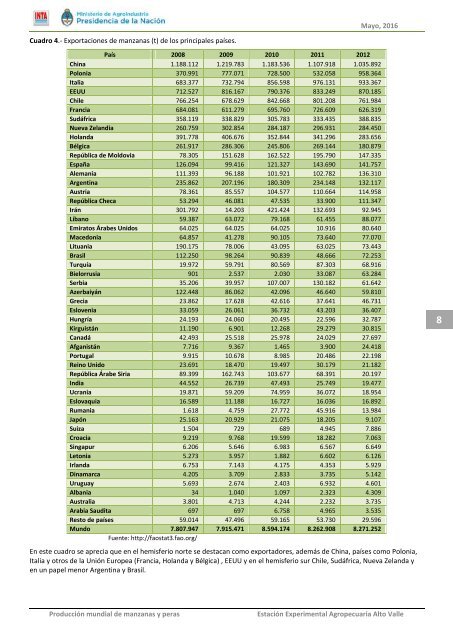
Cuadro 4.- Exportaciones <strong>de</strong> <strong>manzanas</strong> (t) <strong>de</strong> los principales países.<br />
País 2008 2009 2010 2011 2012<br />
China 1.188.112 1.219.783 1.183.536 1.107.918 1.035.892<br />
Polonia 370.991 777.071 728.500 532.058 958.364<br />
Italia 683.377 732.794 856.598 976.131 933.367<br />
EEUU 712.527 816.167 790.376 833.249 870.185<br />
Chile 766.254 678.629 842.668 801.208 761.984<br />
Francia 684.081 611.279 695.760 726.609 626.319<br />
Sudáfrica 358.119 338.829 305.783 333.435 388.835<br />
Nueva Zelandia 260.759 302.854 284.187 296.931 284.450<br />
Holanda 391.778 406.676 352.844 341.296 283.656<br />
Bélgica 261.917 286.306 245.806 269.144 180.879<br />
República <strong>de</strong> Moldovia 78.305 151.628 162.522 195.790 147.335<br />
España 126.094 99.416 121.327 143.690 141.757<br />
Alemania 111.393 96.188 101.921 102.782 136.310<br />
Argentina 235.862 207.196 180.309 234.148 132.117<br />
Austria 78.361 85.557 104.577 110.664 114.958<br />
República Checa 53.294 46.081 47.535 33.900 111.347<br />
Irán 301.792 14.203 421.424 132.693 92.945<br />
Líbano 59.387 63.072 79.168 61.455 88.077<br />
Emiratos Árabes Unidos 64.025 64.025 64.025 10.916 80.640<br />
Macedonia 64.857 41.278 90.105 73.640 77.070<br />
Lituania 190.175 78.006 43.095 63.025 73.443<br />
Brasil 112.250 98.264 90.839 48.666 72.253<br />
Turquía 19.972 59.791 80.569 87.303 68.916<br />
Bielorrusia 901 2.537 2.030 33.087 63.284<br />
Serbia 35.206 39.957 107.007 130.182 61.642<br />
Azerbaiyán 122.448 86.062 42.096 46.640 59.810<br />
Grecia 23.862 17.628 42.616 37.641 46.731<br />
Eslovenia 33.059 26.061 36.732 43.203 36.407<br />
Hungría 24.193 24.060 20.495 22.596 32.787<br />
Kirguistán 11.190 6.901 12.268 29.279 30.815<br />
Canadá 42.493 25.518 25.978 24.029 27.697<br />
Afganistán 7.716 9.367 1.465 3.900 24.418<br />
Portugal 9.915 10.678 8.985 20.486 22.198<br />
Reino Unido 23.691 18.470 19.497 30.179 21.182<br />
República Árabe Siria 89.399 162.743 103.677 68.391 20.197<br />
India 44.552 26.739 47.493 25.749 19.477<br />
Ucrania 19.871 59.209 74.959 36.072 18.954<br />
Eslovaquia 16.589 11.188 16.727 16.036 16.892<br />
Rumania 1.618 4.759 27.772 45.916 13.984<br />
Japón 25.163 20.929 21.075 18.205 9.107<br />
Suiza 1.504 729 689 4.945 7.886<br />
Croacia 9.219 9.768 19.599 18.282 7.063<br />
Singapur 6.206 5.646 6.983 6.567 6.649<br />
Letonia 5.273 3.957 1.882 6.602 6.126<br />
Irlanda 6.753 7.143 4.175 4.353 5.929<br />
Dinamarca 4.205 3.709 2.833 3.735 5.142<br />
Uruguay 5.693 2.674 2.403 6.932 4.601<br />
Albania 34 1.040 1.097 2.323 4.309<br />
Australia 3.801 4.713 4.244 2.232 3.735<br />
Arabia Saudita 697 697 6.758 4.965 3.535<br />
Resto <strong>de</strong> países 59.014 47.496 59.165 53.730 29.596<br />
Mundo 7.807.947 7.915.471 8.594.174 8.262.908 8.271.252<br />
Fuente: http://faostat3.fao.org/<br />
8<br />
En este cuadro se aprecia que en el hemisferio norte se <strong>de</strong>stacan como exportadores, a<strong>de</strong>más <strong>de</strong> China, países como Polonia,<br />
Italia y otros <strong>de</strong> la Unión Europea (Francia, Holanda y Bélgica) , EEUU y en el hemisferio sur Chile, Sudáfrica, Nueva Zelanda y<br />
en un papel menor Argentina y Brasil.<br />
<strong>Producción</strong> <strong>mundial</strong> <strong>de</strong> <strong>manzanas</strong> y <strong>peras</strong><br />
Estación Experimental Agropecuaria Alto Valle