Mesures de la biodiversité - UMR EcoFoG
Mesures de la biodiversité - UMR EcoFoG
Mesures de la biodiversité - UMR EcoFoG

You also want an ePaper? Increase the reach of your titles
YUMPU automatically turns print PDFs into web optimized ePapers that Google loves.
Eric Marcon<br />
05/03/2013<br />
MESURES<br />
DE LA BIODIVERSITÉ<br />
1
REMERCIEMENTS<br />
Je remercie François Morneau pour sa relecture attentive <strong>de</strong> <strong>la</strong> première version <strong>de</strong> ce document<br />
et sa contribution décisive pour <strong>la</strong> bonne utilisation <strong>de</strong> R dans les exemples.<br />
Bruno Hérault et Chris Baraloto ont contribué à <strong>la</strong> revue <strong>de</strong> <strong>la</strong> littérature <strong>de</strong> façon significative.<br />
Les opinions émises par les auteurs sont personnelles et n’engagent pas l’<strong>UMR</strong><br />
<strong>EcoFoG</strong> ou ses tutelles.
Sommaire<br />
MESURES DE LA BIODIVERSITÉ<br />
Remerciements ................................... 2<br />
Notations ............................................. 5<br />
Notions <strong>de</strong> diversité ............................. 7<br />
Composantes ....................................... 7<br />
Richesse 7<br />
Équitabilité 8<br />
Régu<strong>la</strong>rité et divergence 8<br />
Niveaux <strong>de</strong> l’étu<strong>de</strong> ................................ 9<br />
Diversité
4<br />
Typologie <strong>de</strong>s mesures 55<br />
Biais d’échantillonnage 56<br />
FD et PD ............................................. 56<br />
Indice <strong>de</strong> Rao ...................................... 56<br />
Principe 56<br />
Calcul sous R 57<br />
Maximum théorique 57<br />
Décomposition 59<br />
Alternatives 60<br />
FAD et MFAD ...................................... 60<br />
Hp et I1 ................................................. 61<br />
<strong>Mesures</strong> d’entropie phylogénétique ..... 61<br />
Généralisation <strong>de</strong> l’entropie HCDT 61<br />
Biais d’échantillonnage 62<br />
Entropie et diversité 62<br />
Décomposition 63<br />
Arbres non ultramétriques 64<br />
Régu<strong>la</strong>rité ........................................... 65<br />
Conclusion ......................................... 67<br />
Bibliographie ...................................... 69
Les notations peuvent différer <strong>de</strong> celles <strong>de</strong> <strong>la</strong><br />
littérature citée pour l’homogénéité <strong>de</strong> ce<br />
document. Souvent, <strong>la</strong> littérature écologique<br />
n’est pas très rigoureuse sur <strong>la</strong> distinction <strong>de</strong><br />
ce qui est un paramètre, une variable aléatoire<br />
ou son estimation. Par exemple, le<br />
nombre d’individus échantillonnés (choisi)<br />
<strong>de</strong>vrait être noté
Le terme <strong>biodiversité</strong> concerne le plus souvent<br />
<strong>la</strong> diversité en termes d’espèces d’un<br />
écosystème. On peut bien évi<strong>de</strong>mment<br />
s’intéresser à d’autres niveaux et d’autres<br />
objets, par exemple <strong>la</strong> diversité génétique<br />
(en termes d’allèles différents pour certains<br />
gènes ou marqueurs) à l’intérieur d’une popu<strong>la</strong>tion<br />
ou à l’opposé <strong>la</strong> diversité <strong>de</strong>s écosystèmes.<br />
On gar<strong>de</strong>ra toujours à l’esprit que<br />
<strong>la</strong> prise en compte <strong>de</strong> <strong>la</strong> diversité spécifique<br />
n’est pas <strong>la</strong> seule approche, même si le texte<br />
se s’y réfère le plus souvent.<br />
L’objectif <strong>de</strong> ce document est <strong>de</strong> traiter <strong>la</strong><br />
mesure <strong>de</strong> <strong>la</strong> <strong>biodiversité</strong>, pas son importance<br />
en tant que telle. On se référera par<br />
exemple à Chapin et al. (2000) pour une<br />
revue sur cette question.<br />
Les calculs nécessaires sont réalisés dans R<br />
(R Development Core Team, 2013), essentiellement<br />
avec le package entropart<br />
(Marcon et Hérault, submitted-a).<br />
L’ensemble du co<strong>de</strong> est disponible sur le site<br />
web 1 où se trouvent les mises à jour <strong>de</strong> ce<br />
document.<br />
Composantes<br />
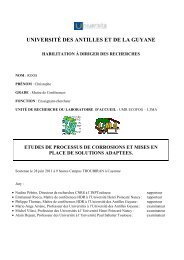
Une communauté comprenant beaucoup<br />
d’espèces mais avec une espèce dominante<br />
n’est pas perçue intuitivement comme plus<br />
diverse qu’une communauté avec moins<br />
d’espèces, mais dont les effectifs sont<br />
proche (Figure 1, colonne <strong>de</strong> gauche). La<br />
prise en compte <strong>de</strong> <strong>de</strong>ux composantes <strong>de</strong> <strong>la</strong><br />
diversité, appelées richesse et équitabilité,<br />
est nécessaire (Whittaker, 1965).<br />
1 http://www.ecofog.gf/spip.php?article427<br />
NOTIONS DE DIVERSITÉ<br />
Richesse<br />
La richesse est le nombre (ou une fonction<br />
croissante du nombre) <strong>de</strong> c<strong>la</strong>sses différentes<br />
présentes dans le système étudié, par<br />
exemple le nombre d’espèces d’arbres dans<br />
une forêt.<br />
Un certain nombre d’hypothèses sont assumées<br />
plus ou moins explicitement :<br />
● Les c<strong>la</strong>sses sont bien connues : compter le<br />
nombre d’espèces a peu <strong>de</strong> sens si <strong>la</strong><br />
taxonomie n’est pas bien établie. C’est<br />
parfois une difficulté majeure quand on<br />
travaille sur les microorganismes.<br />
● Les c<strong>la</strong>sses sont équidistantes : <strong>la</strong> richesse<br />
augmente d’une unité quand on rajoute<br />
une espèce, que cette espèce soit proche<br />
<strong>de</strong>s précé<strong>de</strong>ntes ou extrêmement originale.<br />
Figure 1 : Importances <strong>de</strong> <strong>la</strong> richesse (en haut) et<br />
<strong>de</strong> l’équitabilité (en bas) pour <strong>la</strong> définition <strong>de</strong> <strong>la</strong><br />
diversité<br />
L’indice <strong>de</strong> richesse le plus simple et le plus<br />
utilisé est tout simplement le nombre<br />
d’espèces
<strong>Mesures</strong> <strong>de</strong> <strong>la</strong> <strong>biodiversité</strong><br />
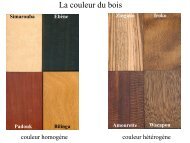
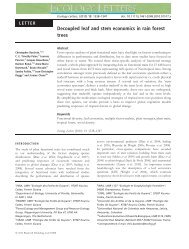
Figure 2 : Patrons <strong>de</strong> <strong>biodiversité</strong> (Gaston, 2000, figure 1). (a) Le nombre d’espèces <strong>de</strong> vers <strong>de</strong> terre augmente<br />
en fonction <strong>de</strong> <strong>la</strong> surface échantillonnée, <strong>de</strong> 100 m 2 à plus <strong>de</strong> 500 000 km 2 selon <strong>la</strong> re<strong>la</strong>tion<br />
d’Arrhenius (voir page 16). (b) Nombre d’espèces d’oiseaux en fonction <strong>de</strong> <strong>la</strong> <strong>la</strong>titu<strong>de</strong>. (c) Re<strong>la</strong>tion entre <strong>la</strong><br />
richesse régionale et <strong>la</strong> richesse locale. (d) Nombre d’espèces <strong>de</strong> chauves-souris en fonction <strong>de</strong> l’altitu<strong>de</strong><br />
dans une réserve au Pérou. (e) Nombre d’espèces <strong>de</strong> végétaux ligneux en fonction <strong>de</strong>s précipitations en<br />
Afrique du Sud.<br />
Équitabilité<br />
La régu<strong>la</strong>rité <strong>de</strong> <strong>la</strong> distribution <strong>de</strong>s espèces<br />
(équitabilité en Français, evenness ou equitability<br />
en Ang<strong>la</strong>is) est un élément important<br />
<strong>de</strong> <strong>la</strong> diversité. Une espèce représentée<br />
abondamment ou par un seul individu<br />
n’apporte pas <strong>la</strong> même contribution à<br />
l’écosystème. À nombre d’espèces égal, <strong>la</strong><br />
présence d’espèces très dominantes entraîne<br />
mathématiquement <strong>la</strong> rareté <strong>de</strong> certaines<br />
autres : on comprend donc assez intuitivement<br />
que le maximum <strong>de</strong> diversité sera<br />
atteint quand les espèces auront une répartition<br />
très régulière.<br />
Un indice d’équitabilité est indépendant du<br />
nombre d’espèces (donc <strong>de</strong> <strong>la</strong> richesse).<br />
8<br />
La plupart <strong>de</strong>s indices courants, comme<br />
ceux <strong>de</strong> Simpson ou <strong>de</strong> Shannon, évaluent à<br />
<strong>la</strong> fois <strong>la</strong> richesse et l’équitabilité.<br />
Régu<strong>la</strong>rité et divergence<br />
Les mesures c<strong>la</strong>ssiques <strong>de</strong> <strong>la</strong> diversité ne<br />
prennent pas en compte une quelconque<br />
distance entre c<strong>la</strong>sses. Pourtant, <strong>de</strong>ux espèces<br />
du même genre sont <strong>de</strong> toute évi<strong>de</strong>nce<br />
plus proches que <strong>de</strong>ux espèces <strong>de</strong> familles<br />
différentes. Les mesures <strong>de</strong> diversité phylogénétique<br />
et <strong>de</strong> diversité fonctionnelle prennent<br />
en compte cette notion, qui nécessite<br />
quelques définitions supplémentaires<br />
(Mouillot et al., 2005 ; Ricotta, 2007 ;<br />
Pavoine et Bonsall, 2011).
La mesure <strong>de</strong> <strong>la</strong> différence entre <strong>de</strong>ux<br />
c<strong>la</strong>sses est souvent une distance, mais parfois<br />
une mesure qui n’a pas toutes les propriétés<br />
d’une distance : une dissimi<strong>la</strong>rité<br />
(voir Dissimi<strong>la</strong>rité et distance, page 53).<br />
Les mesures <strong>de</strong> divergence sont construites<br />
à partir <strong>de</strong> <strong>la</strong> dissimi<strong>la</strong>rité entre les c<strong>la</strong>sses,<br />
avec ou sans pondération par <strong>la</strong> fréquence.<br />
Les mesures <strong>de</strong> régu<strong>la</strong>rité décrivent <strong>la</strong> façon<br />
dont les espèces occupent l’espace <strong>de</strong>s<br />
niches. Ce concept est équivalent à celui<br />
d’équitabilité dans les mesures c<strong>la</strong>ssiques.<br />
Niveaux <strong>de</strong> l’étu<strong>de</strong><br />
Figure 3 : Diversité
<strong>Mesures</strong> <strong>de</strong> <strong>la</strong> <strong>biodiversité</strong><br />
Nb Espèces<br />
0 10 20 30 40 50<br />
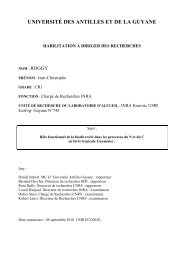
Figure 5 : Histogramme <strong>de</strong>s fréquences (diagramme <strong>de</strong><br />
Preston) <strong>de</strong>s arbres du dispositif <strong>de</strong> Barro Colorado<br />
Is<strong>la</strong>nd (Hubbell et al., 2005). En abscisse, le nombre<br />
d’arbres <strong>de</strong> chaque espèce (en logarithme), en ordonnée,<br />
le nombre d’espèces.<br />
10<br />
0 2 4 6 8<br />
Décomposition<br />
lnN s<br />
Whittaker (1977) a proposé sans succès une<br />
normalisation <strong>de</strong>s échelles d’évaluation <strong>de</strong> <strong>la</strong><br />
<strong>biodiversité</strong>, en introduisant <strong>la</strong> diversité régionale
<strong>de</strong>s fréquences (diagramme <strong>de</strong> Preston, Figure<br />
5 2 ) ou bien d’un diagramme rangabondance<br />
(RAC : Rank Abundance Curve,)<br />
ou diagramme <strong>de</strong> Whittaker, Figure 6 3 . Le<br />
RAC est souvent utilisé pour reconnaître <strong>de</strong>s<br />
distributions connues. Izsák et Pavoine<br />
(2012) ont étudié les propriétés <strong>de</strong>s RAC<br />
pour les principales SAD.<br />
Les SAD ne sont pas traitées en détail ici :<br />
on se reportera à Magurran (1988), McGill<br />
et al. (2007) et Izsák et Pavoine (2012). Les<br />
SAD nécessaires à <strong>la</strong> compréhension <strong>de</strong> <strong>la</strong><br />
suite sont :<br />
● La distribution en log-séries <strong>de</strong> Fisher<br />
(1943)<br />
● La distribution log-normale (Preston,<br />
1948),<br />
● le modèle Broken Stick <strong>de</strong> MacArthur<br />
(1957).<br />
2 Le co<strong>de</strong> R nécessaire pour réaliser les figures est:<br />
> library(vegan)<br />
> data(BCI)<br />
> Ns N hist(log(Ns), main = NULL , x<strong>la</strong>b<br />
= expression(ln(N[s])), y<strong>la</strong>b="Nb<br />
Espèces")<br />
3 Co<strong>de</strong> complémentaire pour le diagramme <strong>de</strong> Whit-<br />
taker :<br />
> S=length(Ns)<br />
> plot(Ns, type = "b", log = "y",<br />
main = NULL, x<strong>la</strong>b = "Rang", y<strong>la</strong>b =<br />
expression(ln(N[s])))<br />
> ranks.lognormal lines(ranks.lognormal, Ns,<br />
col="red", lwd=3)<br />
Notions <strong>de</strong> diversité<br />
11
MESURES NEUTRES DE LA DIVERSITÉ
<strong>Mesures</strong> <strong>de</strong> <strong>la</strong> <strong>biodiversité</strong><br />
le nombre moyen d’espèces trouvé pour<br />
chacun, ce qui permet <strong>de</strong> lisser <strong>la</strong> courbe.<br />
Lorsque l’inventaire est fait par quadrats ou<br />
toute autre métho<strong>de</strong> qui regroupe les individus<br />
(pièges à insectes, filets <strong>de</strong> pêche…), les<br />
courbes montrent moins d’espèces pour le<br />
même effort d’échantillonnage à cause <strong>de</strong><br />
l’agrégation spatiale <strong>de</strong>s espèces, problème<br />
traité plus loin.<br />
Il s’agit dans un premier temps <strong>de</strong> mesurer<br />
<strong>la</strong> diversité
<strong>Mesures</strong> neutres <strong>de</strong> <strong>la</strong> diversité
<strong>Mesures</strong> <strong>de</strong> <strong>la</strong> <strong>biodiversité</strong><br />
Enfin, l’indice <strong>de</strong> Fisher repose lour<strong>de</strong>ment<br />
sur l’hypothèse que <strong>la</strong> distribution réelle <strong>de</strong>s<br />
espèces est conforme au modèle. Jost (2007)<br />
montre par un exemple que <strong>de</strong>s interprétations<br />
absur<strong>de</strong>s <strong>de</strong> l’indice peuvent être faites<br />
si l’hypothèse n’est pas respectée.<br />
Figure 9 : Comparaison entre le modèle <strong>de</strong> Fisher<br />
et le modèle étendu dans trois parcelles forestières<br />
connues. Les modèles sont ajustés aux données<br />
observées par Condit et al. (1996). Les courbes<br />
légendées Equation 4 correspon<strong>de</strong>nt au modèle <strong>de</strong><br />
Fisher étendu, équation (2), alors que l’Equation 5<br />
est le modèle intermédiaire, supposant le nombre<br />
total d’espèces infini. (in Schulte et al., 2005)<br />
16<br />
La re<strong>la</strong>tion d’Arrhenius<br />
Arrhenius (1921) a établi le modèle <strong>de</strong> base,<br />
dit loi <strong>de</strong> puissance :
Représentée en logarithmes, <strong>la</strong> re<strong>la</strong>tion est<br />
une droite (Figure 10) :<br />
ln
<strong>Mesures</strong> <strong>de</strong> <strong>la</strong> <strong>biodiversité</strong><br />
d’observation Si cette condition est respectée,<br />
le nombre d’espèces suit <strong>la</strong> loi <strong>de</strong> puissance,<br />
et
<strong>Mesures</strong> <strong>de</strong> <strong>la</strong> <strong>biodiversité</strong><br />
d’observation Si cette condition est respectée,<br />
le nombre d’espèces suit <strong>la</strong> loi <strong>de</strong> puissance,<br />
et
<strong>Mesures</strong> <strong>de</strong> <strong>la</strong> <strong>biodiversité</strong><br />
certain nombre <strong>de</strong> communautés composant<br />
<strong>la</strong> métacommunauté (page 186). La SAR<br />
obtenue par simu<strong>la</strong>tion suit <strong>la</strong> loi <strong>de</strong> puissance<br />
d’Arrhenius. Grilli et al. (2012) développent<br />
un modèle <strong>de</strong> SAR va<strong>la</strong>ble à toutes<br />
les échelles. Ses hypothèses sont peu réalistes<br />
dans <strong>la</strong> zone A, mais il vali<strong>de</strong> <strong>la</strong> loi <strong>de</strong><br />
puissance analytiquement à l’échelle intermédiaire.<br />
La re<strong>la</strong>tion d’Arrhenius est donc systématiquement<br />
validée à l’échelle régionale<br />
(Figure 10). On remarquera que <strong>la</strong> distribution<br />
<strong>de</strong> Fisher, validée par Hubbel pour <strong>la</strong><br />
méta-communauté, n’est jamais observée<br />
dans <strong>la</strong> SAR à cause <strong>de</strong> l’agrégation spatiale<br />
: en augmentant <strong>la</strong> surface<br />
d’échantillonnage, <strong>de</strong> nouvelles communautés<br />
sont ajoutées progressivement, mais<br />
l’échantillonnage <strong>de</strong> toute <strong>la</strong> métacommunauté<br />
n’est jamais réalisé (sauf au<br />
point marquant le passage <strong>de</strong> <strong>la</strong> zone B à <strong>la</strong><br />
zone C).<br />
Enfin, quand l’échelle est encore plus<br />
gran<strong>de</strong>, le nombre d’espèces augmente à<br />
nouveau plus vite parce que d’autres métacommunautés<br />
sont intégrées.<br />
Influence <strong>de</strong> <strong>la</strong> structure<br />
spatiale<br />
Les modèles c<strong>la</strong>ssiques <strong>de</strong> courbes aireespèces<br />
supposent un tirage indépendant <strong>de</strong>s<br />
individus. Sur le terrain, par exemple en<br />
forêt, l’échantillonnage est continu : s’il<br />
existe une structure spatiale comme <strong>de</strong>s<br />
agrégats, <strong>la</strong> probabilité que l’arbre suivant<br />
soit d’une espèce donnée dépend <strong>de</strong> ses voisins,<br />
donc <strong>de</strong> l’arbre précé<strong>de</strong>nt. Intuitivement,<br />
on comprend bien que le nouvel<br />
arbre <strong>de</strong> <strong>la</strong> même espèce apporte moins<br />
d’information, ce qui revient à surestimer <strong>la</strong><br />
taille <strong>de</strong> l’échantillon ou sous-estimer <strong>la</strong><br />
richesse pour une taille d’échantillon fixée.<br />
Plotkin et al. (2000) traitent un problème un<br />
peu différent : connaissant le nombre total<br />
d’espèces dans les dispositifs <strong>de</strong> <strong>la</strong> Figure<br />
11, ils tracent <strong>la</strong> courbe aire-espèces théorique<br />
issue du modèle <strong>de</strong> Coleman (1981)<br />
qui considère simplement que <strong>la</strong> probabilité<br />
20<br />
<strong>de</strong> ne pas rencontrer une espèce suit une loi<br />
binomiale, les tirages étant indépendants. Ce<br />
modèle surestime <strong>la</strong>rgement <strong>la</strong> diversité<br />
pour les petites surfaces : <strong>la</strong> probabilité <strong>de</strong><br />
ne pas rencontrer une espèce agrégative est<br />
sous-estimée. Le biais diminue quand <strong>la</strong><br />
surface d’échantillonnage augmente, parce<br />
que <strong>la</strong> taille re<strong>la</strong>tive <strong>de</strong>s agrégats diminue.<br />
Les effets <strong>de</strong> l’agrégation peuvent donc être<br />
opposés selon <strong>la</strong> question posée. Dans tous<br />
les cas, il suffit <strong>de</strong> considérer qu’un agrégat<br />
surestime le nombre d’arbres <strong>de</strong> son espèce<br />
qui <strong>de</strong>vrait être pris en compte dans le cadre<br />
d’un modèle à tirages indépendants.<br />
Plotkin et al. (2000) proposent une métho<strong>de</strong><br />
permettant <strong>de</strong> prendre en compte <strong>la</strong> structure<br />
spatiale pour fournir <strong>de</strong>s modèles <strong>de</strong> courbes<br />
aire-espèces fiables, dans un cadre particulier<br />
où le nombre total d’espèces et leur<br />
structure spatiale sont connus. La métho<strong>de</strong><br />
nécessite une carte <strong>de</strong>s individus. Le semis<br />
<strong>de</strong> point est considéré comme le résultat<br />
d’un processus <strong>de</strong> Neyman-Scott (1958) :<br />
<strong>de</strong>s centres d’agrégats sont tirés <strong>de</strong> façon<br />
complètement aléatoire et les individus sont<br />
répartis autour <strong>de</strong>s centres selon une loi<br />
normale en <strong>de</strong>ux dimensions. Les paramètres<br />
du processus sont estimés à partir du<br />
semis <strong>de</strong> points, puis <strong>la</strong> courbe aire-espèces<br />
est obtenue par simu<strong>la</strong>tion du processus.<br />
Malheureusement, aucune métho<strong>de</strong> générale<br />
permettant <strong>de</strong> prendre en compte <strong>la</strong> structure<br />
spatiale n’est disponible.<br />
Taux <strong>de</strong> couverture<br />
Good (1953) définit le taux <strong>de</strong> couverture <strong>de</strong><br />
l’échantillonnage (sample coverage) comme<br />
<strong>la</strong> proportion <strong>de</strong>s espèces découvertes
i<strong>de</strong>ntique. Les estimateurs <strong>de</strong> <strong>la</strong> diversité<br />
développés plus loin reposent <strong>la</strong>rgement sur<br />
cette notion pour <strong>la</strong> correction du biais<br />
d’échantillonnage (<strong>la</strong> sous-estimation systématique<br />
<strong>de</strong> <strong>la</strong> diversité due aux espèces<br />
non observées).<br />
L’estimateur du taux <strong>de</strong> couverture, que<br />
Good attribue à Turing, est :
<strong>Mesures</strong> <strong>de</strong> <strong>la</strong> <strong>biodiversité</strong><br />
rapi<strong>de</strong>ment très faible quand
L’estimateur ACE<br />
Chao et Lee (1992) développent l’estimateur<br />
ACE (Abundance-based coverage estimator)<br />
à travers l’estimation du taux <strong>de</strong> couverture
<strong>Mesures</strong> <strong>de</strong> <strong>la</strong> <strong>biodiversité</strong><br />
estimateR() est basé sur les abondances <strong>de</strong>s<br />
espèces et retourne un estimateur <strong>de</strong> <strong>la</strong> richesse<br />
spécifique par site et non global<br />
comme specpool.<br />
Exemple :<br />
On utilise les données <strong>de</strong> Barro Colorado<br />
Is<strong>la</strong>nd (BCI). La parcelle a été divisée en<br />
carrés <strong>de</strong> 1ha. Le tableau d’entrée est un<br />
dataframe contenant, pour chaque espèce<br />
d’arbres (DBH ≥ 10 cm), ses effectifs par<br />
carré.<br />
On charge le tableau <strong>de</strong> données :<br />
> library(vegan)<br />
> data(BCI)<br />
On utilise <strong>la</strong> fonction estimateR pour calculer<br />
<strong>la</strong> richesse <strong>de</strong>s 2 premiers carrés :<br />
> estimateR(BCI[1:2,])<br />
1 2<br />
S.obs 93.000000 84.000000<br />
S.chao1 117.473684 117.214286<br />
se.chao1 12.578970 17.841763<br />
S.ACE 122.848959 117.317307<br />
se.ACE 5.736054 5.571998<br />
Le package SPECIES (Wang, 2011) permet<br />
<strong>de</strong> calculer les estimateurs jackknife d’ordre<br />
supérieur à 2 et surtout choisit l’ordre qui<br />
fournit le meilleur compromis entre biais et<br />
variance.<br />
Comparaison <strong>de</strong>s fonctions sur l’ensemble<br />
≥1 1<br />
du dispositif BCI (
Il reste à évaluer les différentes valeurs <strong>de</strong>
<strong>Mesures</strong> <strong>de</strong> <strong>la</strong> <strong>biodiversité</strong><br />
Sprime(x)<br />
0 1 2 3 4 5 6 7<br />
Figure 17 : Nombres <strong>de</strong> nouvelles espèces découvertes<br />
en fonction <strong>de</strong> l’effort d’échantillonnage<br />
supplémentaire (données <strong>de</strong> BCI). Seulement 7<br />
nouvelles espèces seront observées en échantillonnant<br />
10000 arbres supplémentaires (environ 25 ha<br />
en plus <strong>de</strong>s 50 ha <strong>de</strong> <strong>la</strong> parcelle qui contiennent<br />
225 espèces).<br />
Shen et al. (2003) proposent un estimateur<br />
et le confrontent avec succès à <strong>de</strong>s estimateurs<br />
antérieurs. On note
Maximum <strong>de</strong> vraisemb<strong>la</strong>nce<br />
d’une distribution <strong>de</strong> Fisher<br />
Norris et Pollock (1998) supposent que <strong>la</strong><br />
distribution <strong>de</strong>s espèces suit le modèle <strong>de</strong><br />
Fisher (voir page 14) et infèrent le nombre<br />
d’espèces par maximum <strong>de</strong> vraisemb<strong>la</strong>nce<br />
non paramétrique (ils ne cherchent pas à<br />
inférer les paramètres <strong>de</strong> <strong>la</strong> loi <strong>de</strong> probabilité<br />
<strong>de</strong>
<strong>Mesures</strong> <strong>de</strong> <strong>la</strong> <strong>biodiversité</strong><br />
L’estimation empirique du modèle <strong>de</strong> Michaelis-Menten<br />
peut être faite avec R 5 . Les<br />
50 carrés <strong>de</strong> BCI sont utilisés pour fabriquer<br />
une courbe d’accumu<strong>la</strong>tion :<br />
> data(BCI)<br />
> # Cumul du nombre d’arbres<br />
> nArbres # Cumul <strong>de</strong> l’inventaire<br />
> Cumul # Nombre d’espèces cumulées<br />
> nEspeces 0]))<br />
> plot(nArbres, nEspeces)<br />
nEspeces<br />
100 120 140 160 180 200 220<br />
Le modèle est ajusté par nlsfit. Des valeurs<br />
<strong>de</strong> départ doivent être fournies pour
prolongée jusqu’au rang 6 pour obtenir le<br />
nombre d’espèces. Une façon alternative <strong>de</strong><br />
décrire <strong>la</strong> métho<strong>de</strong> est <strong>de</strong> dire que le nombre<br />
<strong>de</strong> taxons du niveau
<strong>Mesures</strong> <strong>de</strong> <strong>la</strong> <strong>biodiversité</strong><br />
son » :
On peut maintenant écrire le logarithme <strong>de</strong>
<strong>Mesures</strong> <strong>de</strong> <strong>la</strong> <strong>biodiversité</strong>
−
<strong>Mesures</strong> <strong>de</strong> <strong>la</strong> <strong>biodiversité</strong><br />
I(p)<br />
0 2 4 6 8 10<br />
Figure 21 : Fonctions d’information utilisées dans<br />
le nombre d’espèces (trait plein), l’indice <strong>de</strong><br />
Shannon (pointillés longs) et l’indice <strong>de</strong> Simpson<br />
(pointillés). L’information apportée par<br />
l’observation d’espèces rares décroît du nombre<br />
d’espèces à l’indice <strong>de</strong> Simpson.<br />
La quantité d’information attendue <strong>de</strong><br />
l’expérience est ∑
● L’entropie généralisée (Maasoumi, 1993),<br />
d’ordre
<strong>Mesures</strong> <strong>de</strong> <strong>la</strong> <strong>biodiversité</strong><br />
notamment par Daróczy (1970), d’où son<br />
nom « entropie HCDT » (voir Men<strong>de</strong>s et al.,<br />
2008, page 451 pour un historique complet)<br />
:<br />
36
<strong>Mesures</strong> <strong>de</strong> <strong>la</strong> <strong>biodiversité</strong><br />
notamment par Daróczy (1970), d’où son<br />
nom « entropie HCDT » (voir Men<strong>de</strong>s et al.,<br />
2008, page 451 pour un historique complet)<br />
:<br />
36
<strong>Mesures</strong> <strong>de</strong> <strong>la</strong> <strong>biodiversité</strong><br />
qui est <strong>la</strong> proportion <strong>de</strong> <strong>la</strong> communauté<br />
représentée par l’espèce <strong>la</strong> plus abondante<br />
:
Profils <strong>de</strong> diversité<br />
Diversité<br />
50 100 150 200<br />
Figure 23 : Profil <strong>de</strong> diversité 10 calculé pour BCI.<br />
La correction du biais d’échantillonnage est <strong>la</strong><br />
plus gran<strong>de</strong> <strong>de</strong> Chao-Shen et Grassberger.<br />
Leinster et Cobbold (2011), après Patil et<br />
Taillie (1982), Tothmeresz (1995) et Kindt<br />
et al. (2006), recomman<strong>de</strong>nt <strong>de</strong> tracer <strong>de</strong>s<br />
profils <strong>de</strong> diversité, c'est-à-dire <strong>la</strong> valeur <strong>de</strong>
<strong>Mesures</strong> <strong>de</strong> <strong>la</strong> <strong>biodiversité</strong><br />
Le calcul <strong>de</strong> <strong>la</strong> diversité <strong>de</strong> Hurlbert est possible<br />
avec le logiciel BiodivR 11 (Hardy,<br />
2010).<br />
Équitabilité<br />
La régu<strong>la</strong>rité d’une distribution est une notion<br />
intuitivement assez simple : <strong>la</strong> faiblesse<br />
<strong>de</strong> l’écart entre <strong>la</strong> distribution réelle et une<br />
distribution parfaitement régulière, vérifiant
(Gini, 1912 ; Ceriani et Verme, 2012). Une<br />
mesure d’équitabilité compatible doit être<br />
plus gran<strong>de</strong> pour une communauté si sa<br />
courbe <strong>de</strong> Lorenz est plus proche <strong>de</strong> <strong>la</strong> bissectrice.<br />
Si les courbes <strong>de</strong> <strong>de</strong>ux communautés<br />
se croisent, l’ordre <strong>de</strong> leurs équitabilités<br />
est imprévisible.<br />
L’indice <strong>de</strong> Pielou est le plus utilisé dans <strong>la</strong><br />
littérature (Tuomisto, 2012) mais n’est pas<br />
<strong>Mesures</strong> neutres <strong>de</strong> <strong>la</strong> diversité
DIVERSITÉ
<strong>Mesures</strong> <strong>de</strong> <strong>la</strong> <strong>biodiversité</strong><br />
● Une définition <strong>de</strong> <strong>la</strong> diversité
<strong>de</strong> diversités dérivées <strong>de</strong> l’entropie généralisée<br />
<strong>de</strong> Tsallis.<br />
Décomposition multiplicative<br />
<strong>de</strong> <strong>la</strong> diversité<br />
Jost (2007) et Chao et al. (2012) ont montré<br />
que <strong>la</strong> décomposition <strong>de</strong>s nombres <strong>de</strong> Hill<br />
en éléments indépendants est multiplicative :
<strong>Mesures</strong> <strong>de</strong> <strong>la</strong> <strong>biodiversité</strong><br />
Indice Distribution observée Distribution attendue Formule
nulle, c'est-à-dire que les fréquences varient<br />
moins que dans le tirage d’une loi multinomiale,<br />
si <strong>de</strong>ux communautés ont été créées<br />
artificiellement avec le même nombre<br />
d’individus <strong>de</strong> chaque espèce par exemple.<br />
Lorsque les données sont issues <strong>de</strong> communautés<br />
réelles, le sens même <strong>de</strong> ce type <strong>de</strong><br />
test est remis en question (Jones et Matloff,<br />
1986) : les communautés réelles ne pouvant<br />
pas être exactement i<strong>de</strong>ntiques, il suffit<br />
d’augmenter <strong>la</strong> taille <strong>de</strong> l’échantillonnage<br />
pour prouver leur différence.<br />
Intervalle <strong>de</strong> confiance <strong>de</strong>
<strong>Mesures</strong> <strong>de</strong> <strong>la</strong> <strong>biodiversité</strong>
Shannon<br />
Entropie généralisée<br />
Indice Entropie Diversité<br />
Calcul sous R : Les fonctions AlphaEntropy.MC,<br />
BetaEntropy.MC, GammaEntropy.MC<br />
et AlphaDiversity.MC, BetaDiversity.MC,<br />
GammaDiversity.MC permettent <strong>de</strong><br />
calculer les entropies et diversités. DivPart<br />
calcule tout en même temps :<br />
> DivPart(q = 1, Paracou618.MC,<br />
Biased = FALSE)<br />
$TotalAlphaDiversity<br />
[1] 91.70413<br />
$TotalBetaDiversity<br />
[1] 1.464258<br />
$GammaDiversity<br />
[1] 134.2786<br />
$CommunityAlphaDiversities<br />
P006 P018<br />
81.6996 107.0175<br />
$TotalAlphaEntropy<br />
[1] 4.518567<br />
$TotalBetaEntropy<br />
[1] 0.3813489<br />
$GammaEntropy<br />
[1] 4.899916<br />
$CommunityAlphaEntropies<br />
P006 P018<br />
4.403049 4.672992<br />
1
<strong>Mesures</strong> <strong>de</strong> <strong>la</strong> <strong>biodiversité</strong><br />
Décomposition <strong>de</strong><br />
l’indice <strong>de</strong> Gini-<br />
Simpson<br />
L’entropie <strong>de</strong> Simpson peut aussi être décomposée<br />
comme une variance. La probabilité<br />
qu’un individu appartienne à l’espèce
L’entropie <strong>de</strong> Simpson peut être décomposée<br />
<strong>de</strong> <strong>de</strong>ux façons : comme une variance<br />
quand les poids <strong>de</strong>s communautés sont donnés<br />
par leurs effectifs, ou selon le cas général.<br />
Les <strong>de</strong>ux décompositions produisent les<br />
mêmes valeurs d’entropie
<strong>Mesures</strong> <strong>de</strong> <strong>la</strong> <strong>biodiversité</strong><br />
∑ (
DIVERSITÉ FONCTIONNELLE ET<br />
Les mesures neutres <strong>de</strong> <strong>la</strong> diversité considèrent<br />
que toutes les c<strong>la</strong>sses auxquelles les<br />
objets appartiennent sont différentes, sans<br />
que certaines soient plus différentes que<br />
d’autres. Par exemple, toutes les espèces<br />
sont équidistantes les unes <strong>de</strong>s autres,<br />
qu’elles appartiennent au même genre ou à<br />
<strong>de</strong>s familles différentes. Intuitivement,<br />
l’idée qu’une communauté <strong>de</strong>
<strong>Mesures</strong> <strong>de</strong> <strong>la</strong> <strong>biodiversité</strong><br />
<strong>de</strong>s branches d’un <strong>de</strong>ndrogramme (arbre)<br />
résultant d’une c<strong>la</strong>ssification hiérarchique<br />
sont ultramétriques.<br />
La façon exacte <strong>de</strong> mesurer les longueur <strong>de</strong><br />
branche est illustré par <strong>la</strong> Figure 26, page<br />
56 : <strong>la</strong> distance entre les espèces 1 et 2 est
Équivalence <strong>de</strong>s <strong>de</strong>ux diversités<br />
L’approche fonctionnelle étant particulièrement<br />
complexe et lour<strong>de</strong> à mettre en œuvre<br />
(notamment pour <strong>la</strong> mesure <strong>de</strong>s traits sur<br />
chaque individu), <strong>la</strong> tentation a été gran<strong>de</strong><br />
<strong>de</strong> considérer que <strong>la</strong> phylogénie contenait<br />
plus d’information fonctionnelle que ce qui<br />
pouvait être mesuré, et donc <strong>de</strong> considérer <strong>la</strong><br />
diversité phylogénétique comme proxy <strong>de</strong> <strong>la</strong><br />
diversité fonctionnelle.<br />
Webb (2000) a montré que <strong>de</strong>s communautés<br />
d’arbres tropicaux avaient une moins<br />
gran<strong>de</strong> diversité phylogénétique locale<br />
qu’attendue sous l’hypothèse nulle d’une<br />
distribution aléatoire <strong>de</strong>s espèces, et a supposé<br />
que <strong>la</strong> cause en était le filtrage environnemental<br />
local, agissant sur les traits et<br />
observables par <strong>la</strong> phylogénie, sous<br />
l’hypothèse <strong>de</strong> conservation phylogénétique<br />
<strong>de</strong>s traits fonctionnels. La discipline appelée<br />
écologie phylogénétique <strong>de</strong>s communautés<br />
cherche encore à comprendre quels traits<br />
sont conservés et lesquels sont convergents<br />
(Caven<strong>de</strong>r-Bares et al., 2009).<br />
Swenson et Enquist (2009) ont montré que<br />
<strong>la</strong> re<strong>la</strong>tion entre les <strong>de</strong>ux diversités était<br />
faible. L’utilisation <strong>de</strong> <strong>la</strong> diversité phylogénétique<br />
comme proxy <strong>de</strong> <strong>la</strong> diversité fonctionnelle<br />
est maintenant déconseillée<br />
Diversité fonctionnelle et phylogénétique<br />
(Pavoine et Bonsall, 2011).<br />
Typologie <strong>de</strong>s mesures<br />
À partir <strong>de</strong> <strong>la</strong> littérature (Ricotta, 2007 ;<br />
Pavoine et Bonsall, 2011), une typologie <strong>de</strong>s<br />
mesures <strong>de</strong> diversité émerge. Elle étend les<br />
notions c<strong>la</strong>ssiques <strong>de</strong> richesse et équitabilité.<br />
La richesse est l’accumu<strong>la</strong>tion <strong>de</strong> c<strong>la</strong>sses<br />
différentes dans les mesures c<strong>la</strong>ssiques.<br />
Dans un arbre phylogénétique, <strong>la</strong> longueur<br />
<strong>de</strong>s branches représente un temps<br />
d’évolution : <strong>la</strong> richesse en est <strong>la</strong> somme.<br />
FD, et PD sont <strong>de</strong>s mesures <strong>de</strong> richesse.<br />
La régu<strong>la</strong>rité est une notion plus complexe<br />
(Figure 25). Elle mesure <strong>la</strong> façon dont les<br />
espèces occupent uniformément l’espace <strong>de</strong>s<br />
niches (Pavoine et Bonsall, 2011). Cette<br />
notion est simple dans un espace multidimensionnel<br />
(par exemple, l’espace <strong>de</strong>s traits<br />
fonctionnels). Dans un arbre phylogénétique,<br />
<strong>la</strong> régu<strong>la</strong>rité <strong>de</strong> l’arbre est un premier<br />
critère, complété éventuellement par les<br />
abondances. Dans un arbre parfaitement<br />
régulier, <strong>la</strong> régu<strong>la</strong>rité se réduit à<br />
l’équitabilité.<br />
Les mesures <strong>de</strong> divergence sont <strong>de</strong>s fonctions<br />
croissantes <strong>de</strong> <strong>la</strong> dissimi<strong>la</strong>rité entre les<br />
espèces, généralement considérées par paire.<br />
Certaines sont pondérées par les abondances,<br />
d’autres non. Dans un arbre parfai-<br />
Figure 25 : Régu<strong>la</strong>rité contre irrégu<strong>la</strong>rité (Regu<strong>la</strong>rity vs. Skewness). Les arbres <strong>de</strong> A à D sont <strong>de</strong> plus en plus<br />
irréguliers. L’arbre A, parfaitement régulier, est le cadre <strong>de</strong>s mesures c<strong>la</strong>ssiques <strong>de</strong> <strong>la</strong> diversité. La phylogénie<br />
étant donnée, trois vecteurs d’abondance (P1 à P3) sont <strong>de</strong> moins en moins réguliers : dans les cas C et D, <strong>la</strong><br />
régu<strong>la</strong>rité maximale n’est pas obtenue pour <strong>de</strong>s effectifs i<strong>de</strong>ntiques, mais en augmentant les effectifs <strong>de</strong>s espèces<br />
originales (voir Maximum théorique, page 57). La figure est issue <strong>de</strong> Pavoine et Bonsall (2011, fig. 1)<br />
55
<strong>Mesures</strong> <strong>de</strong> <strong>la</strong> <strong>biodiversité</strong><br />
tement régulier, l’indice <strong>de</strong> Simpson est une<br />
mesure <strong>de</strong> divergence pondérée. Ces mesures<br />
sont influencées par <strong>la</strong> richesse et <strong>la</strong><br />
régu<strong>la</strong>rité.<br />
L’entropie phylogénétique permet d’unifier<br />
ces notions.<br />
Biais d’échantillonnage<br />
Les mesures <strong>de</strong> diversité fonctionnelle et<br />
phylogénétique sont sujettes aux biais<br />
d’échantillonnage, mais il n’existe pas <strong>de</strong><br />
technique <strong>de</strong> correction dans <strong>la</strong> littérature.<br />
Les mesures d’entropie phylogénétique peuvent<br />
être corrigées.<br />
FD et PD<br />
Les indices les plus simples sont <strong>la</strong> diversité<br />
phylogénétique (Faith, 1992) et sa transposition,<br />
<strong>la</strong> diversité fonctionnelle (Petchey et<br />
Gaston, 2002).<br />
Étant donné un arbre contenant toutes les<br />
espèces ou tous les individus étudiés, PD ou<br />
FD sont égaux à <strong>la</strong> somme <strong>de</strong> <strong>la</strong> longueur<br />
<strong>de</strong>s branches (Figure 26).<br />
Figure 26 : Mesure <strong>de</strong> <strong>la</strong> diversité fonctionnelle<br />
FD d’une communauté hypothétique <strong>de</strong> 7 espèces.<br />
FD est <strong>la</strong> somme <strong>de</strong>s longueurs <strong>de</strong>s branches<br />
(
● en fixant
<strong>Mesures</strong> <strong>de</strong> <strong>la</strong> <strong>biodiversité</strong><br />
> # ACP sur les traits foliaires<br />
> pcaf scatter(pcaf)<br />
58<br />
Figure 27 : ACP sur les traits foliaires<br />
pcaf est une liste qui contient les résultats <strong>de</strong><br />
l’ACP, à utiliser pour <strong>la</strong> c<strong>la</strong>ssification :<br />
Height<br />
> # CAH Ward <strong>de</strong>s traits foliaires<br />
> hf # Figure 28<br />
> plot(hf, h=-1)<br />
Me<br />
Me<br />
S1<br />
Ef<br />
Dg<br />
Vm<br />
Am<br />
Gm<br />
N<br />
Cluster Dendrogram<br />
Bg<br />
Ef<br />
dist(pcaf$tab)<br />
hclust (*, "ward")<br />
SLA<br />
Vm<br />
Dg<br />
Bg<br />
d =<br />
Le résultat <strong>de</strong> <strong>la</strong> c<strong>la</strong>ssification est un objet<br />
hclust qui doit être transformé en phylog<br />
pour <strong>la</strong> suite <strong>de</strong> l’analyse :<br />
> # Transformation <strong>de</strong> l'arbre du<br />
format hclust au format phylog<br />
> phyf # Affichage avec poids <strong>de</strong>s<br />
variables, Figure 29.<br />
> table.phylog(pcaf$tab[names<br />
(phyf$leaves),], phyf)<br />
-1.5 -0.5 0.5 1.5 2.5<br />
Figure 29 : C<strong>la</strong>ssification automatique <strong>de</strong>s espèces,<br />
représentée par table.phylog<br />
La limite <strong>de</strong>s distances ultramétriques est<br />
leur tendance à déformer le jeu <strong>de</strong> points.<br />
Dans cet exemple, les <strong>de</strong>ux premiers axes <strong>de</strong><br />
l’ACP ren<strong>de</strong>nt compte <strong>de</strong> presque toute<br />
l’inertie. Le nuage <strong>de</strong> points est pratiquement<br />
contenu dans un p<strong>la</strong>n alors que sa représentation<br />
en distance ultramétrique est<br />
une hypersphère en 7 dimensions (voir<br />
Pavoine et al., 2005b).<br />
Le calcul <strong>de</strong> l’originalité <strong>de</strong>s espèces utilise<br />
<strong>la</strong> fonction originality :<br />
> dotchart.phylog(phyf,<br />
originality(phyf, 5))<br />
La fonction a pour paramètres l’objet phylog<br />
contenant <strong>la</strong> c<strong>la</strong>ssification et le numéro <strong>de</strong> <strong>la</strong><br />
métho<strong>de</strong> <strong>de</strong> calcul à utiliser, 5 pour<br />
l’entropie quadratique. Sa représentation<br />
graphique est faite par dotchart.phylog :<br />
SLA<br />
Am<br />
Gm<br />
N<br />
CvsN<br />
Thick<br />
Sr<br />
Ess<br />
Me<br />
S1<br />
Bg<br />
Ef<br />
Vm<br />
Dg
Figure 30 : Originalité <strong>de</strong>s espèces<br />
L’originalité (Figure 30) ne repose que sur<br />
l’arbre, pas sur <strong>la</strong> fréquence <strong>de</strong>s espèces.<br />
Si <strong>la</strong> distance utilisée n’est pas ultramétrique,<br />
il existe plusieurs distributions possibles<br />
d’espèces qui maximisent <strong>la</strong> diversité<br />
(Pavoine et Bonsall, 2009), le concept<br />
d’originalité n’a pas <strong>de</strong> sens dans ce cas.<br />
Décomposition<br />
La diversité <strong>de</strong> <strong>la</strong> méta-communauté, peut<br />
être décomposée en une somme (pondérée)<br />
<strong>de</strong> diversités intra et une diversité inter<br />
(Pavoine et al., 2004) en définissant une<br />
dissimi<strong>la</strong>rité entre les communautés
<strong>Mesures</strong> <strong>de</strong> <strong>la</strong> <strong>biodiversité</strong><br />
● La variabilité inter-communautés peut<br />
être calculée par divc en utilisant <strong>la</strong> distance<br />
fournie par disc, en définissant <strong>la</strong><br />
matrice <strong>de</strong>s poids (égale aux effectifs) :<br />
> divc(as.data.frame<br />
(colSums(effectifs)),<br />
disc(effectifs[names(phyf$leaves),]<br />
, phyf$Wdist))<br />
diversity<br />
colSums(effectifs) 0.2362187<br />
La fonction disc calcule 2
Le calcul sous R est simple avec un arbre au<br />
format phylog d’ADE4 :<br />
> Tree (FAD (MFAD
<strong>Mesures</strong> <strong>de</strong> <strong>la</strong> <strong>biodiversité</strong><br />
L’indice
sur les feuilles liées à <strong>la</strong> branche. Figure 31,<br />
l’arbre possè<strong>de</strong> 9 branches dont les probabilités<br />
sont notées en <strong>de</strong>ssous <strong>de</strong> leur nœud<br />
basal.<br />
Attention : les entropies ont un comportement<br />
linéaire : elles s’additionnent tout au
<strong>Mesures</strong> <strong>de</strong> <strong>la</strong> <strong>biodiversité</strong><br />
diversity<br />
$CommunityAlphaEntropies<br />
P006 P018<br />
3.616882 3.937894<br />
0.0 0.5 1.0 1.5 2.0<br />
Figure 33 : Représentation graphique <strong>de</strong> <strong>la</strong> diversité<br />
<strong>de</strong>s <strong>de</strong>ux parcelles du jeu <strong>de</strong> données Paracou618.<br />
Les rectangles transparents représentent<br />
<strong>la</strong> diversité neutre, les rectangles hachurés <strong>la</strong> diversité<br />
phylogénétique (l’arbre est <strong>la</strong> taxonomie<br />
<strong>de</strong>s espèces,
non ultramétrique dans le cas particulier <strong>de</strong><br />
l’entropie <strong>de</strong> Rao.<br />
Dans l’état actuel <strong>de</strong>s connaissances, aucune<br />
métho<strong>de</strong> n’est applicable <strong>de</strong> façon satisfaisante<br />
aux arbres non ultramétriques.<br />
Régu<strong>la</strong>rité<br />
L’indice Λ + (C<strong>la</strong>rke et Warwick, 2001) mesure<br />
<strong>la</strong> variance <strong>de</strong>s distances entre paires<br />
d’espèces :<br />
Diversité fonctionnelle et phylogénétique<br />
Λ + = ∑ ∑
La <strong>biodiversité</strong> peut être mesurée <strong>de</strong> façon<br />
c<strong>la</strong>ire et rigoureuse en utilisant l’entropie<br />
phylogénétique.<br />
Diversité phylogénétique<br />
Entropie<br />
phylogénétique<br />
PD / FD<br />
I 1 / H p<br />
Rao<br />
q quelconque q =0, 1 ou 2<br />
Entropie <strong>de</strong><br />
Tsallis<br />
Diversité neutre<br />
Richesse<br />
Shannon<br />
Simpson<br />
Figure 35 : Arbre phylogénétique hypothétique<br />
non ultramétrique (Chao et al., 2010, figure 1b).<br />
Cette mesure généralise les indices <strong>de</strong> diversité<br />
c<strong>la</strong>ssique (Figure 35), traduit c<strong>la</strong>irement<br />
<strong>la</strong> correspondance entre l’entropie et <strong>la</strong> diversité<br />
au sens strict, intègre si nécessaire <strong>la</strong><br />
distance entre espèces, peut être décomposée<br />
et corrigée <strong>de</strong>s biais d’estimation. Sa<br />
CONCLUSION<br />
transformation en diversité au sens strict<br />
permet d’interpréter les valeurs sous une<br />
forme unique : un nombre équivalent<br />
d’espèces et un nombre équivalent <strong>de</strong> communautés.<br />
Le package entropart permet <strong>de</strong> calculer<br />
avec R <strong>la</strong> diversité d’une méta-communauté<br />
à partir <strong>de</strong> données d’abondances et d’un<br />
arbre phylogénétique ou fonctionnel.<br />
D’autres mesures <strong>de</strong> diversité ont été présentées<br />
ici, d’autres encore peuvent être<br />
trouvées dans <strong>la</strong> littérature. Elles ont en général<br />
un moins bon support mathématique,<br />
surtout les mesures <strong>de</strong> diversité
BIBLIOGRAPHIE<br />
A<strong>de</strong>lman, M. A. (1969). Comment on the "H" Concentration Measure as a Numbers-Equivalent.<br />
The Review of Economics and Statistics 51(1): 99-101.<br />
Allen, B., Kon, M. et Bar-Yam, Y. (2009). A New Phylogenetic Diversity Measure<br />
Generalizing the Shannon In<strong>de</strong>x and Its Application to Phyllostomid Bats. American<br />
Naturalist 174(2): 236-243.<br />
Alonso, D. et McKane, A. J. (2004). Sampling Hubbell's neutral theory of biodiversity. Ecology<br />
Letters 7(10): 901-910.<br />
Arrhenius, O. (1921). Species and Area. Journal of Ecology 9(1): 95–99.<br />
Baraloto, C., Paine, C. E. T., Poorter, L., Beauchene, J., Bonal, D., Domenach, A. M.,<br />
Herault, B., Patino, S., Roggy, J. C. et Chave, J. (2010a). Decoupled leaf and stem<br />
economics in rain forest trees. Ecology Letters 13(11): 1338-1347.<br />
Baraloto, C., Paine, C. E. T. P., Patiño, S., Bonal, D., Hérault, B. et Chave, J. (2010b).<br />
Functional trait variation and sampling strategies in species rich p<strong>la</strong>nt communities.<br />
Functional Ecology 24: 208-216.<br />
Baselga, A. (2010). Multiplicative partition of true diversity yields in<strong>de</strong>pen<strong>de</strong>nt alpha and beta<br />
components; additive partition does not. Ecology 91(7): 1974-1981.<br />
Basharin, G. P. (1959). On a Statistical Estimate for the Entropy of a Sequence of In<strong>de</strong>pen<strong>de</strong>nt<br />
Random Variables. Theory of Probability and its Applications 4(3): 333-336.<br />
Beck, J. et Schwanghart, W. (2010). Comparing measures of species diversity from incomplete<br />
inventories: an update. Methods in Ecology and Evolution 1(1): 38-44.<br />
Berger, W. H. et Parker, F. L. (1970). Diversity of p<strong>la</strong>nktonic foraminifera in <strong>de</strong>ep-sea<br />
sediments. Science 168(3937): 1345-1347.<br />
Bonache<strong>la</strong>, J. A., Hinrichsen, H. et Muñoz, M. A. (2008). Entropy estimates of small data sets.<br />
Journal of Physics A: Mathematical and Theoretical 41(202001): 1-9.<br />
Bor<strong>de</strong>nave, B. G. et De Granville, J. J. (1998). Les mesures <strong>de</strong> <strong>la</strong> <strong>biodiversité</strong> : un outil <strong>de</strong><br />
conservation en forêt guyanaise. JATBA, Revue d'Ethnobiologie 40(1-2): 433-446.<br />
Bor<strong>de</strong>nave, B. G., De Granville, J. J. et Steyn, K. (2011). Quantitative botanical diversity<br />
<strong>de</strong>scriptors to set conservation priorities in Bakhuis Mountains rainforest, Suriname.<br />
Botanical Journal of the Linnean Society 167(1): 94-130.<br />
Bor<strong>la</strong>nd, L., P<strong>la</strong>stino, A. R. et Tsallis, C. (1998). Information gain within nonextensive<br />
thermostatistics. Journal of Mathematical Physics 39(12): 6490-6501.<br />
Bourguignon, F. (1979). Decomposable Income Inequality Measures. Econometrica 47(4): 901-<br />
920.<br />
Braun-B<strong>la</strong>nquet, J. (1928). Pf<strong>la</strong>nzensoziologie: Grundzüge <strong>de</strong>r Vegetationskun<strong>de</strong>. Springer,<br />
Berlin<br />
Brillouin, L. (1962). Science and information theory. Aca<strong>de</strong>mic Press, Oxford<br />
Brose, U., Martinez, N. D. et Williams, R. J. (2003). Estimating species richness: Sensitivity to<br />
sample coverage and insensitivity to spatial patterns. Ecology 84(9): 2364-2377.<br />
69
<strong>Mesures</strong> <strong>de</strong> <strong>la</strong> <strong>biodiversité</strong><br />
Bulmer, M. G. (1974). On Fitting the Poisson Lognormal Distribution to Species-Abundance<br />
Data. Biometrics 30(1): 101-110.<br />
Burnham, K. P. et Overton, W. S. (1979). Robust Estimation of Popu<strong>la</strong>tion Size When Capture<br />
Probabilities Vary Among Animals. Ecology 60(5): 927–936.<br />
Cadotte, M. W., Davies, T. J., Regetz, J., Kembel, S. W., Cle<strong>la</strong>nd, E. et Oakley, T. H.<br />
(2010). Phylogenetic diversity metrics for ecological communities: integrating species<br />
richness, abundance and evolutionary history. Ecology Letters 13(1): 96-105.<br />
Cailliez, F. (1983). The analytical solution of the additive constant problem. Psychometrika 48:<br />
305-310.<br />
Caven<strong>de</strong>r-Bares, J., Kozak, K. H., Fine, P. V. A. et Kembel, S. W. (2009). The merging of<br />
community ecology and phylogenetic biology. Ecology Letters 12(7): 693-715.<br />
Ceriani, L. et Verme, P. (2012). The origins of the Gini in<strong>de</strong>x: extracts from Variabilità e<br />
Mutabilità (1912) by Corrado Gini. Journal of Economic Inequality 10(3): 421-443.<br />
Chao, A. (1984). Nonparametric estimation of the number of c<strong>la</strong>sses in a popu<strong>la</strong>tion.<br />
Scandinavian Journal of Statistics 11: 265-270.<br />
Chao, A. (1987). Estimating the popu<strong>la</strong>tion size for capture-recapture data with unequal<br />
catchability. Biometrics 43(4): 783-791.<br />
Chao, A. (2004). Species richness estimation. in N. Ba<strong>la</strong>krishnan, C. B. Read et B. Vidakovic,<br />
(Eds), Encyclopedia of Statistical Sciences. Wiley, New York.<br />
Chao, A., Chiu, C.-H. et Hsieh, T. C. (2012). Proposing a resolution to <strong>de</strong>bates on diversity<br />
partitioning. Ecology 93(9): 2037-2051.<br />
Chao, A., Chiu, C.-H. et Jost, L. (2010). Phylogenetic diversity measures based on Hill<br />
numbers. Philosophical Transactions of the Royal Society B 365(1558): 3599-609.<br />
Chao, A. et Jost, L. (2012). Coverage-based rarefaction and extrapo<strong>la</strong>tion: standardizing<br />
samples by completeness rather than size. Ecology 93(12): 2533-2547.<br />
Chao, A., Jost, L., Chiang, S. C., Jiang, Y. H. et Chazdon, R. L. (2008). A Two-Stage<br />
Probabilistic Approach to Multiple-Community Simi<strong>la</strong>rity Indices. Biometrics 64(4): 1178-<br />
1186.<br />
Chao, A. et Lee, S.-M. (1992). Estimating the Number of C<strong>la</strong>sses Via Sample Coverage.<br />
Journal of the American Statistical Association 87(417): 210-217.<br />
Chao, A. et Shen, T.-J. (2010). Program SPADE: Species Prediction And Diversity Estimation.<br />
Program and user’s gui<strong>de</strong>. CARE. http://chao.stat.nthu.edu.tw/softwareCE.html.<br />
Chao, A. et Shen, T. J. (2003). Nonparametric estimation of Shannon's in<strong>de</strong>x of diversity when<br />
there are unseen species in sample. Environmental and Ecological Statistics 10(4): 429-<br />
443.<br />
Chapin, F. S., Zavaleta, E. S., Eviner, V. T., Naylor, R. L., Vitousek, P. M., Reynolds, H. L.,<br />
Hooper, D. U., Lavorel, S., Sa<strong>la</strong>, O. E., Hobbie, S. E., Mack, M. C. et Diaz, S. (2000).<br />
Consequences of changing biodiversity. Nature 405(6783): 234-242.<br />
Chytrý, M. et Otýpková, Z. (2003). Plot sizes used for phytosociological sampling of European<br />
vegetation. Journal of Vegetation Science 14(4): 563-570.<br />
C<strong>la</strong>rke, K. R. et Warwick, R. M. (2001). A further biodiversity in<strong>de</strong>x applicable to species<br />
lists: variation in taxonomic distinctness. Marine Ecology-Progress Series 216: 265-278.<br />
70
Bibliographie<br />
Clench, H. K. (1979). How to make regional lists of butterflies: some thoughts. Journal of the<br />
Lepidopterists' Society 33(4): 216-231.<br />
Coleman, B. D. (1981). On random p<strong>la</strong>cement and species-area re<strong>la</strong>tions. Mathematical<br />
Biosciences 54(3-4): 191-215.<br />
Conceição, P. et Ferreira, P. (2000). The Young Person’s Gui<strong>de</strong> to the Theil In<strong>de</strong>x: Suggesting<br />
Intuitive Interpretations and Exploring Analytical Applications. UTIP Working Paper, 14,<br />
Austin, Texas: 54 p.<br />
Condit, R., Hubbell, S. P., Lafrankie, J. V., Sukumar, R., Manokaran, N., Foster, R. B. et<br />
Ashton, P. S. (1996). Species-Area and Species-Individual Re<strong>la</strong>tionships for Tropical<br />
Trees: A Comparison of Three 50-ha Plots. Journal of Ecology 84(4): 549-562.<br />
Connor, E. F. et McCoy, E. D. (1979). The Statistics and Biology of the Species-Area<br />
Re<strong>la</strong>tionship. The American Naturalist 113(6): 791-833.<br />
Cornelissen, J. H. C., Lavorel, S., Garnier, E., Diaz, S., Buchmann, N., Gurvich, D. E.,<br />
Reich, P. B., Steege, H. t., Morgan, H. D., Heij<strong>de</strong>n, M. G. A. v. d., Pausas, J. G. et<br />
Poorter, H. (2003). A handbook of protocols for standardised and easy measurement of<br />
p<strong>la</strong>nt functional traits worldwi<strong>de</strong>. Australian Journal of Botany 51(4): 335-380.<br />
Cousins, S. H. (1991). Species diversity measurement: Choosing the right in<strong>de</strong>x. Trends in<br />
Ecology and Evolution 6(6): 190-192.<br />
Couteron, P. et Pélissier, R. (2004). Additive apportioning of species diversity: towards more<br />
sophisticated mo<strong>de</strong>ls and analyses. Oikos 107(1): 215-221.<br />
Crist, T. O., Veech, J. A., Gering, J. C. et Summerville, K. S. (2003). Partitioning species<br />
diversity across <strong>la</strong>ndscapes and regions: A hierarchical analysis of alpha, beta, and gamma<br />
diversity. The American Naturalist 162(6): 734-743.<br />
Dalton, H. (1920). The measurement of the inequality of incomes. The Economic Journal<br />
30(119): 348-361.<br />
Daróczy, Z. (1970). Generalized information functions. Information and Control 16(1): 36-51.<br />
Dauby, G. et Hardy, O. J. (2012). Sampled-based estimation of diversity sensu stricto by<br />
transforming Hurlbert diversities into effective number of species. Ecography 35(7): 661-<br />
672.<br />
Davis, H. T. (1941). The theory of econometrics. The Principia Press, Bloomington, Indiana<br />
Drakare, S., Lennon, J. J. et Hillebrand, H. (2006). The imprint of the geographical,<br />
evolutionary and ecological context on species–area re<strong>la</strong>tionships. Ecology Letters 9(2):<br />
215-227.<br />
Ellison, A. M. (2010). Partitioning diversity. Ecology 91(7): 1962-1963.<br />
Eren, M. I., Chao, A., Hwang, W. H. et Colwell, R. K. (2012). Estimating the Richness of a<br />
Popu<strong>la</strong>tion When the Maximum Number of C<strong>la</strong>sses Is Fixed: A Nonparametric Solution to<br />
an Archaeological Problem. PLoS One 7(5).<br />
Esty, W. W. (1983). A Normal Limit Law for a Nonparametric Estimator of the Coverage of a<br />
Random Sample. The Annals of Statistics 11(3): 905-912.<br />
Faith, D. P. (1992). Conservation evaluation and phylogenetic diversity. Biological<br />
Conservation 61(1): 1-10.<br />
71
<strong>Mesures</strong> <strong>de</strong> <strong>la</strong> <strong>biodiversité</strong><br />
Fisher, R. A., Corbet, A. S. et Williams, C. B. (1943). The re<strong>la</strong>tion between the number of<br />
species and the number of individuals in a random sample of an animal popu<strong>la</strong>tion.<br />
Journal of Animal Ecology 12: 42-58.<br />
Gárcia Martín, H. et Gol<strong>de</strong>nfeld, N. (2006). On the origin and robustness of power-<strong>la</strong>w<br />
species-area re<strong>la</strong>tionships in ecology. Proceedings of the National Aca<strong>de</strong>my of Sciences<br />
103(27): 10310-10315.<br />
Gaston, K. J. (2000). Global patterns in biodiversity. Nature 405(6783): 220-227.<br />
Gini, C. (1912). Variabilità e mutabilità. Studi Economico-Giuridici <strong>de</strong>ll’Università di Cagliari,<br />
Università di Cagliari. 3: 1-158.<br />
Gleason, H. A. (1922). On the Re<strong>la</strong>tion Between Species and Area. Ecology 3(2): 158-162.<br />
Good, I. J. (1953). On the Popu<strong>la</strong>tion Frequency of Species and the Estimation of Popu<strong>la</strong>tion<br />
Parameters. Biometrika 40(3/4): 237-264.<br />
Gotelli, N. J. et Colwell, R. K. (2001). Quantifying biodiversity: procedures and pitfalls in the<br />
measurement and comparison of species richness. Ecology Letters 4(4): 379-391.<br />
Gower, J. C. (1971). A General Coefficient of Simi<strong>la</strong>rity and Some of Its Properties. Biometrics<br />
27(4): 857-871.<br />
Grassberger, P. (1988). Finite sample corrections to entropy and dimension estimates. Physics<br />
Letters A 128(6–7): 369-373.<br />
Grassberger, P. (2003). Entropy Estimates from Insufficient Samplings. ArXiv Physics e-prints<br />
0307138.<br />
Grilli, J., Azaele, S., Banavar, J. R. et Maritan, A. (2012). Spatial aggregation and the<br />
species–area re<strong>la</strong>tionship across scales. Journal of Theoretical Biology 313(0): 87-97.<br />
Guiasu, R. C. et Guiasu, S. (2011). The weighted quadratic in<strong>de</strong>x of biodiversity for pairs of<br />
species: a generalization of Rao’s in<strong>de</strong>x. Natural Science 3(9): 795-801.<br />
Hankin, R. K. S. (2007). Introducing untb, an R Package For Simu<strong>la</strong>ting Ecological Drift Un<strong>de</strong>r<br />
the Unified Neutral Theory of Biodiversity. Journal of Statistical Software 22(12): 1-15.<br />
Hardy, O. J. (2010). BiodivR 1.2. A program to compute statistically unbiased indices of species<br />
diversity within sample and species simi<strong>la</strong>rity between samples using rarefaction<br />
principles. http://ebe.ulb.ac.be/ebe/Software.html.<br />
Hardy, O. J. et Jost, L. (2008). Interpreting and estimating measures of community<br />
phylogenetic structuring. Journal of Ecology 96(5): 849-852.<br />
Hardy, O. J. et Senterre, B. (2007). Characterizing the phylogenetic structure of communities<br />
by an additive partitioning of phylogenetic diversity. Journal of Ecology 95(3): 493-506.<br />
Harte, J., Kinzig, A. et Green, J. (1999). Self-simi<strong>la</strong>rity in the distribution and abundance of<br />
species. Science 284(5412): 334-336.<br />
Havrda, J. et Charvát, F. (1967). Quantification method of c<strong>la</strong>ssification processes. Concept of<br />
structural α-entropy. Kybernetika 3(1): 30-35.<br />
Hill, M. O. (1973). Diversity and Evenness: A Unifying Notation and Its Consequences.<br />
Ecology 54(2): 427-432.<br />
Hoffmann, S. et Hoffmann, A. (2008). Is there a “true” diversity? Ecological Economics 65(2):<br />
213-215.<br />
Horvitz, D. G. et Thompson, D. J. (1952). A generalization of sampling without rep<strong>la</strong>cement<br />
from a finite universe. Journal of the American Statistical Association 47(260): 663-685.<br />
72
Bibliographie<br />
Hubbell, S. P. (2001). The unified neutral theory of biodiversity and biogeography. Princeton<br />
University Press<br />
Hubbell, S. P., Condit, R. et Foster, R. B. (2005). Barro Colorado Forest Census Plot Data.<br />
https://ctfs.arnarb.harvard.edu/webat<strong>la</strong>s/datasets/bci.<br />
Hurlbert, S. H. (1971). The Nonconcept of Species Diversity: A Critique and Alternative<br />
Parameters. Ecology 52(4): 577-586.<br />
Izsák, J. et Pavoine, S. (2011). New concentration measures as kinds of the quadratic entropy.<br />
Ecological Indicators 11(2): 540-544.<br />
Izsák, J. et Pavoine, S. (2012). Links between the species abundance distribution and the shape<br />
of the corresponding rank abundance curve. Ecological Indicators 14(1): 1-6.<br />
Jensen, J. L. W. V. (1906). Sur les fonctions convexes et les inégalités entre les valeurs<br />
moyennes. Acta Mathematica 30(1): 175-193.<br />
Jones, D. et Matloff, N. (1986). Statistical Hypothesis Testing in Biology: A Contradiction in<br />
Terms. Journal of Economic Entomology 79(5): 1156-1160.<br />
Jost, L. (2006). Entropy and diversity. Oikos 113(2): 363-375.<br />
Jost, L. (2007). Partitioning diversity into in<strong>de</strong>pen<strong>de</strong>nt alpha and beta components. Ecology<br />
88(10): 2427-2439.<br />
Jost, L. (2008). GST and its re<strong>la</strong>tives do not measure differentiation. Molecu<strong>la</strong>r Ecology 17(18):<br />
4015-4026.<br />
Jost, L. (2009). Mismeasuring biological diversity: Response to Hoffmann and Hoffmann<br />
(2008). Ecological Economics 68: 925-928.<br />
Jost, L. (2010). In<strong>de</strong>pen<strong>de</strong>nce of alpha and beta diversities. Ecology 91(7): 1969-1994.<br />
Jurasinski, G., Retzer, V. et Beierkuhnlein, C. (2009). Inventory, differentiation, and<br />
proportional diversity: a consistent terminology for quantifying species diversity.<br />
Oecologia 159(1): 15-26.<br />
Kempton, R. A. et Taylor, L. R. (1974). Log-series and log-normal parameters as diversity<br />
discriminators for Lepidoptera. Journal of Animal Ecology 43(2): 381-399.<br />
Kempton, R. A. et Taylor, L. R. (1976). Mo<strong>de</strong>ls and statistics for species diversity. Nature<br />
262(5571): 818-820.<br />
Kempton, R. A. et Wed<strong>de</strong>rburn, R. W. M. (1978). A comparison of three measures of species<br />
diversity. Biometrics 34: 25-37.<br />
Keylock, C. J. (2005). Simpson diversity and the Shannon-Wiener in<strong>de</strong>x as special cases of a<br />
generalized entropy. Oikos 109(1): 203-207.<br />
Kindt, R., Van Damme, P. et Simons, A. J. (2006). Tree diversity in western Kenya: Using<br />
profiles to characterise richness and evenness. Biodiversity and Conservation 15(4): 1253-<br />
1270.<br />
Krishnamani, R., Kumar, A. et Harte, J. (2004). Estimating species richness at <strong>la</strong>rge spatial<br />
scales using data from small discrete plots. Ecography 27(5): 637-642.<br />
Kullback, S. et Leibler, R. A. (1951). On Information and Sufficiency. The Annals of<br />
Mathematical Statistics 22(1): 79-86.<br />
Lan<strong>de</strong>, R. (1996). Statistics and partitioning of species diversity, and simi<strong>la</strong>rity among multiple<br />
communities. Oikos 76: 5-13.<br />
73
<strong>Mesures</strong> <strong>de</strong> <strong>la</strong> <strong>biodiversité</strong><br />
Leinster, T. et Cobbold, C. (2011). Measuring diversity: the importance of species simi<strong>la</strong>rity.<br />
Ecology.<br />
Lin, J. (1991). Divergence Measures Based on the Shannon Entropy. IEEE Transactions on<br />
Information Theory 37(1).<br />
Lineweaver, H. et Burk, D. (1934). The Determination of Enzyme Dissociation Constants.<br />
Journal of the American Chemical Society 56(3): 658-666.<br />
Lloyd, M. et Ghe<strong>la</strong>rdi, R. J. (1964). A Table for Calcu<strong>la</strong>ting the `Equitability' Component of<br />
Species Diversity. Journal of Animal Ecology 33(2): 217-225.<br />
Lonsdale, W. M. (1999). Global Patterns of P<strong>la</strong>nt Invasions and the Concept of Invasibility.<br />
Ecology 80(5): 1522-1536.<br />
Lorenz, M. O. (1905). Methods of Measuring the concentration of Wealth. Quarterly<br />
Publications of the American Statistical Association 9: 209-219.<br />
Ludovisi, A. et Taticchi, M. I. (2006). Investigating beta diversity by Kullback-Leibler<br />
information measures. Ecological Mo<strong>de</strong>lling 192(1-2): 299-313.<br />
Maasoumi, E. (1993). A compendium to information theory in economics and econometrics.<br />
Econometric Reviews 12(2): 137-181.<br />
MacArthur, R. (1955). Fluctuations of Animal Popu<strong>la</strong>tions and a Measure of Community<br />
Stability. Ecology 36(3): 533-536.<br />
MacArthur, R. H. (1957). On the Re<strong>la</strong>tive Abundance of Bird Species. Proceedings of the<br />
National Aca<strong>de</strong>my of Sciences of the United States of America 43(3): 293-295.<br />
MacArthur, R. H. (1965). Patterns of species diversity. Biological Reviews 40(4): 510-533.<br />
Magurran, A. E. (1988). Ecological diversity and its measurement. Princeton University Press,<br />
Princeton, NJ<br />
Marcon, E. et Hérault, B. (submitted-a). entropart, an R package to partition diversity.<br />
Methods in Ecology and Evolution.<br />
Marcon, E. et Hérault, B. (submitted-b). Partitioning phylodiversity. Methods in Ecology and<br />
Evolution.<br />
Marcon, E., Hérault, B., Baraloto, C. et Lang, G. (2012). The Decomposition of Shannon’s<br />
Entropy and a Confi<strong>de</strong>nce Interval for Beta Diversity. Oikos 121(4): 516-522.<br />
Marcon, E., Scotti, I., Herault, B., Rossi, V. et Lang, G. (submitted). Generalization of the<br />
partitioning of Shannon diversity. PLOS One.<br />
May, R. M. (1975). Patterns of species abundance and diversity. in M. L. Cody et J. M.<br />
Diamond, (Eds), Ecology and Evolution of Communities. Harvard University Press: 81-<br />
120.<br />
May, R. M. (2011). Why Worry about How Many Species and Their Loss? PLoS Biol 9(8):<br />
e1001130.<br />
May, R. M. et Stumpf, M. P. H. (2000). Species-Area Re<strong>la</strong>tions in Tropical Forests. Science<br />
290(5499): 2084-2086.<br />
McGill, B. J. (2003). A test of the unified neutral theory of biodiversity. Nature 422(6934): 881-<br />
885.<br />
McGill, B. J., Etienne, R. S., Gray, J. S., Alonso, D., An<strong>de</strong>rson, M. J., Benecha, H. K.,<br />
Dorne<strong>la</strong>s, M., Enquist, B. J., Green, J. L., He, F., Hurlbert, A. H., Magurran, A. E.,<br />
Marquet, P. A., Maurer, B. A., Ostling, A., Soykan, C. U., Ug<strong>la</strong>nd, K. I. et White, E.<br />
74
Bibliographie<br />
P. (2007). Species abundance distributions: moving beyond single prediction theories to<br />
integration within an ecological framework. Ecology Letters 10(10): 995-1015.<br />
Men<strong>de</strong>s, R. S., Evangelista, L. R., Thomaz, S. M., Agostinho, A. A. et Gomes, L. C. (2008).<br />
A unified in<strong>de</strong>x to measure ecological diversity and species rarity. Ecography 31(4): 450-<br />
456.<br />
Mérigot, B. et Gaertner, J.-C. (2011). Incorporation of phylogeny in biological diversity<br />
measurement: Drawbacks of extensively used indices, and advantages of quadratic<br />
entropy. BioEssays 33(11): 819-822.<br />
Michaelis, L. et Menten, M. L. (1913). Die Kinetik <strong>de</strong>r Invertinwirkung. Biochemische<br />
Zeitschrift 49: 333-369.<br />
Mora, C., Tittensor, D. P., Adl, S., Simpson, A. G. B. et Worm, B. (2011). How Many<br />
Species Are There on Earth and in the Ocean? PLoS Biol 9(8): e1001127.<br />
Morin, A. et Find<strong>la</strong>y, S. (2001). Biodiversité : tendances et processus.<br />
http://simulium.bio.uottawa.ca/bio3515/pdf/presentations/02-Biodiversite.pdf.<br />
Mouillot, D. et Leprêtre, A. (1999). A comparison of species diversity estimators. Researches<br />
on Popu<strong>la</strong>tion Ecology 41(2): 203-215.<br />
Mouillot, D., Mason, W. H. N., Dumay, O. et Wilson, J. B. (2005). Functional regu<strong>la</strong>rity: a<br />
neglected aspect of functional diversity. Oecologia 142(3): 353-359.<br />
Nei, M. (1973). Analysis of Gene Diversity in Subdivi<strong>de</strong>d Popu<strong>la</strong>tions. Proceedings of the<br />
National Aca<strong>de</strong>my of Sciences of the United States of America 70(12): 3321-3323.<br />
Neyman, J. et Scott, E. L. (1958). Statistical Approach to Problems of Cosmology. Journal of<br />
the Royal Statistical Society B 20(1): 1-43.<br />
Norris, J. L. et Pollock, K. H. (1998). Non-parametric MLE for Poisson species abundance<br />
mo<strong>de</strong>ls allowing for heterogeneity between species. Environmental and Ecological<br />
Statistics 5(4): 391-402.<br />
Oksanen, J., B<strong>la</strong>nchet, F. G., Kindt, R., Legendre, P., Minchin, P. R., O'Hara, R. B.,<br />
Simpson, G. L., Solymos, P., Stevens, M. H. H. et Wagner, H. (2012). vegan:<br />
Community Ecology Package. http://CRAN.R-project.org/package=vegan.<br />
Pallmann, P., Schaarschmidt, F., Hothorn, L. A., Fischer, C., Nacke, H., Priesnitz, K. U. et<br />
Schork, N. J. (2012). Assessing group differences in biodiversity by simultaneously<br />
testing a user-<strong>de</strong>fined selection of diversity indices. Molecu<strong>la</strong>r Ecology Resources 12(6):<br />
1068-1078.<br />
Patil, G. P. et Taillie, C. (1982). Diversity as a concept and its measurement. Journal of the<br />
American Statistical Association 77(379): 548-561.<br />
Pavoine, S. et Bonsall, M. B. (2009). Biological diversity: Distinct distributions can lead to the<br />
maximization of Rao's quadratic entropy. Theoretical Popu<strong>la</strong>tion Biology 75(2-3): 153-<br />
163.<br />
Pavoine, S. et Bonsall, M. B. (2011). Measuring biodiversity to exp<strong>la</strong>in community assembly: a<br />
unified approach. Biological Reviews 86(4): 792-812.<br />
Pavoine, S., Dufour, A.-B. et Chessel, D. (2004). From dissimi<strong>la</strong>rities among species to<br />
dissimi<strong>la</strong>rities among communities: a double principal coordinate analysis. Journal of<br />
Theoretical Biology 228(4): 523–537.<br />
Pavoine, S., Love, M. S. et Bonsall, M. B. (2009). Hierarchical partitioning of evolutionary and<br />
ecological patterns in the organization of phylogenetically-structured species assemb<strong>la</strong>ges:<br />
75
<strong>Mesures</strong> <strong>de</strong> <strong>la</strong> <strong>biodiversité</strong><br />
76<br />
Application to rockfish (genus: Sebastes) in the Southern California Bight. Ecology Letters<br />
12(9): 898-908.<br />
Pavoine, S., Ollier, S. et Dufour, A.-B. (2005a). Is the originality of a species measurable?<br />
Ecology Letters 8: 579–586.<br />
Pavoine, S., Ollier, S. et Pontier, D. (2005b). Measuring, diversity from dissimi<strong>la</strong>rities with<br />
Rao's quadratic entropy: Are any dissimi<strong>la</strong>rities suitable? Theoretical Popu<strong>la</strong>tion Biology<br />
67(4): 231-239.<br />
Pélissier, R. et Couteron, P. (2007). An operational, additive framework for species diversity<br />
partitioning and beta-diversity analysis. Journal of Ecology 95(2): 294-300.<br />
Pélissier, R., Couteron, P., Dray, S. et Sabatier, D. (2003). Consistency between ordination<br />
techniques and diversity measurements: Two strategies for species occurrence data.<br />
Ecology 84(1): 242-251.<br />
Petchey, O. L. et Gaston, K. J. (2002). Functional diversity (FD), species richness and<br />
community composition. Ecology Letters 5: 402-411.<br />
Pielou, E. C. (1966a). The measurement of diversity in different types of biological collections.<br />
Journal of Theoretical Biology 13(C): 131-144.<br />
Pielou, E. C. (1966b). Species-diversity and pattern-diversity in the study of ecological<br />
succession. Journal of Theoretical Biology 10(2): 370-383.<br />
Pielou, E. C. (1969). An Introduction to Mathematical Ecology. Wiley, New York. 286<br />
Pielou, E. C. (1975). Ecological Diversity. Wiley, New York<br />
Plotkin, J. B., Potts, M. D., Yu, D. W., Bunyavejchewin, S., Condit, R., Foster, R. B.,<br />
Hubbell, S. P., LaFrankie, J., Manokaran, N., Lee, H.-S., Sukumar, R., Nowak, M. A.<br />
et Ashton, P. S. (2000). Predicting species diversity in tropical forests. Proceedings of the<br />
National Aca<strong>de</strong>my of Sciences of the United States of America 97(20): 10850-10854.<br />
Podani, J. (1999). Extending Gower's General Coefficient of Simi<strong>la</strong>rity to Ordinal Characters.<br />
Taxon 48(2): 331-340.<br />
Podani, J. et Schmera, D. (2006). On <strong>de</strong>ndrogram-based measures of functional diversity.<br />
Oikos 115(1): 179-185.<br />
Preston, F. W. (1948). The Commonness, And Rarity, of Species. Ecology 29(3): 254-283.<br />
Preston, F. W. (1960). Time and Space and the Variation of Species. Ecology 41(4): 611-627.<br />
Preston, F. W. (1962). The Canonical Distribution of Commonness and Rarity: Part I. Ecology<br />
43(2): 185-215.<br />
R Development Core Team (2013). R: A Language and Environment for Statistical Computing.<br />
R Foundation for Statistical Computing. http://www.R-project.org.<br />
Rao, C. R. (1982). Diversity and dissimi<strong>la</strong>rity coefficients: a unified approach. Theoretical<br />
Popu<strong>la</strong>tion Biology 21(24-43).<br />
Rényi, A. (1961). On Measures of Entropy and Information. 4th Berkeley Symposium on<br />
Mathematical Statistics and Probability, Berkeley, USA, University of California Press.<br />
Ricotta, C. (2003). On parametric evenness measures. Journal of Theoretical Biology 222(2):<br />
189-197.<br />
Ricotta, C. (2005). Additive partitioning of Rao's quadratic diversity: a hierarchical approach.<br />
Ecological Mo<strong>de</strong>lling 183(4): 365-371.
Bibliographie<br />
Ricotta, C. (2007). A semantic taxonomy for diversity measures. Acta Biotheoretica 55(1): 23-<br />
33.<br />
Ricotta, C. (2010). On beta diversity <strong>de</strong>composition: Trouble shared is not trouble halved.<br />
Ecology 91(7): 1981-1983.<br />
Ricotta, C. et Avena, G. (2003). An information-theoretical measure of β-diversity. P<strong>la</strong>nt<br />
Biosystems 137(1): 57 - 61.<br />
Ricotta, C., De Zuliani, E. et Pacini, A. (2001). On the mutual re<strong>la</strong>tedness of evenness<br />
measures. Community Ecology 2(1): 51-56.<br />
Routledge, R. D. (1979). Diversity indices: Which ones are admissible? Journal of Theoretical<br />
Biology 76(4): 503-515.<br />
Scheiner, S. M. (2003). Six types of species-area curves. Global Ecology and Biogeography<br />
12(6): 441-447.<br />
Schmera, D., Erős, T. et Podani, J. (2009). A measure for assessing functional diversity in<br />
ecological communities. Aquatic Ecology 43(1): 157-167.<br />
Schulte, R. P. O., Lantinga, E. A. et Hawkins, M. J. (2005). A new family of Fisher-curves<br />
estimates Fisher's alpha more accurately. Journal of Theoretical Biology 232(3): 305-313.<br />
Schürmann, T. (2004). Bias analysis in entropy estimation. Journal of Physics A: Mathematical<br />
and Theoretical 37(27): L295-L301.<br />
Shannon, C. E. (1948). A Mathematical Theory of Communication. The Bell System Technical<br />
Journal 27: 379–423, 623–656.<br />
Shannon, C. E. et Weaver, W. (1963). The Mathematical Theory of Communication. University<br />
of Illinois Press<br />
Shen, T.-J., Chao, A. et Lin, C.-F. (2003). Predicting the number of new species in a further<br />
taxonomic sampling. Ecology 84: 798-804.<br />
Shimatani, K. (2001). On the measurement of species diversity incorporating species<br />
differences. Oikos 93(1): 135-147.<br />
Simpson, E. H. (1949). Measurement of diversity. Nature 163(4148): 688.<br />
Smith, B. et Wilson, J. B. (1996). A consumer's gui<strong>de</strong> to evenness indices. Oikos 76(1): 70-82.<br />
Soberón M., J. et Llorente B., J. (1993). The Use of Species Accumu<strong>la</strong>tion Functions for the<br />
Prediction of Species Richness. Conservation Biology 7(3): 480-488.<br />
Sokal, R. R. et Michener, C. D. (1958). A statistical method for evaluating systematic<br />
re<strong>la</strong>tionships. The University of Kansas Science Bulletin 38(22): 1409-1438.<br />
Swenson, N. G. et Enquist, B. J. (2009). Opposing assembly mechanisms in a Neotropical dry<br />
forest: Implications for phylogenetic and functional community ecology. Ecology 90(8):<br />
2161-2170.<br />
Theil, H. (1967). Economics and Information Theory. Rand McNally and Company, Chicago<br />
Tothmeresz, B. (1995). Comparison of different methods for diversity or<strong>de</strong>ring. Journal of<br />
Vegetation Science 6(2): 283-290.<br />
Triantis, K. A., Guilhaumon, F. et Whittaker, R. J. (2012). The is<strong>la</strong>nd species–area<br />
re<strong>la</strong>tionship: biology and statistics. Journal of Biogeography 39(2): 215-231.<br />
Tsallis, C. (1988). Possible generalization of Boltzmann-Gibbs statistics. Journal of Statistical<br />
Physics 52(1): 479-487.<br />
77
<strong>Mesures</strong> <strong>de</strong> <strong>la</strong> <strong>biodiversité</strong><br />
Tsallis, C. (1994). What are the numbers that experiments provi<strong>de</strong>? Química Nova 17(6): 468-<br />
471.<br />
Tuomisto, H. (2010a). A diversity of beta diversities: straightening up a concept gone awry. Part<br />
1. Defining beta diversity as a function of alpha and gamma diversity. Ecography 33(1): 2-<br />
22.<br />
Tuomisto, H. (2010b). A diversity of beta diversities: straightening up a concept gone awry.<br />
Part 2. Quantifying beta diversity and re<strong>la</strong>ted phenomena. Ecography 33(1): 23-45.<br />
Tuomisto, H. (2011). Commentary: do we have a consistent terminology for species diversity?<br />
Yes, if we choose to use it. Oecologia 167(4): 903-911.<br />
Tuomisto, H. (2012). An updated consumer’s gui<strong>de</strong> to evenness and re<strong>la</strong>ted indices. Oikos<br />
121(8): 1203-1218.<br />
U<strong>la</strong>nowicz, R. E. (2001). Information theory in ecology. Computers & Chemistry 25(4): 393-<br />
399.<br />
Veech, J. A. et Crist, T. O. (2010a). Diversity partitioning without statistical in<strong>de</strong>pen<strong>de</strong>nce of<br />
alpha and beta. Ecology 91(7): 1964-1969.<br />
Veech, J. A. et Crist, T. O. (2010b). Toward a unified view of diversity partitioning. Ecology<br />
91(7): 1988-1992.<br />
Veech, J. A., Summerville, K. S., Crist, T. O. et Gering, J. C. (2002). The additive<br />
partitioning of species diversity: recent revival of an old i<strong>de</strong>a. Oikos 99(1): 3-9.<br />
Villeger, S. et Mouillot, D. (2008). Additive partitioning of diversity including species<br />
differences: a comment on Hardy & Senterre (2007). Journal of Ecology 96(5): 845-848.<br />
Volkov, I., Banavar, J. R., Hubbell, S. P. et Maritan, A. (2003). Neutral theory and re<strong>la</strong>tive<br />
species abundance in ecology. Nature 424(6952): 1035-1037.<br />
Walker, B., Kinzig, A. et Langridge, J. (1999). Original Articles: P<strong>la</strong>nt Attribute Diversity,<br />
Resilience, and Ecosystem Function: The Nature and Significance of Dominant and Minor<br />
Species. Ecosystems 2(2): 95-113.<br />
Wang, J.-P. (2010). Estimating species richness by a Poisson-compound gamma mo<strong>de</strong>l.<br />
Biometrika 97(3): 727-740.<br />
Wang, J.-P. (2011). SPECIES: An R Package for Species Richness Estimation. Journal of<br />
Statistical Software 40(9): 1-15.<br />
Wang, J.-P., Lindsay, B., Cui, L., Wall, P. K., Marion, J., Zhang, J. et <strong>de</strong>Pamphilis, C.<br />
(2005). Gene capture prediction and over<strong>la</strong>p estimation in EST sequencing from one or<br />
multiple libraries. BMC Bioinformatics 6(1): 300.<br />
Webb, C. O. (2000). Exploring the phylogenetic structure of ecological communities: An<br />
example for rain forest trees. American Naturalist 156(2): 145-155.<br />
Whittaker, R. H. (1960). Vegetation of the Siskiyou Mountains, Oregon and California.<br />
Ecological Monographs 30(3): 279-338.<br />
Whittaker, R. H. (1965). Dominance and diversity in <strong>la</strong>nd p<strong>la</strong>nt communities. Science<br />
147(3655): 250-260.<br />
Whittaker, R. H. (1972). Evolution and Measurement of Species Diversity. Taxon 21(2/3): 213-<br />
251.<br />
Whittaker, R. H. (1977). Evolution of species diversity in <strong>la</strong>nd communities. Evolutionary<br />
Biology 10: 1-67.<br />
78
Williams, C. B. (1964). Patterns in the ba<strong>la</strong>nce of nature. Aca<strong>de</strong>mic. 324<br />
Bibliographie<br />
Williamson, M., Gaston, K. J. et Lonsdale, W. M. (2001). The species–area re<strong>la</strong>tionship does<br />
not have an asymptote! Journal of Biogeography 28(7): 827-830.<br />
Wilsey, B. J. (2010). An empirical comparison of beta diversity indices in establishing prairies.<br />
Ecology 91(7): 1984-1988.<br />
Wright, I. J., Reich, P. B., Westoby, M., Ackerly, D. D., Baruch, Z., Bongers, F., Caven<strong>de</strong>r-<br />
Bares, J., Chapin, T., Cornelissen, J. H. C., Diemer, M., Flexas, J., Garnier, E.,<br />
Groom, P. K., Gulias, J., Hikosaka, K., Lamont, B. B., Lee, T., Lee, W., Lusk, C.,<br />
Midgley, J. J., Navas, M.-L., Niinemets, U., Oleksyn, J., Osada, N., Poorter, H., Poot,<br />
P., Prior, L., Pyankov, V. I., Roumet, C., Thomas, S. C., Tjoelker, M. G., Venek<strong>la</strong>as,<br />
E. J. et Vil<strong>la</strong>r, R. (2004). The worldwi<strong>de</strong> leaf economics spectrum. Nature 428: 821-827.<br />
Würtz, P. et Anni<strong>la</strong>, A. (2008). Roots of Diversity Re<strong>la</strong>tions. Journal of Biophysics 2008:<br />
Article ID 654672.<br />
Zhang, C. H. et Zhang, Z. Y. (2009). Asymptotic Normality of a Nonparametric Estimator of<br />
Sample Coverage. Annals of Statistics 37(5A): 2582-2595.<br />
Zhang, Z. et Huang, H. (2007). Turing's formu<strong>la</strong> revisited. Journal of Quantitative Linguistics<br />
14(2-3): 222-241.<br />
79