- Page 1: THESE Pour l'obtention du Grade de
- Page 4 and 5: 2.3.2. BILAN DES CONNAISSANCES GEOL
- Page 6 and 7: 5.8. ANALYSES STATISTIQUES DES DONN
- Page 8 and 9: Figure 4-1 : Schéma de principe d
- Page 11 and 12: REMERCIEMENTS Ce travail de thèse
- Page 13 and 14: INTRODUCTION GENERALE I. LE PROGRAM
- Page 15 and 16: concernant en particulier l'aliment
- Page 17 and 18: CHAPITRE 1. HYDROGEOLOGIE DES MILIE
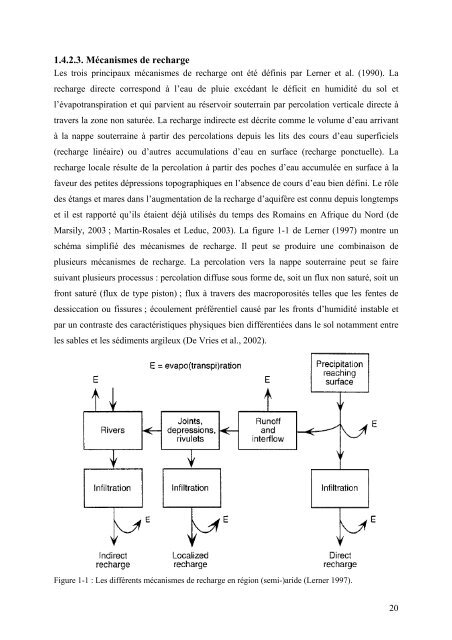
- Page 19 and 20: structure et le fonctionnement hydr
- Page 21: L’imagerie satellite est une tech
- Page 25 and 26: apparentes. Cette différence est d
- Page 27 and 28: eaux se matérialise sous la forme
- Page 29 and 30: CHAPITRE 2 : BILAN DES CONNAISSANCE
- Page 31 and 32: facteurs climatiques. Les formation
- Page 33 and 34: 2.2.4. PROBLEMATIQUE DE L’EAU 2.2
- Page 35 and 36: l’ONEAD sur la base du recensemen
- Page 37 and 38: Une récente étude de Daoud (2008)
- Page 39 and 40: unité cartographique largement ét
- Page 41 and 42: obtenus par cette mission la CGG s
- Page 43 and 44: 2.3.4. BILAN DES ETUDES GEOCHIMIQUE
- Page 45 and 46: des alluvions dépasse parfois plus
- Page 47 and 48: de transmissivité plus faibles car
- Page 49 and 50: 2.3.8. TRAVAUX ANTERIEURS DE MODELI
- Page 51 and 52: Ces deux premiers travaux ont permi
- Page 53 and 54: CHAPITRE 3 : LE SITE EXPERIMENTAL H
- Page 55 and 56: Le "Geyser Geothermal Field" est lo
- Page 57 and 58: Figure 3-1 : Carte géologique de l
- Page 59 and 60: AMP3 Argiles rouges AMP2 Sédiments
- Page 61 and 62: 1 3 4 5 6 Figure 3-5 : Cuttings (1,
- Page 63 and 64: 3.6. INSTRUMENTS HYDROGEOLOGIQUES D
- Page 65 and 66: Les données transférées sur le P
- Page 67 and 68: 2 à 4 semaines après une crue. De
- Page 69 and 70: 12. Sur le piézomètre AMP3, le pi
- Page 71 and 72: Figure 3-12 : Crue de l’oued Atar
- Page 73 and 74:
des conductivités entre 800 et 300
- Page 75 and 76:
Profondeur (m) Profondeur (m) Profo
- Page 77 and 78:
Température (°C) Conductivité (m
- Page 79 and 80:
3.6.5. VARIATIONS PIEZOMETRIQUES ET
- Page 81:
3.7. CONCLUSION Le site expériment
- Page 84 and 85:
Un essai par pompage mobilise par c
- Page 86 and 87:
En résumé, les aquifères basalti
- Page 88 and 89:
4.3.2. POMPAGES PAR PALIERS DE DEBI
- Page 90 and 91:
4.3.3. POMPAGES DE LONGUE DUREE 4.3
- Page 92 and 93:
4.4. INTERPRETATIONS DES ESSAIS HYD
- Page 94 and 95:
4.4.1.2. Méthodes d’interprétat
- Page 96 and 97:
Figure 4-11 : Plan de position des
- Page 98 and 99:
Profondeur du forage 50m AM2 Tête
- Page 100 and 101:
4.4.3.2. Analyse des données piéz
- Page 102 and 103:
0.1 AM1 0.01 100 1000 10000 100000
- Page 104 and 105:
Avec : rD rayon sans dimension = (r
- Page 106 and 107:
esources used as the in situ hydrau
- Page 108 and 109:
wells, 5 AM wells reaching scorias
- Page 110 and 111:
∞ −u Q e du Q s = ∫ = W ( u)
- Page 112 and 113:
experimental data. Estimates of T a
- Page 114 and 115:
Nomenclature B leakage factor Kbb '
- Page 116 and 117:
Kurtzmana D., Nativa R. , Adarb E.M
- Page 118 and 119:
Figure 1. Location map of the Djibo
- Page 120 and 121:
Figure 5. Typical overdamped slug-t
- Page 122 and 123:
4.5. CONCLUSION Les tests hydrauliq
- Page 124 and 125:
1280000 1275000 1270000 1265000 126
- Page 126 and 127:
Altitude (m) 60 50 40 30 20 10 0 -1
- Page 128 and 129:
seul niveau de profondeur. Pour le
- Page 130 and 131:
5.4. PRESENTATION DES DONNEES Sur l
- Page 132 and 133:
meq/L 800 100 10 1 0.1 0.01 Ca mg/L
- Page 134 and 135:
5.6.1.1. La température La tempér
- Page 136 and 137:
5.6.2.2. Les bicarbonates (HCO3-) L
- Page 138 and 139:
Les teneurs en silice sont mesurée
- Page 140 and 141:
Ca2+ (mg/l) 10000 1000 100 10 1 NDJ
- Page 142 and 143:
Le rapport Br-/Cl- est généraleme
- Page 144 and 145:
La figure 5-12, représente les pri
- Page 146 and 147:
Le diagramme deutérium en fonction
- Page 148 and 149:
5.8.2. ANALYSES EN COMPOSANTES PRIN
- Page 150 and 151:
Axe factoriel Axe factoriel Axe fac
- Page 152 and 153:
d’« effet de poids » est bien c
- Page 154 and 155:
- Le domaine 3 formé par le pôle
- Page 156 and 157:
Les teneurs en 18 O et 2 H mesurée
- Page 159 and 160:
CHAPITRE 6 : MODELISATION NUMERIQUE
- Page 161 and 162:
d’un traitement statistique des r
- Page 163 and 164:
F9b. Une corrélation entre les ét
- Page 165 and 166:
Le système fonctionne comme un dis
- Page 167 and 168:
plus approprié et le plus pratique
- Page 169 and 170:
Numerical modeling of the basaltic
- Page 171 and 172:
3. Hydrodynamics characteristics of
- Page 173 and 174:
(Doherty, 2002) may be used in this
- Page 175 and 176:
less distributed along a zone paral
- Page 177 and 178:
Gasse F., Varet J., Mazet G., Recro
- Page 179 and 180:
Gulf/Somali basalts No flow B.C. Fi
- Page 181 and 182:
Figure 5. Experimental variogram of
- Page 183 and 184:
Figure 9. Distribution of the pilot
- Page 185:
6.6. CONCLUSION L’aquifère de Dj
- Page 188 and 189:
Des perméabilités très élevées
- Page 190 and 191:
Barenblatt, G.E., Zheltov I.A., Koc
- Page 192 and 193:
Chandrapala L., Wimalasuriya M., 20
- Page 194 and 195:
Essink, G.O., 2001. Improving fresh
- Page 196 and 197:
Hantush M.S., Jacob C.E., 1955. Non
- Page 198 and 199:
Kabala, Z.J., Pinder, G.F., Milly,
- Page 200 and 201:
Moench A.F., 1984. Double porosity
- Page 202 and 203:
Röhrich T., Waterloo Hydrogeologic
- Page 204 and 205:
Tsang Y.W., Wang J., Freifeld B., C
- Page 206 and 207:
ANNEXES ANNEXE 1. LE RESEAU HYDROGR
- Page 208 and 209:
ANNEXE 2. REALISATION DES FORAGES E
- Page 210 and 211:
ANNEXE 3. IMPACT D’UNE CRUE DE L
- Page 212 and 213:
∆h i = h i − h i − 1 (12);
- Page 214 and 215:
les données du slug test à une so
- Page 216 and 217:
⎛ ht ⎞ πr² ⎜ ⎜ln h ⎟ 0
- Page 218 and 219:
où : r rayon du tubage [L] R rayon
- Page 220:
' c = K' [T] (28) Si K’=0 (aquita