

Profil Épidémiologique de l'infection par le VIH et du SIDA ... - nastad
Profil Épidémiologique de l'infection par le VIH et du SIDA ... - nastad
Profil Épidémiologique de l'infection par le VIH et du SIDA ... - nastad

Create successful ePaper yourself
Turn your PDF publications into a flip-book with our unique Google optimized e-Paper software.
Tab<strong>le</strong>au 5.3 : Taux <strong>de</strong> préva<strong>le</strong>nce <strong>du</strong> <strong>VIH</strong> <strong>du</strong> MESI-PTME <strong>et</strong> <strong>du</strong> MESI-CDV, 2004–2007<br />
Source <strong>de</strong> données MESI-PTME MESI-CDV<br />
Dé<strong>par</strong>tement 2004 2005 2006 2007 2004 2005 2006 2007<br />
Grand’ Anse 3.0 % 6.0 % 4.0 % 4.7 % 7.5 % 11.7 % 9.2 % 6.4 %<br />
Nippes 5.9 % 3.8 % 2.4 % 2.4 % 16.8 % 13.8 % 11.8 % 8.7 %<br />
Sud 3.8 % 3.5 % 2.8 % 3.0 % 16.0 % 12.7 % 8.9 % 7.6 %<br />
Sud-est 3.3 % 2.0 % 2.8 % 2.4 % 5.8 % 9.2 % 6.5 % 5.2 %<br />
Grand Sud 4.5 % 3.9 % 2.9 % 3.2 % 12.5 % 12.3 % 9.1 % 7.1 %<br />
Haïti 3.2 % 3.4 % 3.3 % 3.2 % 10.8 % 10.5 % 9.0 % 8.3 %<br />
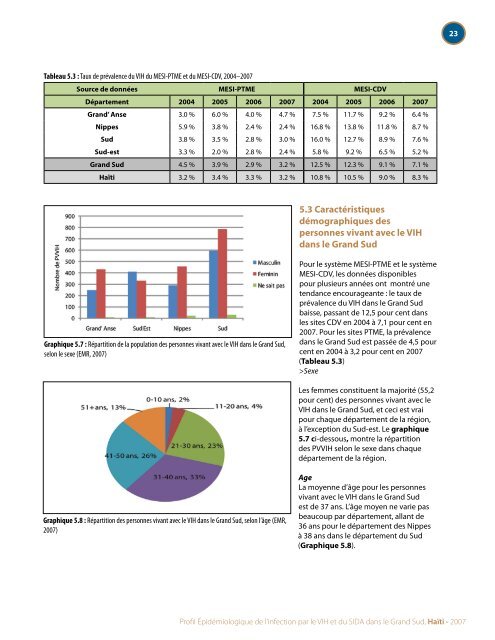
Graphique 5.7 : Ré<strong>par</strong>tition <strong>de</strong> la population <strong>de</strong>s personnes vivant avec <strong>le</strong> <strong>VIH</strong> dans <strong>le</strong> Grand Sud,<br />
selon <strong>le</strong> sexe (EMR, 2007)<br />
Graphique 5.8 : Ré<strong>par</strong>tition <strong>de</strong>s personnes vivant avec <strong>le</strong> <strong>VIH</strong> dans <strong>le</strong> Grand Sud, selon l’âge (EMR,<br />
2007)<br />
5.3 Caractéristiques<br />
démographiques <strong>de</strong>s<br />
personnes vivant avec <strong>le</strong> <strong>VIH</strong><br />
dans <strong>le</strong> Grand Sud<br />
Pour <strong>le</strong> système MESI-PTME <strong>et</strong> <strong>le</strong> système<br />
MESI-CDV, <strong>le</strong>s données disponib<strong>le</strong>s<br />
pour plusieurs années ont montré une<br />
tendance encourageante : <strong>le</strong> taux <strong>de</strong><br />
préva<strong>le</strong>nce <strong>du</strong> <strong>VIH</strong> dans <strong>le</strong> Grand Sud<br />
baisse, passant <strong>de</strong> 12,5 pour cent dans<br />
<strong>le</strong>s sites CDV en 2004 à 7,1 pour cent en<br />
2007. Pour <strong>le</strong>s sites PTME, la préva<strong>le</strong>nce<br />
dans <strong>le</strong> Grand Sud est passée <strong>de</strong> 4,5 pour<br />
cent en 2004 à 3,2 pour cent en 2007<br />
(Tab<strong>le</strong>au 5.3)<br />
>Sexe<br />
Les femmes constituent la majorité (55,2<br />
pour cent) <strong>de</strong>s personnes vivant avec <strong>le</strong><br />
<strong>VIH</strong> dans <strong>le</strong> Grand Sud, <strong>et</strong> ceci est vrai<br />
pour chaque dé<strong>par</strong>tement <strong>de</strong> la région,<br />
à l’exception <strong>du</strong> Sud-est. Le graphique<br />
5.7 ci-<strong>de</strong>ssous, montre la ré<strong>par</strong>tition<br />
<strong>de</strong>s PV<strong>VIH</strong> selon <strong>le</strong> sexe dans chaque<br />
dé<strong>par</strong>tement <strong>de</strong> la région.<br />
Age<br />
La moyenne d’âge pour <strong>le</strong>s personnes<br />
vivant avec <strong>le</strong> <strong>VIH</strong> dans <strong>le</strong> Grand Sud<br />
est <strong>de</strong> 37 ans. L’âge moyen ne varie pas<br />
beaucoup <strong>par</strong> dé<strong>par</strong>tement, allant <strong>de</strong><br />
36 ans pour <strong>le</strong> dé<strong>par</strong>tement <strong>de</strong>s Nippes<br />
à 38 ans dans <strong>le</strong> dé<strong>par</strong>tement <strong>du</strong> Sud<br />
(Graphique 5.8).<br />
<strong>Profil</strong> <strong>Épidémiologique</strong> <strong>de</strong> l’infection <strong>par</strong> <strong>le</strong> <strong>VIH</strong> <strong>et</strong> <strong>du</strong> <strong>SIDA</strong> dans <strong>le</strong> Grand Sud, Haïti - 2007<br />
23