Présentation - CM-CIC Asset Management
Présentation - CM-CIC Asset Management
Présentation - CM-CIC Asset Management

You also want an ePaper? Increase the reach of your titles
YUMPU automatically turns print PDFs into web optimized ePapers that Google loves.
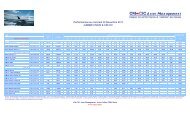
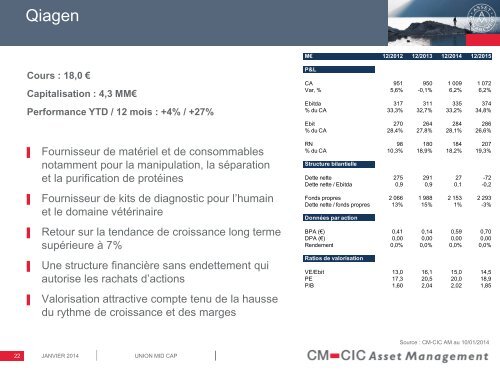
Qiagen<br />
M€ 12/2012 12/2013 12/2014 12/2015<br />
Cours : 18,0 €<br />
Capitalisation : 4,3 MM€<br />
Performance YTD / 12 mois : +4% / +27%<br />
P&L<br />
CA 951 950 1 009 1 072<br />
Var, % 5,6% -0,1% 6,2% 6,2%<br />
Ebitda 317 311 335 374<br />
% du CA 33,3% 32,7% 33,2% 34,8%<br />
Ebit 270 264 284 286<br />
% du CA 28,4% 27,8% 28,1% 26,6%<br />
▌<br />
▌<br />
▌<br />
▌<br />
▌<br />
Fournisseur de matériel et de consommables<br />
notamment pour la manipulation, la séparation<br />
et la purification de protéines<br />
Fournisseur de kits de diagnostic pour l’humain<br />
et le domaine vétérinaire<br />
Retour sur la tendance de croissance long terme<br />
supérieure à 7%<br />
Une structure financière sans endettement qui<br />
autorise les rachats d’actions<br />
Valorisation attractive compte tenu de la hausse<br />
du rythme de croissance et des marges<br />
RN 98 180 184 207<br />
% du CA 10,3% 18,9% 18,2% 19,3%<br />
Structure bilantielle<br />
Dette nette 275 291 27 -72<br />
Dette nette / Ebitda 0,9 0,9 0,1 -0,2<br />
Fonds propres 2 066 1 988 2 153 2 293<br />
Dette nette / fonds propres 13% 15% 1% -3%<br />
Données par action<br />
BPA (€) 0,41 0,14 0,59 0,70<br />
DPA (€) 0,00 0,00 0,00 0,00<br />
Rendement 0,0% 0,0% 0,0% 0,0%<br />
Ratios de valorisation<br />
VE/Ebit 13,0 16,1 15,0 14,5<br />
PE 17,3 20,5 20,0 18,9<br />
P/B 1,60 2,04 2,02 1,85<br />
Source : <strong>CM</strong>-<strong>CIC</strong> AM au 10/01/2014<br />
22<br />
JANVIER 2014<br />
UNION MID CAP