BUDGET PRIMITIF - Ville de Paris
BUDGET PRIMITIF - Ville de Paris
BUDGET PRIMITIF - Ville de Paris

Create successful ePaper yourself
Turn your PDF publications into a flip-book with our unique Google optimized e-Paper software.
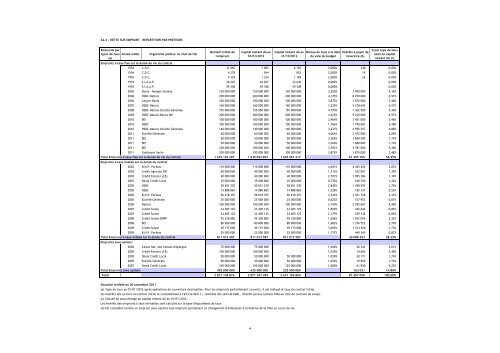
A2.4 - DETTE SUR EMPRUNT - REPARTITION PAR PRETEURS<br />
Emprunts par<br />
types <strong>de</strong> taux Année mobil.<br />
(a)<br />
Emprunts à taux fixe sur la durée <strong>de</strong> vie du contrat<br />
Organisme prêteur ou chef <strong>de</strong> file<br />
Montant initial <strong>de</strong><br />
l'emprunt<br />
Capital restant dû au<br />
01/01/2012<br />
Capital restant dû au<br />
31/12/2012<br />
Niveau du taux à la date<br />
du vote du budget<br />
Intérêts à payer <strong>de</strong><br />
l'exercice (b)<br />
% par type <strong>de</strong> taux<br />
selon le capital<br />
restant dû (c)<br />
1954 C.D.C. 31 065 7 003 6 187 2,000% 140 0,00%<br />
1954 C.D.C. 4 278 964 852 2,000% 19 0,00%<br />
1955 C.D.C. 5 329 1 324 1 189 2,000% 26 0,00%<br />
1974 S.I.A.A.P. 26 267 26 267 23 640 0,000% - 0,00%<br />
1976 S.I.A.A.P. 59 348 59 348 59 348 0,000% - 0,00%<br />
2005 Dexia - Morgan Stanley 120 000 000 120 000 000 120 000 000 3,250% 3 900 000 4,18%<br />
2006 HSBC-Natixis 200 000 000 200 000 000 200 000 000 4,125% 8 250 000 6,97%<br />
2006 Calyon-Dexia 100 000 000 100 000 000 100 000 000 3,875% 3 875 000 3,48%<br />
2007 HSBC-Natixis 160 000 000 160 000 000 160 000 000 3,229% 5 238 642 5,57%<br />
2008 HSBC-Natixis-Société Générale 155 000 000 155 000 000 155 000 000 4,750% 7 362 500 5,40%<br />
2009 HSBC-Natixis-Banca IMI 200 000 000 200 000 000 200 000 000 4,625% 9 250 000 6,97%<br />
2010 BEI 100 000 000 100 000 000 100 000 000 3,404% 3 451 000 3,48%<br />
2010 HSBC 100 000 000 100 000 000 100 000 000 1,766% 1 790 681 3,48%<br />
2010 HSBC-Natixis-Société Générale 140 000 000 140 000 000 140 000 000 3,237% 4 595 257 4,88%<br />
0 2011 Société Générale 60 000 000 60 000 000 60 000 000 4,064% 2 472 000 2,09%<br />
0 2011 BEI 50 000 000 50 000 000 50 000 000 3,369% 1 684 500 1,74%<br />
0 2011 BEI 50 000 000 50 000 000 50 000 000 3,360% 1 680 000 1,74%<br />
0 2011 BEI 100 000 000 100 000 000 100 000 000 3,781% 3 781 000 3,48%<br />
0 2011 Goldmann Sachs 100 000 000 100 000 000 100 000 000 3,875% 3 875 000 3,48%<br />
Total Emprunts à taux fixe sur la durée <strong>de</strong> vie du contrat 1 635 126 287 1 635 094 907 1 635 091 217 61 205 765 56,95%<br />
Emprunts à taux in<strong>de</strong>xé sur la durée du contrat<br />
0 2002 B.N.P. Paribas 110 000 000 110 000 000 110 000 000 4,041% 4 445 426 3,83%<br />
0 2003 Crédit Agricole IDF 40 000 000 40 000 000 40 000 000 1,312% 532 067 1,39%<br />
0 2003 Crédit Foncier (CE) 40 000 000 40 000 000 40 000 000 2,701% 1 095 306 1,39%<br />
0 2003 Dexia Crédit Local 35 000 000 35 000 000 35 000 000 0,735% 260 750 1,22%<br />
0 2005 HSBC 50 651 230 50 651 230 50 651 230 2,840% 1 458 593 1,76%<br />
0 2005 HSBC 14 888 865 14 888 865 14 888 865 1,228% 185 337 0,52%<br />
0 2005 B.N.P. Paribas 96 618 357 96 618 357 96 618 357 3,343% 3 301 728 3,37%<br />
0 2005 Société Générale 25 000 000 25 000 000 25 000 000 0,623% 157 952 0,87%<br />
0 2006 Natixis 100 000 000 100 000 000 100 000 000 2,740% 2 785 667 3,48%<br />
0 2007 Crédit Suisse 24 405 125 24 405 125 24 405 125 1,859% 442 644 0,85%<br />
0 2007 Crédit Suisse 24 405 125 24 405 125 24 405 125 2,179% 539 142 0,85%<br />
0 2008 Crédit Suisse-BNPP 95 328 885 95 328 885 95 328 885 1,606% 1 552 054 3,32%<br />
0 2008 BEI 80 000 000 80 000 000 80 000 000 1,683% 1 376 722 2,79%<br />
0 2009 Crédit Suisse 49 715 000 49 715 000 49 715 000 3,069% 1 514 526 1,73%<br />
0 2009 B.N.P. Paribas 25 000 000 25 000 000 25 000 000 1,737% 440 340 0,87%<br />
Total Emprunts à taux in<strong>de</strong>xé sur la durée du contrat 811 012 587 811 012 587 811 012 587 20 088 253 28,25%<br />
Emprunts avec options<br />
0 2004 Caisse Nat. <strong>de</strong>s Caisses d'épargne 75 000 000 75 000 000 - 1,040% 26 343 2,61%<br />
0 2005 Crédit Foncier (CE) 100 000 000 100 000 000 - 1,030% 34 603 3,48%<br />
0 2005 Dexia Crédit Local 50 000 000 50 000 000 50 000 000 1,030% 20 171 1,74%<br />
0 2005 Société Générale 50 000 000 50 000 000 50 000 000 1,020% 19 965 1,74%<br />
0 2007 Dexia Crédit Local 150 000 000 150 000 000 125 000 000 1,080% 61 950 5,22%<br />
Total Emprunts avec options 425 000 000 425 000 000 225 000 000 163 031 14,80%<br />
Total 2 871 138 874 2 871 107 495 2 671 103 804 81 457 050 100,00%<br />
Situation arrêtée au 30 novembre 2011<br />
(a) Type <strong>de</strong> taux au 01/01/2012 après opérations <strong>de</strong> couverture éventuelles. Pour les emprunts partiellement couverts, il est indiqué le taux du contrat initial.<br />
(b) Intérêts dûs au titre du contrat initial et comptabilisés à l'article 66111 + (intérêts dûs (article 668) - intérêts perçus (article 768) au titre <strong>de</strong> contrats <strong>de</strong> swap).<br />
(c) Calculé en pourcentage du capital restant dû au 01/01/2012.<br />
Les intérêts <strong>de</strong>s emprunts à taux révisables sont calculés sur la base d'hypothèses <strong>de</strong> taux<br />
(d) Est considéré comme un emprunt avec options tout emprunt permettant un changement d'in<strong>de</strong>xation à l'initiative <strong>de</strong> la <strong>Ville</strong> en cours <strong>de</strong> vie.<br />
4