Bilan des Activités Minières, année 2008 - Ministère de l'énergie et ...
Bilan des Activités Minières, année 2008 - Ministère de l'énergie et ...
Bilan des Activités Minières, année 2008 - Ministère de l'énergie et ...

Create successful ePaper yourself
Turn your PDF publications into a flip-book with our unique Google optimized e-Paper software.
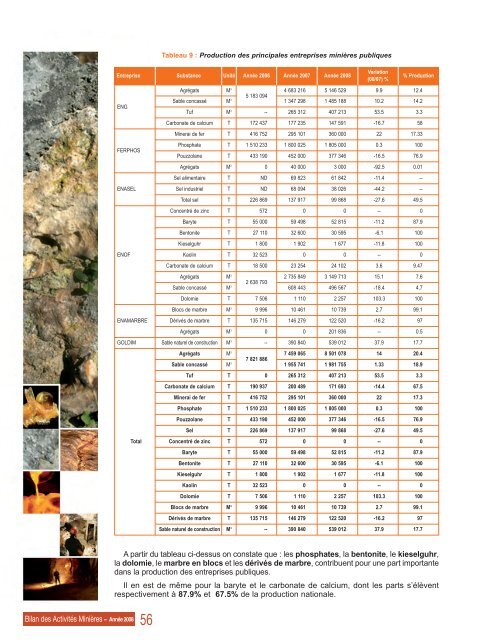
ENGTableau 9 : Production <strong><strong>de</strong>s</strong> principales entreprises minières publiquesEntreprise Substance Unité Année 2006 Année 2007 Année <strong>2008</strong>FERPHOSENASELENOFENAMARBREAgrégats M 3 4 683 216 5 146 529 9.9 12.45 183 094Sable concassé M 3 1 347 298 1 485 188 10.2 14.2Tuf M 3 -- 265 312 407 213 53.5 3.3Carbonate <strong>de</strong> calcium T 172 437 177 235 147 591 -16.7 58Minerai <strong>de</strong> fer T 416 752 295 101 360 000 22 17.33Phosphate T 1 510 233 1 800 025 1 805 000 0.3 100Pouzzolane T 433 190 452 000 377 346 -16.5 76.9Agrégats M 3 0 40 000 3 000 -92.5 0.01Sel alimentaire T ND 69 823 61 842 -11.4 --Sel industriel T ND 68 094 38 026 -44.2 --Total sel T 226 869 137 917 99 868 -27.6 49.5Concentré <strong>de</strong> zinc T 572 0 0 -- 0Baryte T 55 000 59 498 52 815 -11.2 87.9Bentonite T 27 110 32 600 30 595 -6.1 100Kieselguhr T 1 800 1 902 1 677 -11.8 100Kaolin T 32 523 0 0 -- 0Carbonate <strong>de</strong> calcium T 18 500 23 254 24 102 3.6 9.47Agrégats M 3 2 735 849 3 149 713 15.1 7.62 638 793Sable concassé M 3 608 443 496 567 -18.4 4.7Dolomie T 7 506 1 110 2 257 103.3 100Blocs <strong>de</strong> marbre M 3 9 996 10 461 10 739 2.7 99.1Dérivés <strong>de</strong> marbre T 135 715 146 279 122 520 -16.2 97Agrégats M 3 0 0 201 836 -- 0.5GOLDIM Sable naturel <strong>de</strong> construction M 3 -- 390 840 539 012 37.9 17.7TotalVariation(08/07) %% ProductionAgrégats M 3 7 459 065 8 501 078 14 20.47 821 886Sable concassé M 3 1 955 741 1 981 755 1.33 18.9Tuf T 0 265 312 407 213 53.5 3.3Carbonate <strong>de</strong> calcium T 190 937 200 489 171 693 -14.4 67.5Minerai <strong>de</strong> fer T 416 752 295 101 360 000 22 17.3Phosphate T 1 510 233 1 800 025 1 805 000 0.3 100Pouzzolane T 433 190 452 000 377 346 -16.5 76.9Sel T 226 869 137 917 99 868 -27.6 49.5Concentré <strong>de</strong> zinc T 572 0 0 -- 0Baryte T 55 000 59 498 52 815 -11.2 87.9Bentonite T 27 110 32 600 30 595 -6.1 100Kieselguhr T 1 800 1 902 1 677 -11.8 100Kaolin T 32 523 0 0 -- 0Dolomie T 7 506 1 110 2 257 103.3 100Blocs <strong>de</strong> marbre M 3 9 996 10 461 10 739 2.7 99.1Dérivés <strong>de</strong> marbre T 135 715 146 279 122 520 -16.2 97Sable naturel <strong>de</strong> construction M 3 -- 390 840 539 012 37.9 17.7A partir du tableau ci-<strong><strong>de</strong>s</strong>sus on constate que : les phosphates, la bentonite, le kieselguhr,la dolomie, le marbre en blocs <strong>et</strong> les dérivés <strong>de</strong> marbre, contribuent pour une part importantedans la production <strong><strong>de</strong>s</strong> entreprises publiques.Il en est <strong>de</strong> même pour la baryte <strong>et</strong> le carbonate <strong>de</strong> calcium, dont les parts s’élèventrespectivement à 87.9% <strong>et</strong> 67.5% <strong>de</strong> la production nationale.Année <strong>2008</strong>56