Profil statistique de l'habitation : Saguenay - Lac-Saint-Jean
Profil statistique de l'habitation : Saguenay - Lac-Saint-Jean
Profil statistique de l'habitation : Saguenay - Lac-Saint-Jean

Create successful ePaper yourself
Turn your PDF publications into a flip-book with our unique Google optimized e-Paper software.
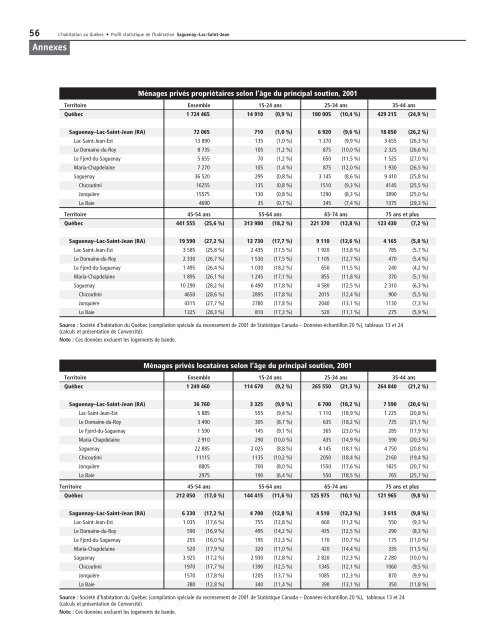
56 L’habitation au Québec • <strong>Profil</strong> <strong>statistique</strong> <strong>de</strong> l’habitation <strong>Saguenay</strong>–<strong>Lac</strong>-<strong>Saint</strong>-<strong>Jean</strong>AnnexesiMénages privés propriétaires selon l’âge du principal soutien, 2001Territoire Ensemble 15-24 ans 25-34 ans 35-44 ansQuébec 1 724 465 14 910 (0,9 %) 180 005 (10,4 %) 429 215 (24,9 %)<strong>Saguenay</strong>–<strong>Lac</strong>-<strong>Saint</strong>-<strong>Jean</strong> (RA) 72 065 710 (1,0 %) 6 920 (9,6 %) 18 850 (26,2 %)<strong>Lac</strong>-<strong>Saint</strong>-<strong>Jean</strong>-Est 13 890 135 (1,0 %) 1 370 (9,9 %) 3 655 (26,3 %)Le Domaine-du-Roy 8 735 105 (1,2 %) 875 (10,0 %) 2 325 (26,6 %)Le Fjord-du-<strong>Saguenay</strong> 5 655 70 (1,2 %) 650 (11,5 %) 1 525 (27,0 %)Maria-Chap<strong>de</strong>laine 7 270 105 (1,4 %) 875 (12,0 %) 1 930 (26,5 %)<strong>Saguenay</strong> 36 520 295 (0,8 %) 3 145 (8,6 %) 9 410 (25,8 %)Chicoutimi 16255 135 (0,8 %) 1510 (9,3 %) 4145 (25,5 %)Jonquière 15575 130 (0,8 %) 1290 (8,3 %) 3890 (25,0 %)La Baie 4690 35 (0,7 %) 345 (7,4 %) 1375 (29,3 %)Territoire 45-54 ans 55-64 ans 65-74 ans 75 ans et plusQuébec 441 555 (25,6 %) 313 980 (18,2 %) 221 370 (12,8 %) 123 430 (7,2 %)<strong>Saguenay</strong>–<strong>Lac</strong>-<strong>Saint</strong>-<strong>Jean</strong> (RA) 19 590 (27,2 %) 12 730 (17,7 %) 9 110 (12,6 %) 4 165 (5,8 %)<strong>Lac</strong>-<strong>Saint</strong>-<strong>Jean</strong>-Est 3 585 (25,8 %) 2 435 (17,5 %) 1 920 (13,8 %) 785 (5,7 %)Le Domaine-du-Roy 2 330 (26,7 %) 1 530 (17,5 %) 1 105 (12,7 %) 470 (5,4 %)Le Fjord-du-<strong>Saguenay</strong> 1 495 (26,4 %) 1 030 (18,2 %) 650 (11,5 %) 240 (4,2 %)Maria-Chap<strong>de</strong>laine 1 895 (26,1 %) 1 245 (17,1 %) 855 (11,8 %) 370 (5,1 %)<strong>Saguenay</strong> 10 290 (28,2 %) 6 490 (17,8 %) 4 580 (12,5 %) 2 310 (6,3 %)Chicoutimi 4650 (28,6 %) 2895 (17,8 %) 2015 (12,4 %) 900 (5,5 %)Jonquière 4315 (27,7 %) 2780 (17,8 %) 2040 (13,1 %) 1130 (7,3 %)La Baie 1325 (28,3 %) 810 (17,3 %) 520 (11,1 %) 275 (5,9 %)Source : Société d’habitation du Québec (compilation spéciale du recensement <strong>de</strong> 2001 <strong>de</strong> Statistique Canada – Données-échantillon 20 %), tableaux 13 et 24(calculs et présentation <strong>de</strong> Convercité).Note : Ces données excluent les logements <strong>de</strong> ban<strong>de</strong>.Ménages privés locataires selon l’âge du principal soutien, 2001Territoire Ensemble 15-24 ans 25-34 ans 35-44 ansQuébec 1 249 460 114 670 (9,2 %) 265 550 (21,3 %) 264 840 (21,2 %)<strong>Saguenay</strong>–<strong>Lac</strong>-<strong>Saint</strong>-<strong>Jean</strong> (RA) 36 760 3 325 (9,0 %) 6 700 (18,2 %) 7 590 (20,6 %)<strong>Lac</strong>-<strong>Saint</strong>-<strong>Jean</strong>-Est 5 885 555 (9,4 %) 1 110 (18,9 %) 1 225 (20,8 %)Le Domaine-du-Roy 3 490 305 (8,7 %) 635 (18,2 %) 735 (21,1 %)Le Fjord-du-<strong>Saguenay</strong> 1 590 145 (9,1 %) 365 (23,0 %) 285 (17,9 %)Maria-Chap<strong>de</strong>laine 2 910 290 (10,0 %) 435 (14,9 %) 590 (20,3 %)<strong>Saguenay</strong> 22 885 2 025 (8,8 %) 4 145 (18,1 %) 4 750 (20,8 %)Chicoutimi 11115 1135 (10,2 %) 2050 (18,4 %) 2160 (19,4 %)Jonquière 8805 700 (8,0 %) 1550 (17,6 %) 1825 (20,7 %)La Baie 2975 190 (6,4 %) 550 (18,5 %) 765 (25,7 %)Territoire 45-54 ans 55-64 ans 65-74 ans 75 ans et plusQuébec 212 050 (17,0 %) 144 415 (11,6 %) 125 975 (10,1 %) 121 965 (9,8 %)<strong>Saguenay</strong>–<strong>Lac</strong>-<strong>Saint</strong>-<strong>Jean</strong> (RA) 6 330 (17,2 %) 4 700 (12,8 %) 4 510 (12,3 %) 3 615 (9,8 %)<strong>Lac</strong>-<strong>Saint</strong>-<strong>Jean</strong>-Est 1 035 (17,6 %) 755 (12,8 %) 660 (11,2 %) 550 (9,3 %)Le Domaine-du-Roy 590 (16,9 %) 495 (14,2 %) 435 (12,5 %) 290 (8,3 %)Le Fjord-du-<strong>Saguenay</strong> 255 (16,0 %) 195 (12,3 %) 170 (10,7 %) 175 (11,0 %)Maria-Chap<strong>de</strong>laine 520 (17,9 %) 320 (11,0 %) 420 (14,4 %) 335 (11,5 %)<strong>Saguenay</strong> 3 925 (17,2 %) 2 930 (12,8 %) 2 820 (12,3 %) 2 280 (10,0 %)Chicoutimi 1970 (17,7 %) 1390 (12,5 %) 1345 (12,1 %) 1060 (9,5 %)Jonquière 1570 (17,8 %) 1205 (13,7 %) 1085 (12,3 %) 870 (9,9 %)La Baie 380 (12,8 %) 340 (11,4 %) 390 (13,1 %) 350 (11,8 %)Source : Société d’habitation du Québec (compilation spéciale du recensement <strong>de</strong> 2001 <strong>de</strong> Statistique Canada – Données-échantillon 20 %), tableaux 13 et 24(calculs et présentation <strong>de</strong> Convercité).Note : Ces données excluent les logements <strong>de</strong> ban<strong>de</strong>.