L’habitation au Québec • <strong>Profil</strong> <strong>statistique</strong> <strong>de</strong> l’habitation <strong>Saguenay</strong>–<strong>Lac</strong>-<strong>Saint</strong>-<strong>Jean</strong> 71AnnexesiÂge médian du principal soutien <strong>de</strong> ménage privé locataire selon le genre <strong>de</strong> ménage, 2001FamillesMénagesTerritoire Ensemble Couples sans enfants Couples avec enfantsmonoparentales d’une personneQuébec 44,2 45,6 39,0 41,8 50,5<strong>Saguenay</strong>–<strong>Lac</strong>-<strong>Saint</strong>-<strong>Jean</strong> (RA) 46,2 49,5 37,7 42,3 53,0<strong>Lac</strong>-<strong>Saint</strong>-<strong>Jean</strong>-Est 45,5 49,7 37,1 42,2 51,9Le Domaine-du-Roy 46,1 45,9 36,4 42,4 54,0Le Fjord-du-<strong>Saguenay</strong> 45,0 54,4 34,2 39,7 53,3Maria-Chap<strong>de</strong>laine 47,7 53,3 36,8 45,0 53,1<strong>Saguenay</strong> 46,3 49,3 38,4 42,3 53,1Source : Société d’habitation du Québec (compilation spéciale du recensement <strong>de</strong> 2001 <strong>de</strong> Statistique Canada – Données échantillon 20 %), tableau 6(calculs et présentation <strong>de</strong> Convercité).Note : Ces données excluent les logements <strong>de</strong> ban<strong>de</strong>.TerritoireOccupants estimant que leur logement privé nécessite <strong>de</strong>s réparations majeures,selon la pério<strong>de</strong> <strong>de</strong> construction, 2001Avant 1946 1946 – 1960 1961 – 1970Ensemble Réparations majeures Ensemble Réparations majeures Ensemble Réparations majeuresQuébec 450 210 68 215 (15,2 %) 533 810 57 925 (10,9 %) 505 540 42 140 (8,3 %)<strong>Saguenay</strong>–<strong>Lac</strong>-<strong>Saint</strong>-<strong>Jean</strong> (RA) 14 255 1 935 (13,6 %) 20 730 2 250 (10,9 %) 14 975 1 270 (8,5 %)<strong>Lac</strong>-<strong>Saint</strong>-<strong>Jean</strong>-Est 2 935 495 (16,9 %) 3 850 505 (13,1 %) 2 410 190 (7,9 %)Le Domaine-du-Roy 1 640 230 (14,0 %) 1 910 220 (11,5 %) 1 585 150 (9,5 %)Le Fjord-du-<strong>Saguenay</strong> 785 165 (21,0 %) 1 045 125 (12,0 %) 895 125 (14,0 %)Maria-Chap<strong>de</strong>laine 1 435 150 (10,5 %) 1 795 235 (13,1 %) 1 285 75 (5,8 %)<strong>Saguenay</strong> 7 445 900 (12,1 %) 12 140 1 160 (9,6 %) 8 800 725 (8,2 %)Chicoutimi 2 625 290 (11,0 %) 4 720 485 (10,3 %) 4 365 315 (7,2 %)Jonquière 3 515 455 (12,9 %) 6 070 555 (9,1 %) 3 435 335 (9,8 %)La Baie 1 305 165 (12,6 %) 1 350 120 (8,9 %) 1 000 75 (7,5 %)Territoire1971 – 1980 1981 – 1990 1991 – 2001Ensemble Réparations majeures Ensemble Réparations majeures Ensemble Réparations majeuresQuébec 609 695 40 465 (6,6 %) 529 055 18 255 (3,5 %) 345 615 4 730 (1,4 %)<strong>Saguenay</strong>–<strong>Lac</strong>-<strong>Saint</strong>-<strong>Jean</strong> (RA) 27 300 1 760 (6,4 %) 19 175 580 (3,0 %) 12 390 175 (1,4 %)<strong>Lac</strong>-<strong>Saint</strong>-<strong>Jean</strong>-Est 4 665 320 (6,9 %) 3 435 145 (4,2 %) 2 480 30 (1,2 %)Le Domaine-du-Roy 3 355 280 (8,3 %) 2 200 65 (3,0 %) 1 530 25 (1,6 %)Le Fjord-du-<strong>Saguenay</strong> 2 335 205 (8,8 %) 1 330 30 (2,3 %) 855 10 (1,2 %)Maria-Chap<strong>de</strong>laine 2 720 165 (6,1 %) 1 710 40 (2,3 %) 1 235 25 (2,0 %)<strong>Saguenay</strong> 14 225 790 (5,6 %) 10 510 300 (2,9 %) 6 290 90 (1,4 %)Chicoutimi 7 220 355 (4,9 %) 5 500 130 (2,4 %) 2 940 40 (1,4 %)Jonquière 5 215 320 (6,1 %) 3 745 130 (3,5 %) 2 395 30 (1,3 %)La Baie 1 790 120 (6,7 %) 1 270 40 (3,1 %) 955 20 (2,1 %)Source : Société d’habitation du Québec (compilation spéciale du recensement <strong>de</strong> 2001 <strong>de</strong> Statistique Canada – Données échantillon 20 %), tableaux 13 et 35(calculs et présentation <strong>de</strong> Convercité).Note : Ces données excluent les logements <strong>de</strong> ban<strong>de</strong>.
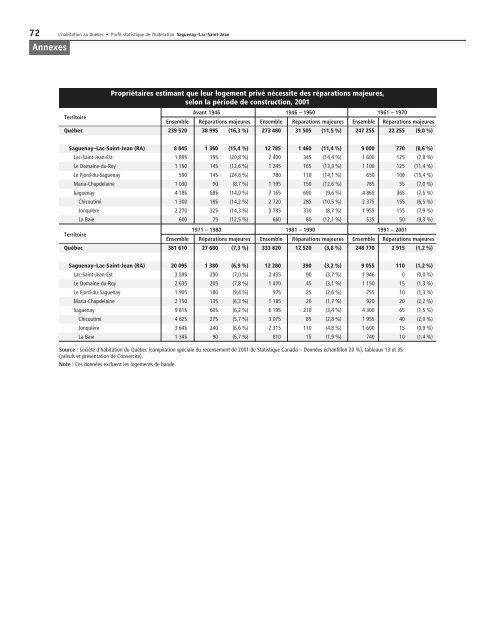
72 L’habitation au Québec • <strong>Profil</strong> <strong>statistique</strong> <strong>de</strong> l’habitation <strong>Saguenay</strong>–<strong>Lac</strong>-<strong>Saint</strong>-<strong>Jean</strong>AnnexesiTerritoirePropriétaires estimant que leur logement privé nécessite <strong>de</strong>s réparations majeures,selon la pério<strong>de</strong> <strong>de</strong> construction, 2001Avant 1946 1946 – 1960 1961 – 1970Ensemble Réparations majeures Ensemble Réparations majeures Ensemble Réparations majeuresQuébec 239 520 38 995 (16,3 %) 273 480 31 505 (11,5 %) 247 255 22 255 (9,0 %)<strong>Saguenay</strong>–<strong>Lac</strong>-<strong>Saint</strong>-<strong>Jean</strong> (RA) 8 845 1 360 (15,4 %) 12 785 1 460 (11,4 %) 9 000 770 (8,6 %)<strong>Lac</strong>-<strong>Saint</strong>-<strong>Jean</strong>-Est 1 895 395 (20,8 %) 2 400 345 (14,4 %) 1 600 125 (7,8 %)Le Domaine-du-Roy 1 150 145 (12,6 %) 1 245 165 (13,3 %) 1 100 125 (11,4 %)Le Fjord-du-<strong>Saguenay</strong> 590 145 (24,6 %) 780 110 (14,1 %) 650 100 (15,4 %)Maria-Chap<strong>de</strong>laine 1 030 90 (8,7 %) 1 195 150 (12,6 %) 785 55 (7,0 %)<strong>Saguenay</strong> 4 185 585 (14,0 %) 7 165 690 (9,6 %) 4 865 365 (7,5 %)Chicoutimi 1 300 185 (14,2 %) 2 720 285 (10,5 %) 2 375 155 (6,5 %)Jonquière 2 270 325 (14,3 %) 3 785 330 (8,7 %) 1 955 155 (7,9 %)La Baie 600 75 (12,5 %) 660 80 (12,1 %) 535 50 (9,3 %)Territoire1971 – 1980 1981 – 1990 1991 – 2001Ensemble Réparations majeures Ensemble Réparations majeures Ensemble Réparations majeuresQuébec 381 610 27 680 (7,3 %) 333 820 12 520 (3,8 %) 248 770 2 915 (1,2 %)<strong>Saguenay</strong>–<strong>Lac</strong>-<strong>Saint</strong>-<strong>Jean</strong> (RA) 20 095 1 380 (6,9 %) 12 280 390 (3,2 %) 9 055 110 (1,2 %)<strong>Lac</strong>-<strong>Saint</strong>-<strong>Jean</strong>-Est 3 595 250 (7,0 %) 2 455 90 (3,7 %) 1 946 0 (0,0 %)Le Domaine-du-Roy 2 635 205 (7,8 %) 1 470 45 (3,1 %) 1 150 15 (1,3 %)Le Fjord-du-<strong>Saguenay</strong> 1 905 180 (9,4 %) 975 25 (2,6 %) 755 10 (1,3 %)Maria-Chap<strong>de</strong>laine 2 150 135 (6,3 %) 1 185 20 (1,7 %) 920 20 (2,2 %)<strong>Saguenay</strong> 9 815 605 (6,2 %) 6 195 210 (3,4 %) 4 300 65 (1,5 %)Chicoutimi 4 825 275 (5,7 %) 3 075 85 (2,8 %) 1 955 40 (2,0 %)Jonquière 3 645 240 (6,6 %) 2 315 110 (4,8 %) 1 600 15 (0,9 %)La Baie 1 345 90 (6,7 %) 810 15 (1,9 %) 740 10 (1,4 %)Source : Société d’habitation du Québec (compilation spéciale du recensement <strong>de</strong> 2001 <strong>de</strong> Statistique Canada – Données échantillon 20 %), tableaux 13 et 35(calculs et présentation <strong>de</strong> Convercité).Note : Ces données excluent les logements <strong>de</strong> ban<strong>de</strong>.