Profil statistique de l'habitation : Saguenay - Lac-Saint-Jean
Profil statistique de l'habitation : Saguenay - Lac-Saint-Jean
Profil statistique de l'habitation : Saguenay - Lac-Saint-Jean

Create successful ePaper yourself
Turn your PDF publications into a flip-book with our unique Google optimized e-Paper software.
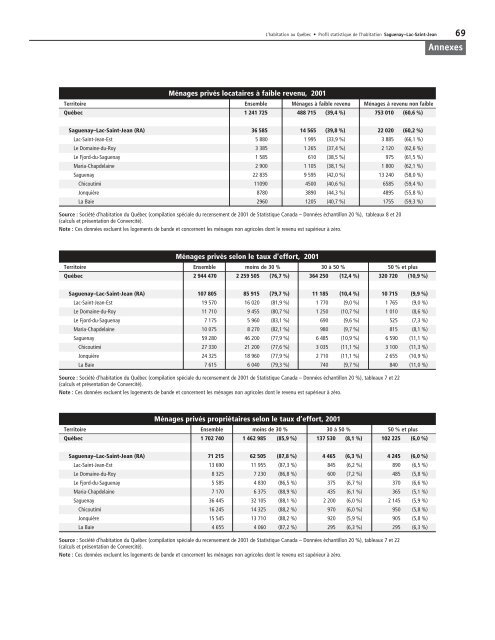
L’habitation au Québec • <strong>Profil</strong> <strong>statistique</strong> <strong>de</strong> l’habitation <strong>Saguenay</strong>–<strong>Lac</strong>-<strong>Saint</strong>-<strong>Jean</strong> 69AnnexesiMénages privés locataires à faible revenu, 2001Territoire Ensemble Ménages à faible revenu Ménages à revenu non faibleQuébec 1 241 725 488 715 (39,4 %) 753 010 (60,6 %)<strong>Saguenay</strong>–<strong>Lac</strong>-<strong>Saint</strong>-<strong>Jean</strong> (RA) 36 585 14 565 (39,8 %) 22 020 (60,2 %)<strong>Lac</strong>-<strong>Saint</strong>-<strong>Jean</strong>-Est 5 880 1 995 (33,9 %) 3 885 (66,1 %)Le Domaine-du-Roy 3 385 1 265 (37,4 %) 2 120 (62,6 %)Le Fjord-du-<strong>Saguenay</strong> 1 585 610 (38,5 %) 975 (61,5 %)Maria-Chap<strong>de</strong>laine 2 900 1 105 (38,1 %) 1 800 (62,1 %)<strong>Saguenay</strong> 22 835 9 595 (42,0 %) 13 240 (58,0 %)Chicoutimi 11090 4500 (40,6 %) 6585 (59,4 %)Jonquière 8780 3890 (44,3 %) 4895 (55,8 %)La Baie 2960 1205 (40,7 %) 1755 (59,3 %)Source : Société d’habitation du Québec (compilation spéciale du recensement <strong>de</strong> 2001 <strong>de</strong> Statistique Canada – Données échantillon 20 %), tableaux 8 et 20(calculs et présentation <strong>de</strong> Convercité).Note : Ces données excluent les logements <strong>de</strong> ban<strong>de</strong> et concernent les ménages non agricoles dont le revenu est supérieur à zéro.Ménages privés selon le taux d’effort, 2001Territoire Ensemble moins <strong>de</strong> 30 % 30 à 50 % 50 % et plusQuébec 2 944 470 2 259 505 (76,7 %) 364 250 (12,4 %) 320 720 (10,9 %)<strong>Saguenay</strong>–<strong>Lac</strong>-<strong>Saint</strong>-<strong>Jean</strong> (RA) 107 805 85 915 (79,7 %) 11 185 (10,4 %) 10 715 (9,9 %)<strong>Lac</strong>-<strong>Saint</strong>-<strong>Jean</strong>-Est 19 570 16 020 (81,9 %) 1 770 (9,0 %) 1 765 (9,0 %)Le Domaine-du-Roy 11 710 9 455 (80,7 %) 1 250 (10,7 %) 1 010 (8,6 %)Le Fjord-du-<strong>Saguenay</strong> 7 175 5 960 (83,1 %) 690 (9,6 %) 525 (7,3 %)Maria-Chap<strong>de</strong>laine 10 075 8 270 (82,1 %) 980 (9,7 %) 815 (8,1 %)<strong>Saguenay</strong> 59 280 46 200 (77,9 %) 6 485 (10,9 %) 6 590 (11,1 %)Chicoutimi 27 330 21 200 (77,6 %) 3 035 (11,1 %) 3 100 (11,3 %)Jonquière 24 325 18 960 (77,9 %) 2 710 (11,1 %) 2 655 (10,9 %)La Baie 7 615 6 040 (79,3 %) 740 (9,7 %) 840 (11,0 %)Source : Société d’habitation du Québec (compilation spéciale du recensement <strong>de</strong> 2001 <strong>de</strong> Statistique Canada – Données échantillon 20 %), tableaux 7 et 22(calculs et présentation <strong>de</strong> Convercité).Note : Ces données excluent les logements <strong>de</strong> ban<strong>de</strong> et concernent les ménages non agricoles dont le revenu est supérieur à zéro.Ménages privés propriétaires selon le taux d’effort, 2001Territoire Ensemble moins <strong>de</strong> 30 % 30 à 50 % 50 % et plusQuébec 1 702 740 1 462 985 (85,9 %) 137 530 (8,1 %) 102 225 (6,0 %)<strong>Saguenay</strong>–<strong>Lac</strong>-<strong>Saint</strong>-<strong>Jean</strong> (RA) 71 215 62 505 (87,8 %) 4 465 (6,3 %) 4 245 (6,0 %)<strong>Lac</strong>-<strong>Saint</strong>-<strong>Jean</strong>-Est 13 690 11 955 (87,3 %) 845 (6,2 %) 890 (6,5 %)Le Domaine-du-Roy 8 325 7 230 (86,8 %) 600 (7,2 %) 485 (5,8 %)Le Fjord-du-<strong>Saguenay</strong> 5 585 4 830 (86,5 %) 375 (6,7 %) 370 (6,6 %)Maria-Chap<strong>de</strong>laine 7 170 6 375 (88,9 %) 435 (6,1 %) 365 (5,1 %)<strong>Saguenay</strong> 36 445 32 105 (88,1 %) 2 200 (6,0 %) 2 145 (5,9 %)Chicoutimi 16 245 14 325 (88,2 %) 970 (6,0 %) 950 (5,8 %)Jonquière 15 545 13 710 (88,2 %) 920 (5,9 %) 905 (5,8 %)La Baie 4 655 4 060 (87,2 %) 295 (6,3 %) 295 (6,3 %)Source : Société d’habitation du Québec (compilation spéciale du recensement <strong>de</strong> 2001 <strong>de</strong> Statistique Canada – Données échantillon 20 %), tableaux 7 et 22(calculs et présentation <strong>de</strong> Convercité).Note : Ces données excluent les logements <strong>de</strong> ban<strong>de</strong> et concernent les ménages non agricoles dont le revenu est supérieur à zéro.