Profil statistique de l'habitation : Saguenay - Lac-Saint-Jean
Profil statistique de l'habitation : Saguenay - Lac-Saint-Jean
Profil statistique de l'habitation : Saguenay - Lac-Saint-Jean

You also want an ePaper? Increase the reach of your titles
YUMPU automatically turns print PDFs into web optimized ePapers that Google loves.
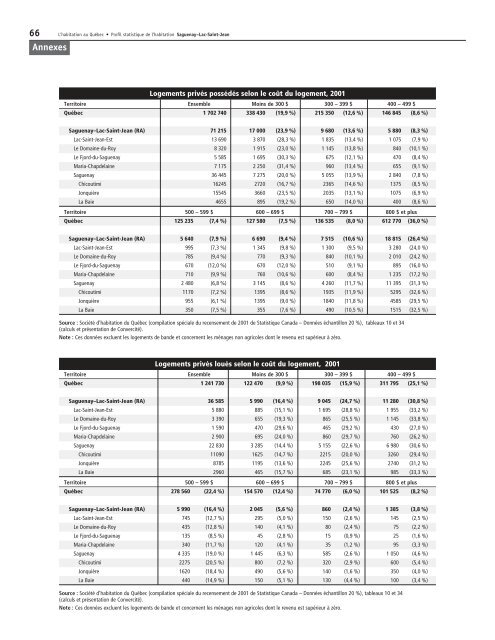
66 L’habitation au Québec • <strong>Profil</strong> <strong>statistique</strong> <strong>de</strong> l’habitation <strong>Saguenay</strong>–<strong>Lac</strong>-<strong>Saint</strong>-<strong>Jean</strong>AnnexesiLogements privés possédés selon le coût du logement, 2001Territoire Ensemble Moins <strong>de</strong> 300 $ 300 – 399 $ 400 – 499 $Québec 1 702 740 338 430 (19,9 %) 215 350 (12,6 %) 146 845 (8,6 %)<strong>Saguenay</strong>–<strong>Lac</strong>-<strong>Saint</strong>-<strong>Jean</strong> (RA) 71 215 17 000 (23,9 %) 9 680 (13,6 %) 5 880 (8,3 %)<strong>Lac</strong>-<strong>Saint</strong>-<strong>Jean</strong>-Est 13 690 3 870 (28,3 %) 1 835 (13,4 %) 1 075 (7,9 %)Le Domaine-du-Roy 8 320 1 915 (23,0 %) 1 145 (13,8 %) 840 (10,1 %)Le Fjord-du-<strong>Saguenay</strong> 5 585 1 695 (30,3 %) 675 (12,1 %) 470 (8,4 %)Maria-Chap<strong>de</strong>laine 7 175 2 250 (31,4 %) 960 (13,4 %) 655 (9,1 %)<strong>Saguenay</strong> 36 445 7 275 (20,0 %) 5 055 (13,9 %) 2 840 (7,8 %)Chicoutimi 16245 2720 (16,7 %) 2365 (14,6 %) 1375 (8,5 %)Jonquière 15545 3660 (23,5 %) 2035 (13,1 %) 1075 (6,9 %)La Baie 4655 895 (19,2 %) 650 (14,0 %) 400 (8,6 %)Territoire 500 – 599 $ 600 – 699 $ 700 – 799 $ 800 $ et plusQuébec 125 235 (7,4 %) 127 580 (7,5 %) 136 535 (8,0 %) 612 770 (36,0 %)<strong>Saguenay</strong>–<strong>Lac</strong>-<strong>Saint</strong>-<strong>Jean</strong> (RA) 5 640 (7,9 %) 6 690 (9,4 %) 7 515 (10,6 %) 18 815 (26,4 %)<strong>Lac</strong>-<strong>Saint</strong>-<strong>Jean</strong>-Est 995 (7,3 %) 1 345 (9,8 %) 1 300 (9,5 %) 3 280 (24,0 %)Le Domaine-du-Roy 785 (9,4 %) 770 (9,3 %) 840 (10,1 %) 2 010 (24,2 %)Le Fjord-du-<strong>Saguenay</strong> 670 (12,0 %) 670 (12,0 %) 510 (9,1 %) 895 (16,0 %)Maria-Chap<strong>de</strong>laine 710 (9,9 %) 760 (10,6 %) 600 (8,4 %) 1 235 (17,2 %)<strong>Saguenay</strong> 2 480 (6,8 %) 3 145 (8,6 %) 4 260 (11,7 %) 11 395 (31,3 %)Chicoutimi 1170 (7,2 %) 1395 (8,6 %) 1935 (11,9 %) 5295 (32,6 %)Jonquière 955 (6,1 %) 1395 (9,0 %) 1840 (11,8 %) 4585 (29,5 %)La Baie 350 (7,5 %) 355 (7,6 %) 490 (10,5 %) 1515 (32,5 %)Source : Société d’habitation du Québec (compilation spéciale du recensement <strong>de</strong> 2001 <strong>de</strong> Statistique Canada – Données échantillon 20 %), tableaux 10 et 34(calculs et présentation <strong>de</strong> Convercité).Note : Ces données excluent les logements <strong>de</strong> ban<strong>de</strong> et concernent les ménages non agricoles dont le revenu est supérieur à zéro.Logements privés loués selon le coût du logement, 2001Territoire Ensemble Moins <strong>de</strong> 300 $ 300 – 399 $ 400 – 499 $Québec 1 241 730 122 470 (9,9 %) 198 035 (15,9 %) 311 795 (25,1 %)<strong>Saguenay</strong>–<strong>Lac</strong>-<strong>Saint</strong>-<strong>Jean</strong> (RA) 36 585 5 990 (16,4 %) 9 045 (24,7 %) 11 280 (30,8 %)<strong>Lac</strong>-<strong>Saint</strong>-<strong>Jean</strong>-Est 5 880 885 (15,1 %) 1 695 (28,8 %) 1 955 (33,2 %)Le Domaine-du-Roy 3 390 655 (19,3 %) 865 (25,5 %) 1 145 (33,8 %)Le Fjord-du-<strong>Saguenay</strong> 1 590 470 (29,6 %) 465 (29,2 %) 430 (27,0 %)Maria-Chap<strong>de</strong>laine 2 900 695 (24,0 %) 860 (29,7 %) 760 (26,2 %)<strong>Saguenay</strong> 22 830 3 285 (14,4 %) 5 155 (22,6 %) 6 980 (30,6 %)Chicoutimi 11090 1625 (14,7 %) 2215 (20,0 %) 3260 (29,4 %)Jonquière 8785 1195 (13,6 %) 2245 (25,6 %) 2740 (31,2 %)La Baie 2960 465 (15,7 %) 685 (23,1 %) 985 (33,3 %)Territoire 500 – 599 $ 600 – 699 $ 700 – 799 $ 800 $ et plusQuébec 278 560 (22,4 %) 154 570 (12,4 %) 74 770 (6,0 %) 101 525 (8,2 %)<strong>Saguenay</strong>–<strong>Lac</strong>-<strong>Saint</strong>-<strong>Jean</strong> (RA) 5 990 (16,4 %) 2 045 (5,6 %) 860 (2,4 %) 1 385 (3,8 %)<strong>Lac</strong>-<strong>Saint</strong>-<strong>Jean</strong>-Est 745 (12,7 %) 295 (5,0 %) 150 (2,6 %) 145 (2,5 %)Le Domaine-du-Roy 435 (12,8 %) 140 (4,1 %) 80 (2,4 %) 75 (2,2 %)Le Fjord-du-<strong>Saguenay</strong> 135 (8,5 %) 45 (2,8 %) 15 (0,9 %) 25 (1,6 %)Maria-Chap<strong>de</strong>laine 340 (11,7 %) 120 (4,1 %) 35 (1,2 %) 95 (3,3 %)<strong>Saguenay</strong> 4 335 (19,0 %) 1 445 (6,3 %) 585 (2,6 %) 1 050 (4,6 %)Chicoutimi 2275 (20,5 %) 800 (7,2 %) 320 (2,9 %) 600 (5,4 %)Jonquière 1620 (18,4 %) 490 (5,6 %) 140 (1,6 %) 350 (4,0 %)La Baie 440 (14,9 %) 150 (5,1 %) 130 (4,4 %) 100 (3,4 %)Source : Société d’habitation du Québec (compilation spéciale du recensement <strong>de</strong> 2001 <strong>de</strong> Statistique Canada – Données échantillon 20 %), tableaux 10 et 34(calculs et présentation <strong>de</strong> Convercité).Note : Ces données excluent les logements <strong>de</strong> ban<strong>de</strong> et concernent les ménages non agricoles dont le revenu est supérieur à zéro.