Profil statistique de l'habitation : Saguenay - Lac-Saint-Jean
Profil statistique de l'habitation : Saguenay - Lac-Saint-Jean
Profil statistique de l'habitation : Saguenay - Lac-Saint-Jean

Create successful ePaper yourself
Turn your PDF publications into a flip-book with our unique Google optimized e-Paper software.
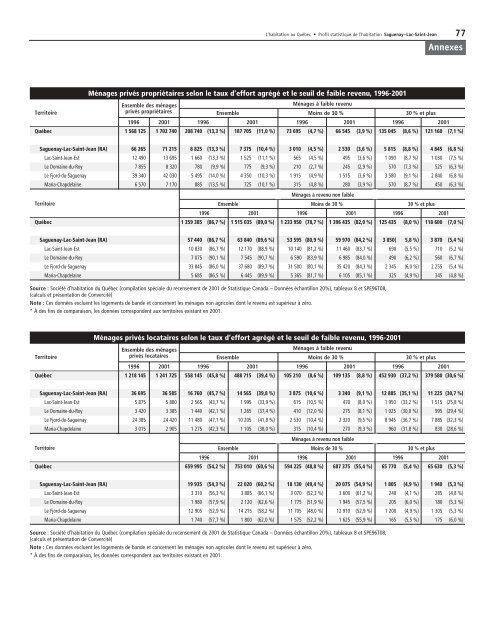
L’habitation au Québec • <strong>Profil</strong> <strong>statistique</strong> <strong>de</strong> l’habitation <strong>Saguenay</strong>–<strong>Lac</strong>-<strong>Saint</strong>-<strong>Jean</strong> 77AnnexesiMénages privés propriétaires selon le taux d’effort agrégé et le seuil <strong>de</strong> faible revenu, 1996-2001Ensemble <strong>de</strong>s ménagesMénages à faible revenuTerritoireprivés propriétaires Ensemble Moins <strong>de</strong> 30 % 30 % et plus1996 2001 1996 2001 1996 2001 1996 2001Québec 1 568 125 1 702 740 208 740 (13,3 %) 187 705 (11,0 %) 73 695 (4,7 %) 66 545 (3,9 %) 135 045 (8,6 %) 121 160 (7,1 %)<strong>Saguenay</strong>-<strong>Lac</strong>-<strong>Saint</strong>-<strong>Jean</strong> (RA) 66 265 71 215 8 825 (13,3 %) 7 375 (10,4 %) 3 010 (4,5 %) 2 530 (3,6 %) 5 815 (8,8 %) 4 845 (6,8 %)<strong>Lac</strong>-<strong>Saint</strong>-<strong>Jean</strong>-Est 12 490 13 695 1 660 (13,3 %) 1 525 (11,1 %) 565 (4,5 %) 495 (3,6 %) 1 090 (8,7 %) 1 030 (7,5 %)Le Domaine-du-Roy 7 855 8 320 780 (9,9 %) 775 (9,3 %) 210 (2,7 %) 245 (2,9 %) 570 (7,3 %) 525 (6,3 %)Le Fjord-du-<strong>Saguenay</strong> 39 340 42 030 5 495 (14,0 %) 4 350 (10,3 %) 1 915 (4,9 %) 1 515 (3,6 %) 3 580 (9,1 %) 2 840 (6,8 %)Maria-Chap<strong>de</strong>laine 6 570 7 170 885 (13,5 %) 725 (10,1 %) 315 (4,8 %) 280 (3,9 %) 570 (8,7 %) 450 (6,3 %)Ménages à revenu non faibleTerritoireEnsemble Moins <strong>de</strong> 30 % 30 % et plus1996 2001 1996 2001 1996 2001Québec 1 359 385 (86,7 %) 1 515 035 (89,0 %) 1 233 950 (78,7 %) 1 396 435 (82,0 %) 125 435 (8,0 %) 118 600 (7,0 %)<strong>Saguenay</strong>-<strong>Lac</strong>-<strong>Saint</strong>-<strong>Jean</strong> (RA) 57 440 (86,7 %) 63 840 (89,6 %) 53 595 (80,9 %) 59 970 (84,2 %) 3 850( 5,8 %) 3 870 (5,4 %)<strong>Lac</strong>-<strong>Saint</strong>-<strong>Jean</strong>-Est 10 830 (86,7 %) 12 170 (88,9 %) 10 140 (81,2 %) 11 460 (83,7 %) 690 (5,5 %) 710 (5,2 %)Le Domaine-du-Roy 7 075 (90,1 %) 7 545 (90,7 %) 6 590 (83,9 %) 6 985 (84,0 %) 490 (6,2 %) 560 (6,7 %)Le Fjord-du-<strong>Saguenay</strong> 33 845 (86,0 %) 37 680 (89,7 %) 31 500 (80,1 %) 35 420 (84,3 %) 2 345 (6,0 %) 2 255 (5,4 %)Maria-Chap<strong>de</strong>laine 5 685 (86,5 %) 6 445 (89,9 %) 5 365 (81,7 %) 6 105 (85,1 %) 325 (4,9 %) 345 (4,8 %)Source : Société d’habitation du Québec (compilation spéciale du recensement <strong>de</strong> 2001 <strong>de</strong> Statistique Canada – Données échantillon 20%), tableaux 8 et SPE96T08,(calculs et présentation <strong>de</strong> Convercité)Note : Ces données excluent les logements <strong>de</strong> ban<strong>de</strong> et concernent les ménages non agricoles dont le revenu est supérieur à zéro.* À <strong>de</strong>s fins <strong>de</strong> comparaison, les données correspon<strong>de</strong>nt aux territoires existant en 2001.Ménages privés locataires selon le taux d’effort agrégé et le seuil <strong>de</strong> faible revenu, 1996-2001Ensemble <strong>de</strong>s ménagesMénages à faible revenuTerritoireprivés locataires Ensemble Moins <strong>de</strong> 30 % 30 % et plus1996 2001 1996 2001 1996 2001 1996 2001Québec 1 218 145 1 241 725 558 145 (45,8 %) 488 715 (39,4 %) 105 210 (8,6 %) 109 135 (8,8 %) 452 930 (37,2 %) 379 580 (30,6 %)<strong>Saguenay</strong>-<strong>Lac</strong>-<strong>Saint</strong>-<strong>Jean</strong> (RA) 36 695 36 585 16 760 (45,7 %) 14 565 (39,8 %) 3 875 (10,6 %) 3 340 (9,1 %) 12 885 (35,1 %) 11 225 (30,7 %)<strong>Lac</strong>-<strong>Saint</strong>-<strong>Jean</strong>-Est 5 875 5 880 2 565 (43,7 %) 1 995 (33,9 %) 615 (10,5 %) 470 (8,0 %) 1 950 (33,2 %) 1 515 (25,8 %)Le Domaine-du-Roy 3 420 3 385 1 440 (42,1 %) 1 265 (37,4 %) 410 (12,0 %) 275 (8,1 %) 1 025 (30,0 %) 995 (29,4 %)Le Fjord-du-<strong>Saguenay</strong> 24 385 24 420 11 480 (47,1 %) 10 205 (41,8 %) 2 530 (10,4 %) 2 320 (9,5 %) 8 945 (36,7 %) 7 885 (32,3 %)Maria-Chap<strong>de</strong>laine 3 015 2 905 1 275 (42,3 %) 1 105 (38,0 %) 315 (10,4 %) 270 (9,3 %) 960 (31,8 %) 830 (28,6 %)Ménages à revenu non faibleTerritoireEnsemble Moins <strong>de</strong> 30 % 30 % et plus1996 2001 1996 2001 1996 2001Québec 659 995 (54,2 %) 753 010 (60,6 %) 594 225 (48,8 %) 687 375 (55,4 %) 65 770 (5,4 %) 65 630 (5,3 %)<strong>Saguenay</strong>-<strong>Lac</strong>-<strong>Saint</strong>-<strong>Jean</strong> (RA) 19 935 (54,3 %) 22 020 (60,2 %) 18 130 (49,4 %) 20 075 (54,9 %) 1 805 (4,9 %) 1 940 (5,3 %)<strong>Lac</strong>-<strong>Saint</strong>-<strong>Jean</strong>-Est 3 310 (56,3 %) 3 885 (66,1 %) 3 070 (52,3 %) 3 600 (61,2 %) 240 (4,1 %) 285 (4,8 %)Le Domaine-du-Roy 1 980 (57,9 %) 2 120 (62,6 %) 1 775 (51,9 %) 1 945 (57,5 %) 205 (6,0 %) 180 (5,3 %)Le Fjord-du-<strong>Saguenay</strong> 12 905 (52,9 %) 14 215 (58,2 %) 11 705 (48,0 %) 12 910 (52,9 %) 1 200 (4,9 %) 1 305 (5,3 %)Maria-Chap<strong>de</strong>laine 1 740 (57,7 %) 1 800 (62,0 %) 1 575 (52,2 %) 1 625 (55,9 %) 165 (5,5 %) 175 (6,0 %)Source : Société d’habitation du Québec (compilation spéciale du recensement <strong>de</strong> 2001 <strong>de</strong> Statistique Canada – Données échantillon 20%), tableaux 8 et SPE96T08,(calculs et présentation <strong>de</strong> Convercité)Note : Ces données excluent les logements <strong>de</strong> ban<strong>de</strong> et concernent les ménages non agricoles dont le revenu est supérieur à zéro.* À <strong>de</strong>s fins <strong>de</strong> comparaison, les données correspon<strong>de</strong>nt aux territoires existant en 2001.