Distarn - La Chambre de Commerce et d'Industrie du Tarn
Distarn - La Chambre de Commerce et d'Industrie du Tarn
Distarn - La Chambre de Commerce et d'Industrie du Tarn

You also want an ePaper? Increase the reach of your titles
YUMPU automatically turns print PDFs into web optimized ePapers that Google loves.
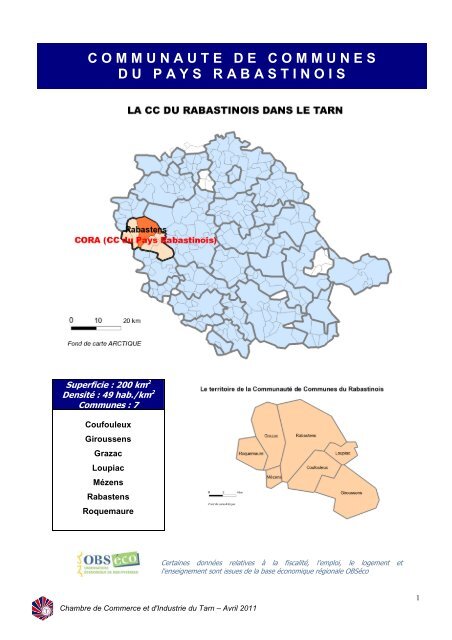
C O M M U N A U T E D E C O M M U N E SD U P A Y S R A B A S T I N O I SSuperficie : 200 km 2Densité : 49 hab./km 2Communes : 7CoufouleuxGiroussensGrazacLoupiacMézensRabastensRoquemaureCertaines données relatives à la fiscalité, l'emploi, le logement <strong>et</strong>l'enseignement sont issues <strong>de</strong> la base économique régionale OBSéco<strong>Chambre</strong> <strong>de</strong> <strong>Commerce</strong> <strong>et</strong> <strong>d'In<strong>du</strong>strie</strong> <strong>du</strong> <strong>Tarn</strong> – Avril 20111
P O P U L A T I O N - D E M O G R A P H I EEVOLUTIONPopulationEvolutionTerritoire1990 1999 2007*Evolution1999/1990Evolution2007/1990Evolution2007/1999CORA 8 023 8 532 9 802 + 6,3 % + 22,2 % + 14,9 %<strong>Tarn</strong> 342 723 343 402 369 189 + 0,2 % + 7,7 % + 7,5 %* <strong>La</strong> population légale millésimée 2007 est entrée en vigueur au 1 er janvier 2010.<strong>La</strong> population r<strong>et</strong>enue ici est la population municipale qui comprend : les personnes ayant leur rési<strong>de</strong>nce habituelle sur l<strong>et</strong>erritoire <strong>de</strong> la commune, dans un logement ou une communauté, les personnes détenues dans les établissementspénitentiaires <strong>de</strong> la commune, les personnes sans-abri <strong>et</strong> les personnes résidant habituellement dans une habitationmobile recensée sur le territoire <strong>de</strong> la commune. Le concept <strong>de</strong> population municipale correspond désormais à lanotion <strong>de</strong> population utilisée en statistique. En eff<strong>et</strong>, elle ne comporte pas <strong>de</strong> doubles comptes : chaque personnevivant en France est comptée une fois <strong>et</strong> une seule.VARIATIONTerritoireSol<strong>de</strong> naturel1999-2007Sol<strong>de</strong> migratoire1999-2007Variation totale1999-2007CORA + 162 + 1 108 + 1 270<strong>Tarn</strong> - 1 627 + 27 318 + 25 691Source : INSEE Midi-Pyrénées – Recensement 2007<strong>Chambre</strong> <strong>de</strong> <strong>Commerce</strong> <strong>et</strong> <strong>d'In<strong>du</strong>strie</strong> <strong>du</strong> <strong>Tarn</strong> – Avril 20112
REPARTITION PAR SEXE ET AGERépartition parTerritoiresexeHommes FemmesPopulationTotaleRépartition par tranche d’âge0/19 20/39 40/59 60/74 75 ansCORA 4 814 4 983 9 797 2 399 2 199 2 806 1 360 1 033MENAGES PAR TAILLE en 2007CORA<strong>Tarn</strong>Taille <strong>de</strong>s ménagesNombre Part Nombre Part1 personne 981 25 % 49 211 31 %2 personnes 1 457 36 % 58 565 37 %3 personnes 715 18 % 24 444 15 %4 personnes 605 15 % 19 585 12 %5 personnes 192 5 % 5 839 4 %6 personnes <strong>et</strong> plus 50 1 % 1 931 1 %Ensemble Ménages 4 000 159 5751 6001 5001 4001 3001 2001 1001 0009008007006005004003002001000Evolution <strong>du</strong> nombre <strong>de</strong> ménages par taille1990199920071 2 3 4 5 6 <strong>et</strong> plusNombre <strong>de</strong> personnes par ménagePOPULATION ACTIVETerritoirePopulation activeHommes Femmes TotalTauxd’activitéen %ActifsoccupésTauxd’emploien %CORA 2 400 2 120 4 520 75,2 4 148 69,0<strong>Tarn</strong> 83 378 76 480 159 858 70,5 141 367 62,4DEPLACEMENTS DOMICILE - TRAVAILTerritoireDans lacommune <strong>de</strong>rési<strong>de</strong>nceDans une autrecommune <strong>du</strong>départementDans un autredépartement<strong>de</strong> la régionHors régionen FranceTotal<strong>de</strong>s actifsoccupésCORA 1 080 1 600 1 422 68 4 170Part <strong>de</strong> chaque lieu 25,9 % 38,4 % 34,1 % 1,6 %Source : INSEE Midi-Pyrénées – Recensement 2007<strong>Chambre</strong> <strong>de</strong> <strong>Commerce</strong> <strong>et</strong> <strong>d'In<strong>du</strong>strie</strong> <strong>du</strong> <strong>Tarn</strong> – Avril 20113
POPULATION DE 15 ANS ET PLUS PAR CATEGORIE SOCIOPROFESSIONNELLECatégoriesPopulation <strong>de</strong> 15 ans <strong>et</strong> +Part <strong>de</strong> la population âgée <strong>de</strong>Hommes Femmes Ensemble 15-24 ans 25-54 ans 55 ans <strong>et</strong> +Agriculteurs exploitants 91 44 135 0,0 % 2,6 % 0,9 %Artisans, commerçants <strong>et</strong>chefs d'entreprise 335 88 423 0,9 % 9,1 % 1,5 %Cadres <strong>et</strong> professionsintellectuelles supérieures 415 190 605 1,0 % 12,1 % 3,5 %Professions intermédiaires 516 709 1 225 8,3 % 26,5 % 2,5 %Employés 199 916 1 115 14,3 % 22,5 % 2,5 %Ouvriers 830 99 929 20,6 % 16,6 % 2,5 %R<strong>et</strong>raités 1 133 1 241 2 374 0,0 % 1,1 % 77,5 %Autres personnes sansactivité professionnelle 350 780 1 130 54,9 % 9,6 % 9,0 %TOTAL 3 868 4 068 7 936Source : INSEE Midi-Pyrénées – Recensement 2007Catégories socioprofessionnelles - CORA14 %Agriculteurs exploitants2 %5%8 %Artisans, commerçantsCadres prof.intellectuelles16 %Catégories socioprofessionnelles<strong>Tarn</strong>2 % 4 %5%12 %15%Professions intermédiairesEmployés3 0 %Ouvriers3 2 %16 %14 %R<strong>et</strong>raités12 %Autres sans activité13 %POPULATION DE 15 ANS ET PLUS PAR NIVEAU DE FORMATIONAucun diplômeCEPCORABEPCCAP BEPBAC Brev<strong>et</strong>ProfessionnelDiplôme universitaire1er cycleDiplôme universitaire2ème ou 3ème cycle12%15%13%24%17%13%6%<strong>Chambre</strong> <strong>de</strong> <strong>Commerce</strong> <strong>et</strong> <strong>d'In<strong>du</strong>strie</strong> <strong>du</strong> <strong>Tarn</strong> – Avril 20114
A C T I V I T E S E C O N O M I Q U E S1 - LES ETABLISSEMENTS INSCRITS AU RCSETABLISSEMENTS ET SALARIES PAR CATEGORIE ELECTORALECatégorieNombreNombre <strong>de</strong>Partd’établissementssalariésPartCOMMERCE 105 30 % 265 34 %INDUSTRIE 109 31 % 345 44,5 %SERVICES 136 39 % 166 21,5 %TOTAL 350 100 % 776 100 %Source : Fichier CCI <strong>du</strong> <strong>Tarn</strong> – Janvier 2011ETABLISSEMENTS SELON L’AGE DU DIRIGEANTDirigeants ayantmoins <strong>de</strong> 40 ansDirigeants ayant <strong>de</strong> 40à 55 ansDirigeants ayant 56ans <strong>et</strong> plusEnsemble <strong>de</strong>sdirigeants83 182 85 359ETABLISSEMENTS SELON LA TAILLE IMMATRICULATIONS/RADIATIONS - 2009Tranche <strong>de</strong> salariés ETSDe 0 à 2 salariés 270Catégorie Immat. Radiations Sol<strong>de</strong>De 3 à 5 salariés 38 <strong>Commerce</strong> 14 13 + 1De 6 à 9 salariés 21 In<strong>du</strong>strie 13 12 + 1De 10 à 49 salariés 21 Services 13 11 + 2Total 350 Total 40 36 + 4Source : Fichier CCI <strong>du</strong> <strong>Tarn</strong> – Janvier 2011<strong>Chambre</strong> <strong>de</strong> <strong>Commerce</strong> <strong>et</strong> <strong>d'In<strong>du</strong>strie</strong> <strong>du</strong> <strong>Tarn</strong> – Avril 20115
ZOOM SUR LES SECTEURS D’ACTIVITE DU RCSI N D U S T R I ESecteur d'activité Ets Part Sal. PartAgriculture 5 5 % 3 1 %Agroalimentaire 3 3 % 47 14 %Bois meubles 4 4 % 8 2 %Imprimerie 2 2 % 2 1 %Chimie parachimie plastique 3 3 % 8 2 %Extraction pierre & matériaux 3 3 % 9 3 %Métal - mécatronique 17 15 % 123 35 %Energie environnement déch<strong>et</strong>s 24 21 % 22 6 %Construction <strong>et</strong> travaux publics 50 44 % 123 36 %Ensemble in<strong>du</strong>strie 111 100 % 345 100 %C O M M E R C ESecteur d'activité Ets Part Sal. Part<strong>Commerce</strong> lié au véhicule 8 8 % 17 6 %<strong>Commerce</strong> <strong>de</strong> gros 19 18 % 59 21 %Hypers <strong>et</strong> supers 3 3 % 52 20 %<strong>Commerce</strong> alimentaire 23 21 % 29 11 %Equipement <strong>de</strong> la maison 23 21 % 26 10 %Equipement <strong>de</strong> la personne 5 5 % 0 0 %Culture <strong>et</strong> loisirs 2 2 % 15 5 %Hygiène soins santé 8 8 % 34 13 %Restauration débits <strong>de</strong> boissons 15 14 % 36 14 %Ensemble commerce 106 100 % 265 100 %S E R V I C E SSecteur d'activité Ets Part Sal. PartTransports 13 10 % 57 34 %Hôtels 6 5 % 3 2 %Edition - information <strong>et</strong> communication 2 2 % 1 1 %Banques <strong>et</strong> assurances 12 9 % 26 16 %Immobilier 17 12 % 0 0 %Services a l’entreprise 57 42 % 42 25 %Enseignement 2 2 % 2 1 %Santé humaine action sociale 4 2 % 18 11 %Loisirs activités récréatives 2 3 % 3 2 %Services personnels 18 13 % 14 8 %Ensemble <strong>de</strong>s services 133 100 % 166 100 %Source : Fichier CCI <strong>du</strong> <strong>Tarn</strong> – Janvier 2011<strong>Chambre</strong> <strong>de</strong> <strong>Commerce</strong> <strong>et</strong> <strong>d'In<strong>du</strong>strie</strong> <strong>du</strong> <strong>Tarn</strong> – Avril 20116
LES 10 PLUS GRANDS ETABLISSEMENTS DU TERRITOIRERaison sociale Ville Activité SalariésSAS Freyssin<strong>et</strong> Aéro Equipement Coufouleux Mécanique in<strong>du</strong>strielle 47Fabrication in<strong>du</strong>strielle <strong>de</strong> pain <strong>et</strong>Sté Nouvelle <strong>de</strong> Panification - SNP Coufouleux pâtisserie 46Sté Nouvelle BPM Coufouleux Fabrication <strong>de</strong> structures métalliques 31<strong>La</strong>vira - Intermarché Rabastens Supermarché 26Fournitures <strong>et</strong> équipementsSté Viguier ManutentionGiroussens in<strong>du</strong>striels 25<strong>Distarn</strong> – Carrefour Contact Rabastens Supermarché 19Construction <strong>et</strong> BâtimentIn<strong>du</strong>striel Coufouleux Construction d’ensembles in<strong>du</strong>striels 18SARL Rabastens Tourisme Rabastens Transports routiers <strong>de</strong> voyageurs 18EURL Ferri FranceRabastens<strong>Commerce</strong> <strong>de</strong> gros <strong>de</strong> matérielagricole 13EURL Récupération <strong>de</strong> ChiffonsEuropéens Rabastens Récupération <strong>de</strong> déch<strong>et</strong>s triés 12Source : Fichier CCI <strong>du</strong> <strong>Tarn</strong> – Janvier 20112 - ENTREPRISES ARTISANALES PAR SECTEURSSecteur d'activité Ets SalAlimentation 17 42Travail <strong>de</strong>s métaux 10 38Textile-cuir-habillement 1 0Bois <strong>et</strong> ameublement 8 15Autres fabrications 20 60Bâtiment 106 125Réparations-transportsautresservices 47 82Entreprises artisanales par secteurs d'activité en200922%8%5%0%4%10%AlimentationTravail <strong>de</strong>s métauxHabillement Textile CuirBois <strong>et</strong> ameublementAutres fabricationsTOTAL 209 362Source : Répertoire <strong>de</strong>s Métiers – Déc. 200951%BâtimentRéparationstransportsTerritoire3 - ENTREPRISES AGRICOLESNombreExploitations1988NombreExploitations2000Evolution1988/2000CORA 418 280 - 33 %<strong>Tarn</strong> 12 042 7 674 - 36 %Source : Recensement agricole 20004 - LES PROFESSIONS LIBERALESTerritoire 2004 2008Evolution2004-2008CORA 77 130 + 69 %<strong>Tarn</strong> 2 771 3 935 + 42 %Source : Fichier SIRENE (INSEE)<strong>Chambre</strong> <strong>de</strong> <strong>Commerce</strong> <strong>et</strong> <strong>d'In<strong>du</strong>strie</strong> <strong>du</strong> <strong>Tarn</strong> – Avril 20117
E M P L O IREPARTITION DES EMPLOIS SELON LE SECTEUR D’ACTIVITESecteur d’activité2005 2007 2009 (p)Salariés Part Salariés Part Salariés PartEvolution2005-2009In<strong>du</strong>strie 392 39% 381 35% 256 28% - 34,7 %Construction 125 12% 148 14% 105 11% - 16,0 %<strong>Commerce</strong> 186 18% 207 19% 211 23% + 13,4 %Services 312 31% 340 32% 354 38% + 13,5 %TOTAL C2A 1 015 100% 1 076 100% 926 100% - 8,8 %Source : ASSEDIC <strong>du</strong> <strong>Tarn</strong> – 2009 données provisoiresDEMANDEURS D’EMPLOISexeCORA<strong>Tarn</strong>4 ème tr. 2009 4 ème tr. 2010 4 ème tr. 2009 4 ème tr. 2010Hommes 204 203 8 175 8 474Femmes 197 220 7 449 7 948T o t a l 401 423 15 624 16 423Dont moins <strong>de</strong> 25 ans 75 65 3 135 3 178Source : DRTEFP - Midi-PyrénéesF I S C A L I T EREPARTITION DES IMPOTS LOCAUXRec<strong>et</strong>tes fiscales <strong>de</strong> la CORA8%27%Taxe d'habitationTaxe professionnelleTaxe sur le foncier bâti39%26%Taxe sur le foncier nonbâtiSource : Direction Générale <strong>de</strong>s ImpôtsREVENUS DES MENAGES <strong>et</strong> nature <strong>de</strong>s revenusTerritoireRevenu moyen2009Traitements <strong>et</strong>salaires 2009R<strong>et</strong>raites <strong>et</strong>pensions 2009CORA 21 434 89 395 234 35 108 762Part <strong>de</strong> foyers imposés 50 %<strong>Tarn</strong> 19 899 2 733 883 951 1 505 125 669Part <strong>de</strong> foyers imposés 46 %Source : Direction Générale <strong>de</strong>s Impôts – Année 2009<strong>Chambre</strong> <strong>de</strong> <strong>Commerce</strong> <strong>et</strong> <strong>d'In<strong>du</strong>strie</strong> <strong>du</strong> <strong>Tarn</strong> – Avril 20118
L O G E M E N T - S O C I A LEVOLUTION DU NOMBRE DE LOGEMENTSTerritoireNombre <strong>de</strong> logements1990 1999 2007Evolution1990-2007CORA 3 496 3 736 4 543 + 29,9 %REPARTITION DES LOGEMENTS SELON LA CATEGORIE en 2007Rési<strong>de</strong>nces Rési<strong>de</strong>ncesTerritoireEnsembleprincipales secondairesLogementsvacantsCORA 4 543 3 993 196 351Part par catégorie <strong>de</strong> logement 88 % 4% 8 %Source : INSEE Midi-Pyrénées – Recensement 2007LOGEMENTS AUTORISES PAR TYPE DE CONSTRUCTION2007 2008 2009Logements indivi<strong>du</strong>els 95 102 73Nombre <strong>de</strong> logementsHLM en 2009Logements collectifs 154 31 3Surface totale en m 2 23 663 16 301 9 935 23 logementsSource : DDE <strong>du</strong> <strong>Tarn</strong>CAPACITE D’ACCUEIL DES PERSONNES AGEESType d’hébergementCapacité d’accueilLogement <strong>de</strong> foyer 21SANTENombre <strong>de</strong> mé<strong>de</strong>cinsgénéralistesMaison <strong>de</strong> r<strong>et</strong>raite 97 11E N S E I G N E M E N T & A P P R E N T I S S A G EA P P R E N T I S S A G EEFFECTIFS DES ETABLISSEMENTS SCOLAIRES à la rentrée 2009Ecolematernelle <strong>et</strong>élémentaireCollège Lycée TotalNombre d’Ets 8 2 0 10Nombre d’élèves nc 733 0 733Pas <strong>de</strong> lycée général <strong>et</strong> technologique ou professionnel sur le territoire.Pas <strong>de</strong> contrat d’apprentissage recensé sur ce territoire, ni d’organisme <strong>de</strong> formation àl’apprentissage.<strong>Chambre</strong> <strong>de</strong> <strong>Commerce</strong> <strong>et</strong> <strong>d'In<strong>du</strong>strie</strong> <strong>du</strong> <strong>Tarn</strong> – Avril 20119