Andamento delle IVG nel Lazio - Agenzia di Sanità Pubblica della ...
Andamento delle IVG nel Lazio - Agenzia di Sanità Pubblica della ...
Andamento delle IVG nel Lazio - Agenzia di Sanità Pubblica della ...
- No tags were found...

Create successful ePaper yourself
Turn your PDF publications into a flip-book with our unique Google optimized e-Paper software.
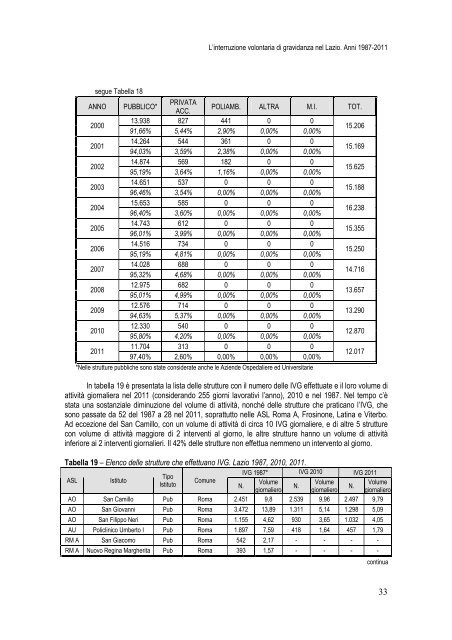
L’interruzione volontaria <strong>di</strong> gravidanza <strong>nel</strong> <strong>Lazio</strong>. Anni 1987-2011segue Tabella 18ANNO200020012002200320042005200620072008200920102011PUBBLICO*PRIVATAACC.POLIAMB. ALTRA M.I. TOT.13.938 827 441 0 091,66% 5,44% 2,90% 0,00% 0,00%15.20614.264 544 361 0 094,03% 3,59% 2,38% 0,00% 0,00%15.16914.874 569 182 0 095,19% 3,64% 1,16% 0,00% 0,00%15.62514.651 537 0 0 096,46% 3,54% 0,00% 0,00% 0,00%15.18815.653 585 0 0 096,40% 3,60% 0,00% 0,00% 0,00%16.23814.743 612 0 0 096,01% 3,99% 0,00% 0,00% 0,00%15.35514.516 734 0 0 095,19% 4,81% 0,00% 0,00% 0,00%15.25014.028 688 0 0 095,32% 4,68% 0,00% 0,00% 0,00%14.71612.975 682 0 0 095,01% 4,99% 0,00% 0,00% 0,00%13.65712.576 714 0 0 094,63% 5,37% 0,00% 0,00% 0,00%13.29012.330 540 0 0 095,80% 4,20% 0,00% 0,00% 0,00%12.87011.704 313 0 0 097,40% 2,60% 0,00% 0,00% 0,00%12.017*Nelle strutture pubbliche sono state considerate anche le Aziende Ospedaliere ed UniversitarieIn tabella 19 è presentata la lista <strong>delle</strong> strutture con il numero <strong>delle</strong> <strong>IVG</strong> effettuate e il loro volume <strong>di</strong>attività giornaliera <strong>nel</strong> 2011 (considerando 255 giorni lavorativi l’anno), 2010 e <strong>nel</strong> 1987. Nel tempo c’èstata una sostanziale <strong>di</strong>minuzione del volume <strong>di</strong> attività, nonché <strong>delle</strong> strutture che praticano l’<strong>IVG</strong>, chesono passate da 52 del 1987 a 28 <strong>nel</strong> 2011, soprattutto <strong>nel</strong>le ASL Roma A, Frosinone, Latina e Viterbo.Ad eccezione del San Camillo, con un volume <strong>di</strong> attività <strong>di</strong> circa 10 <strong>IVG</strong> giornaliere, e <strong>di</strong> altre 5 strutturecon volume <strong>di</strong> attività maggiore <strong>di</strong> 2 interventi al giorno, le altre strutture hanno un volume <strong>di</strong> attivitàinferiore ai 2 interventi giornalieri. Il 42% <strong>delle</strong> strutture non effettua nemmeno un intervento al giorno.Tabella 19 – Elenco <strong>delle</strong> strutture che effettuano <strong>IVG</strong>. <strong>Lazio</strong> 1987, 2010, 2011.<strong>IVG</strong> 1987* <strong>IVG</strong> 2010 <strong>IVG</strong> 2011TipoASLIstitutoComuneIstitutoVolumeVolumeVolumeN.N.N.giornaliero giornaliero giornalieroAO San Camillo Pub Roma 2.451 9,8 2.539 9,96 2.497 9,79AO San Giovanni Pub Roma 3.472 13,89 1.311 5,14 1.298 5,09AO San Filippo Neri Pub Roma 1.155 4,62 930 3,65 1.032 4,05AU Policlinico Umberto I Pub Roma 1.897 7,59 418 1,64 457 1,79RM A San Giacomo Pub Roma 542 2,17 - - - -RM A Nuovo Regina Margherita Pub Roma 393 1,57 - - - -continua33