Relazione tecnica generale degli espropri - Valutazione Ambientale ...
Relazione tecnica generale degli espropri - Valutazione Ambientale ...
Relazione tecnica generale degli espropri - Valutazione Ambientale ...

You also want an ePaper? Increase the reach of your titles
YUMPU automatically turns print PDFs into web optimized ePapers that Google loves.
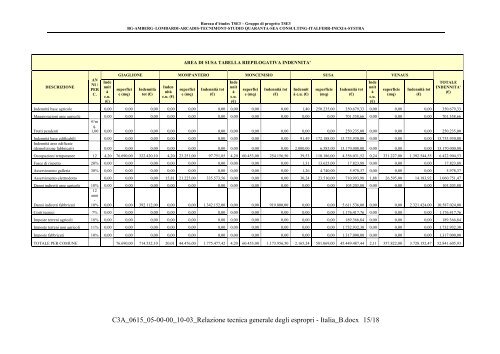
Bureau d’études TSE3 – Gruppo di progetto TSE3BG-AMBERG–LOMBARDI-ARCADIS-TECNIMONT-STUDIO QUARANTA-SEA CONSULTING-ITALFERR-INEXIA-SYSTRAAREA DI SUSA TABELLA RIEPILOGATIVA INDENNITA'DESCRIZIONEANNI /PERC.Indennitàc.u.(€)GIAGLIONE MOMPANTERO MONCENISIO SUSA VENAUSsuperficie (mq)Indennitàtot (€)Indennitàc.u. (€)superficie (mq)Indennità tot(€)Indennitàc.u.(€)superficie (mq)Indennità tot(€)Indennità c.u. (€)superficie(mq)Indennità tot(€)Indennitàc.u.(€)superficie(mq)Indennità tot(€)TOTALEINDENNITA'(€)Indennità base agricole 0,00 0,00 0,00 0,00 0,00 0,00 0,00 0,00 0,00 1,40 250.235,00 350.679,33 0,00 0,00 0,00 350.679,33Maggiorazioni aree agricole 0,00 0,00 0,00 0,00 0,00 0,00 0,00 0,00 0,00 0,00 0,00 701.358,66 0,00 0,00 0,00 701.358,66Frutti pendenti€/mq.1,00 0,00 0,00 0,00 0,00 0,00 0,00 0,00 0,00 0,00 0,00 0,00 250.235,00 0,00 0,00 0,00 250.235,00Indennità base edificabili 0,00 0,00 0,00 0,00 0,00 0,00 0,00 0,00 0,00 91,49 172.188,00 15.753.930,00 0,00 0,00 0,00 15.753.930,00Indennità aree edificate(demolizione fabbricati) 0,00 0,00 0,00 0,00 0,00 0,00 0,00 0,00 0,00 2.000,00 6.585,00 13.170.000,00 0,00 0,00 0,00 13.170.000,00Occupazioni temporanee 12 4,20 76.690,00 322.420,10 4,20 23.251,00 97.751,85 4,20 60.453,00 254.156,50 39,53 110.186,00 4.356.031,52 0,24 331.227,00 1.392.544,55 6.422.904,53Fasce di rispetto 20% 0,00 0,00 0,00 0,00 0,00 0,00 0,00 0,00 0,00 1,31 13.625,00 17.823,88 0,00 0,00 0,00 17.823,88Asservimento galleria 30% 0,00 0,00 0,00 0,00 0,00 0,00 0,00 0,00 0,00 1,26 4.740,00 5.978,37 0,00 0,00 0,00 5.978,37Asservimento elettrodotto 0,00 0,00 0,00 15,81 21.225,00 335.573,56 0,00 0,00 0,00 30,24 23.510,00 710.993,98 1,88 26.595,00 14.183,92 1.060.751,47Danni indiretti aree agricole 10% 0,00 0,00 0,00 0,00 0,00 0,00 0,00 0,00 0,00 0,00 0,00 105.203,80 0,00 0,00 0,00 105.203,80Danni indiretti fabbricati12anni-10% 0,00 0,00 392.112,00 0,00 0,00 1.342.152,00 0,00 0,00 919.800,00 0,00 0,00 5.611.536,00 0,00 0,00 2.321.424,00 10.587.024,00Costi tecnici 7% 0,00 0,00 0,00 0,00 0,00 0,00 0,00 0,00 0,00 0,00 0,00 1.176.417,76 0,00 0,00 0,00 1.176.417,76Imposte terreni agricoli 18% 0,00 0,00 0,00 0,00 0,00 0,00 0,00 0,00 0,00 0,00 0,00 189.366,84 0,00 0,00 0,00 189.366,84Imposte terreni non agricoli 11% 0,00 0,00 0,00 0,00 0,00 0,00 0,00 0,00 0,00 0,00 0,00 1.732.932,30 0,00 0,00 0,00 1.732.932,30Imposte fabbricati 10% 0,00 0,00 0,00 0,00 0,00 0,00 0,00 0,00 0,00 0,00 0,00 1.317.000,00 0,00 0,00 0,00 1.317.000,00TOTALE PER COMUNE 76.690,00 714.532,10 20,01 44.476,00 1.775.477,42 4,20 60.453,00 1.173.956,50 2.165,24 581.069,00 45.449.487,44 2,11 357.822,00 3.728.152,47 52.841.605,93C3A_0615_05-00-00_10-03_<strong>Relazione</strong> <strong>tecnica</strong> <strong>generale</strong> <strong>degli</strong> <strong>espropri</strong> - Italia_B.docx 15/18