the best thesis ever! and here is what happens when its ... - phymbie
the best thesis ever! and here is what happens when its ... - phymbie
the best thesis ever! and here is what happens when its ... - phymbie

Create successful ePaper yourself
Turn your PDF publications into a flip-book with our unique Google optimized e-Paper software.
CHAPTER 3.<br />
RESULTS AND DISCUSSION<br />
Viral titer (TCID 50<br />
/mL)<br />
10 10<br />
10 8<br />
10 6<br />
10 4<br />
10 2<br />
10 0<br />
10 -2<br />
(a)<br />
0 2 4 6 8 10 12 14<br />
Time (days)<br />
1.0<br />
0.8<br />
0.6<br />
0.4<br />
0.2<br />
0.0<br />
Target cell abundance<br />
Viral titer (TCID 50<br />
/mL)<br />
10 10<br />
10 8<br />
10 6<br />
10 4<br />
10 2<br />
10 0<br />
10 -2<br />
(a)<br />
0 2 4 6 8 10 12 14<br />
Time (days)<br />
1.0<br />
0.8<br />
0.6<br />
0.4<br />
0.2<br />
0.0<br />
Target cell abundance<br />
Viral titer (TCID 50<br />
/mL)<br />
10 10<br />
10 8<br />
10 6<br />
10 4<br />
10 2<br />
10 0<br />
10 -2<br />
(a)<br />
0 2 4 6 8 10 12 14<br />
Time (days)<br />
1.0<br />
0.8<br />
0.6<br />
0.4<br />
0.2<br />
0.0<br />
Target cell abundance<br />
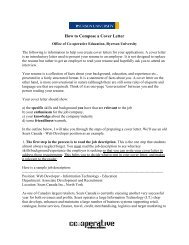
Figure 3.1: An example illustrating how to include figure files. I can not only<br />
d<strong>is</strong>play figures, but I can resize <strong>the</strong>m so <strong>the</strong>y look just right to appear side-by-side. Th<strong>is</strong><br />
<strong>is</strong> how you produce multiple-panel images as a single figure. In addition, if your figure<br />
file <strong>is</strong> generated from some sort of model, you can refer to <strong>the</strong> table w<strong>here</strong> <strong>the</strong> data or<br />
model parameters are l<strong>is</strong>ted. For example, you could say: All parameters are as in Table<br />
3.1.<br />
Parameter<br />
α<br />
β<br />
Value<br />
3.4 ± 0.1 m<br />
3.4 × 10 −2 kg<br />
Table 3.1: Parameters used in our model.<br />
rapidly. From <strong>the</strong>se results, we see that <strong>the</strong>re appears to be a relationship between <strong>the</strong><br />
secondary cells’ susceptibility to infection <strong>and</strong> <strong>the</strong>ir viral production rate which leads to<br />
a s<strong>ever</strong>e <strong>and</strong> sustained infection.<br />
Note that all parameters use to produce our simulations can be found in Table 3.1.<br />
8