DISPERSION OF A GLASS PRISM - Ryerson Department of Physics
DISPERSION OF A GLASS PRISM - Ryerson Department of Physics
DISPERSION OF A GLASS PRISM - Ryerson Department of Physics
- No tags were found...

Create successful ePaper yourself
Turn your PDF publications into a flip-book with our unique Google optimized e-Paper software.
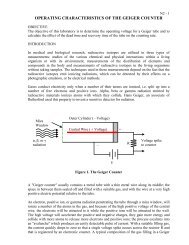
PH2 – page 1<strong>DISPERSION</strong> <strong>OF</strong> A <strong>GLASS</strong> <strong>PRISM</strong>OBJECTIVEThe objective <strong>of</strong> this experiment is to analyze the emission spectrum <strong>of</strong> helium and to analyze thedispersion <strong>of</strong> a glass prism by measuring the index <strong>of</strong> refraction for different colours in thisspectrum.INTRODUCTIONLight is emitted or absorbed when electrons change their orbit within an individual atom. Therefore,a spectrometer can be used to investigate the structure <strong>of</strong> atoms and also to determine which atomsare present in a substance. In this experiment a spectrometer will be used to examine the visiblespectrum emitted by helium in a discharge tube and to determine the index <strong>of</strong> refraction <strong>of</strong> a glassprism as a function <strong>of</strong> the wavelength and the associated dispersion.In principle, a spectrometer is a very simple scientific instrument: It can bend a beam <strong>of</strong> light with aprism. If the beam is composed <strong>of</strong> more than one color <strong>of</strong> light, a spectrum is formed, since thevarious colors are refracted to different angles. The result is a spectral "fingerprint," which carries awealth <strong>of</strong> information about the substance from which the light is emitted.In its simplest form, a spectrometer is nothing more than a prism and a protractor. However, because<strong>of</strong> the need for very sensitive detection and precise measurement, a real spectrometer is a bit morecomplicated. As shown in Figure 1, a spectrometer consists <strong>of</strong> three basic components; a collimator,a prism, and a telescope.AdjustableCollimatorSlitCollimatorAPrismAngle <strong>of</strong>DeviationTelescopeLightSourceEye PieceFigure 1. Spectrometer DiagramThe light to be analyzed enters the collimator through a narrow slit positioned at the focal point <strong>of</strong>the collimator lens. The light leaving the collimator is therefore a thin, parallel beam, which ensuresthat all the light from the slit strikes the prism at the same angle <strong>of</strong> incidence. This is necessary if asharp image is to be formed.The prism bends the beam <strong>of</strong> light. If the beam is composed <strong>of</strong> many different colours, each colour isrefracted to a different angle. The telescope can be rotated to collect the refracted light at veryprecisely measured angles. With the telescope focused at infinity and positioned at an angle tocollect the light <strong>of</strong> a particular color, a precise image <strong>of</strong> the collimator slit can be seen. For example,
PH2 – page 2when the telescope is at one angle <strong>of</strong> rotation, the viewer might see a red image <strong>of</strong> the slit, at anotherangle a green image, and so on. By rotating the telescope, the slit images corresponding to eachconstituent color can be viewed and the angle <strong>of</strong> refraction for each image can be measured.Slit ImageSlit ImageVertical Cross-HairVertical Cross-HairFigure 2. Telescope View at Different AnglesIf the index <strong>of</strong> refraction <strong>of</strong> the prism for each colour in the light is known, then these measuredangles can be used to determine the wavelengths that are present in the light. However, if thewavelengths <strong>of</strong> the colours in the light are known, then the measured angles can be used todetermine the index <strong>of</strong> refraction <strong>of</strong> each colour. For a prism, the angle <strong>of</strong> refraction is not directlyproportional to the wavelength <strong>of</strong> the light.The Angle <strong>of</strong> Minimum DeviationThe angle <strong>of</strong> deviation for light traversing a prism is shown in Figure 3. For each wavelength <strong>of</strong> lighttraversing a given prism, there is a characteristic angle <strong>of</strong> incidence for which the angle <strong>of</strong> deviationis a minimum.Figure 3: Reading the Angle <strong>of</strong> DeviationThis angle depends only on the index <strong>of</strong> refraction <strong>of</strong> the prism and the angle (labeled A in Figure 3)between the two sides <strong>of</strong> the prism traversed by the light. The relationship between these variables isgiven by the equation:(Eq. 1) where n is the index <strong>of</strong> refraction <strong>of</strong> the prism for a given wavelength; A is the angle between thesides <strong>of</strong> the prism traversed by the light; and D min is the angle <strong>of</strong> minimum deviation. Since n varies
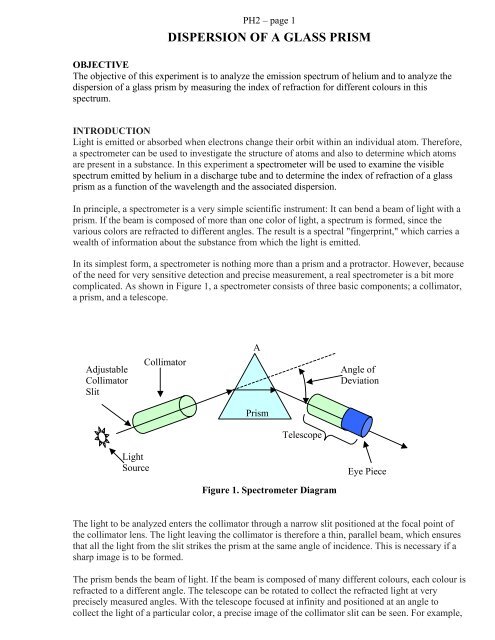
PH2 – page 3with wavelength, the angle <strong>of</strong> minimum deviation also varies, but it is constant for any particularwavelength.EQUIPMENTThe spectrometer includes the following equipment:PrismFigure 4. The SpectrometerCollimator and TelescopeBoth the collimator and the telescope have 178 mm focal length, achromatic objectives, and clearapertures with 32 mm diameters. The telescope has a 15X Ramsden eyepiece with a glass, cross-hairgraticule. The collimator is fitted with a 6 mm long slit <strong>of</strong> adjustable width. Both the collimator andthe telescope are aligned so that their optical axes are perpendicular to their axis <strong>of</strong> rotation.Rotating BasesThe telescope and the spectrometer table are mounted on independently rotating bases. Vernierscales provide measurements <strong>of</strong> the relative positions <strong>of</strong> these bases to within 20 minutes <strong>of</strong> arc (or0.1 degree <strong>of</strong> arc depending on the model; see the two examples reading the vernier below). Therotation <strong>of</strong> each base is controlled with a lock-screw and fine adjust knob (see figure 4 above). Withthe lock-screw released, the base is easily rotated by hand. With the lock-screw tight, the fine adjustknob can be used for more precise positioning.Spectrometer TableThe spectrometer table is fixed to its rotating base with a thumbscrew, so table height is adjustable.Three leveling screws on the underside <strong>of</strong> the table are used to adjust the optical alignment. (Thetable must be level with respect to the optical axes <strong>of</strong> the collimator and telescope if the prism is toretain its alignment for all positions <strong>of</strong> the telescope.) Thumbscrews are used to attach the prismclamp and the grating mount to the table, and reference lines are etched in the table for easyalignment.
PH2 – page 4PRELIMINARY ADJUSTMENTSThe spectrometer may need adjusting before being used. The purpose <strong>of</strong> these preliminaryadjustments is to get parallel rays to pass from the collimator through the prism and to the telescope.FOCUSING THE SPECTROMETERThe next three steps <strong>of</strong> the adjustments must be carried out in the order indicated. Oncecompleted properly, these adjustments should not need further attention for the duration <strong>of</strong>the experiment.(a) ADJUSTMENT <strong>OF</strong> THE CROSS-HAIRSWhile looking through the telescope, slide the eyepiece in and out until the crosshairscome into sharp focus. Loosen the graticule lock ring, and rotate the graticuleuntil one <strong>of</strong> the cross-hairs is vertical. Retighten the lock ring and then refocus ifnecessary.(b) ADJUSTMENT <strong>OF</strong> THE TELESCOPEPoint the telescope toward a distant object. Adjust the focusing screw until the distantobject is seen clearly. There should be no parallax between the cross-hairs and theimage <strong>of</strong> the distant object.(c) ADJUSTMENT <strong>OF</strong> THE COLLIMATORThe collimator resembles the telescope except it carries an adjustable slit at one end.Place a light source close to the slit. Turn the telescope into line with the collimator asin Figure 5. Looking through the telescope, adjust the focus <strong>of</strong> the collimator and, ifnecessary, the rotation <strong>of</strong> the telescope until the slit comes into sharp focus. Thereshould be no parallax between this image <strong>of</strong> the slit and the cross-hairs Do notchange the focus <strong>of</strong> the telescope..Figure 5: Alignment <strong>of</strong> the Telescope directly opposite the CollimatorTighten the telescope rotation lock-screw, then use the fine adjust knob to align the vertical line <strong>of</strong>the graticule with the fixed edge <strong>of</strong> the slit. If the slit is not vertical, loosen the slit lock ring, realignthe slit, and retighten the lock ring. Adjust the slit width for a clear, bright image. Measurements <strong>of</strong>the refraction angle are always made with the graticule line aligned along the fixed edge <strong>of</strong> the slit,so a very narrow slit is not necessarily advantageous.
PH2 – page 5READING THE VERNIER SCALEEXAMPLE 1The vernier in this example will allow you to read the angle to the nearest half a minute. Observethat the main scale divides one complete a revolution into 360°. Each degree on the main scale is inturn divided into three parts (20 minutes each) or two parts (30 minutes each) depending on thespectrometer type. The sliding scale (or the vernier) is used to measure to the nearest minute orbetter. The vernier scale will thus have either 20 or 30 major divisions, and perhaps in betweendivisions indicating half minute readings. The divisions <strong>of</strong> the vernier scale are arranged such that atany given time only one <strong>of</strong> the divisions will be usually perceived as being closest to the perfectalignment with a main scale line. The exception being the first and last vernier lines which can bothalign with the main scale at the same time. To take a reading, first take the main scale readingimmediately bellow the position <strong>of</strong> the zero line <strong>of</strong> the vernier scale. This main scale reading will bea multiple <strong>of</strong> 20 minutes (or 30 minutes for some spectrometers). The vernier scale is then readnoting which line on the vernier scale most closely aligns with a main scale line. The vernier scalereading is then added to the main scale reading. Figure 5 shows an example reading with a vernierscale that is divided into twenty minute divisions with half divisions in between. The main scalereading is to 231° 40 ‘, and the vernier scale reads 12.0’. Thus the complete reading is 231° 52.0’.Closest to perfect alignmentFigure 6: Vernier Reading Example 1Main scale divides one complete revolution into 360 0 and the vernier has 20 major divisionswith half divisions in between. In this example, the vernier line closest to perfect alignmentwith the main scale line reads 12EXAMPLE 2In this model, the main scale is divided into 360 0 and the vernier has 10 divisions. Therefore, youwill be able to read the angle to the nearest 0.1 <strong>of</strong> a degree. Begin by reading the main scale directlybelow zero on the vernier scale: in the example in figure 6 below, this is 19 o ; use the next smallestnumber below the line pointed-to by the small red vertical arrow ↑ in figure 7 below. Next, thefractional part can determined using the vernier’s auxiliary scale. Simply follow the lines across onthe vernier scale (the outside scale) until you locate the only one which best lines-up with a line onthe circular inner scale. In this example, the eighth line (corresponding to 0.8 o ) is best aligned with aline on the inner ring. On either side <strong>of</strong> this line (e.g. 0.7 or 0.9) you’ll see that the lines do notmatch. Finally we add our integer angle <strong>of</strong> 19 o to our vernier reading <strong>of</strong> 0.8 o to get 19.8 o .
PH2 – page 6↑Closest to perfect alignmentFigure 7: Vernier reading, Example 2Main scale divides one complete revolution into 360 0 and the vernier has 10 divisions. Thevernier line closest to perfect alignment with the main scale line reads 0.8PROCEDURE: MEASURING THE ANGLE <strong>OF</strong> MINIMUM DEVIATION1. Place the light source a few centimeters behind the slit <strong>of</strong> the collimator.2. Once you have aligned and focused the spectrometer as described earlier, place the prism on thespectrometer table so that the incident light passes through it. It may be helpful to partiallydarken the room.3. It is generally possible to see the refracted light with the naked eye. Locate the general directionto which the light is refracted, and then align the telescope and spectrometer table base so the slitimage can be viewed through the telescope.4. While looking through the telescope, rotate the spectrometer table slightly back and forth. Noticethat the angle <strong>of</strong> refraction for the spectral line under observation changes. Rotate thespectrometer table until this angle is a minimum, and then rotate the telescope to align thevertical cross-hair with the fixed edge <strong>of</strong> the slit image as in Figure 8 below. Use the fine adjustknobs to make these adjustments as precisely as possible, then measure the telescope angle θ minusing the vernier scale.Slit ImageVertical Cross-HairFigure 8: View through the telescope
PH2 – page 75. Without changing the rotation <strong>of</strong> the spectrometer table, remove the prism and rotate thetelescope to align the cross-hair with the fixed edge <strong>of</strong> the unrefracted beam. Measure the angle θon the vernier scale. The difference between this angle and that recorded for the refractedspectral line in step 4, is the angle <strong>of</strong> minimum deviation. Notice that, since the determination <strong>of</strong>the angle <strong>of</strong> minimum deviation for each spectral line requires rotational adjustments <strong>of</strong> thespectrometer table, the angle <strong>of</strong> the undeflected beam must be remeasured for each line.6. The table below gives the wavelengths (in nm) <strong>of</strong> the spectrum lines that can be seen clearly inthe helium discharge. Record in the same column, the values <strong>of</strong> the θ 0 (the vernier angle with thetelescope and collimator axis aligned), θ min (the vernier reading at minimum deviation).Table <strong>of</strong> observations: Dispersion <strong>of</strong> Helium Light Through A Glass Prism.Colour <strong>of</strong>the Linesin theHeliumDischargeWavelength(nm)weak red 707strong red 668yellow 588green 502blue-green 492blue 471violet 447A ( o ) θ 0 θ minD min =θ min – θ 060 o7. Repeat steps 3 to 5 above for five other lines <strong>of</strong> the spectrum and record your observations in thetable above.DATA ANALYSIS1. For each <strong>of</strong> the analyzed lines calculate the angle <strong>of</strong> minimum deviation D min , and then the index<strong>of</strong> refraction n, <strong>of</strong> the glass <strong>of</strong> the prism to four significant digits using the Eq. 1. Record yourresults in the table above2. Using the values in this table, plot a graph <strong>of</strong> the index <strong>of</strong> refraction vs. the wavelength <strong>of</strong> thesespectral lines. Analyze and comment on the shape <strong>of</strong> this graph.3. Could you use this graph to predict the index <strong>of</strong> refraction <strong>of</strong> the glass prism for a differentcolour, not present in the current spectrum?