Report Guidelines - Ryerson Department of Physics
Report Guidelines - Ryerson Department of Physics
Report Guidelines - Ryerson Department of Physics

You also want an ePaper? Increase the reach of your titles
YUMPU automatically turns print PDFs into web optimized ePapers that Google loves.
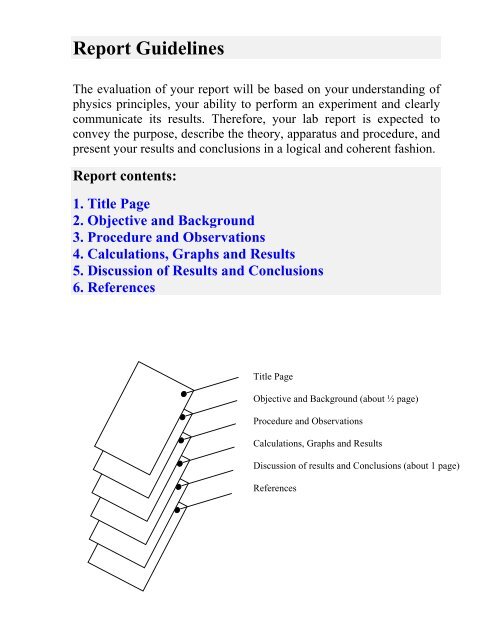
<strong>Report</strong> <strong>Guidelines</strong>The evaluation <strong>of</strong> your report will be based on your understanding <strong>of</strong>physics principles, your ability to perform an experiment and clearlycommunicate its results. Therefore, your lab report is expected toconvey the purpose, describe the theory, apparatus and procedure, andpresent your results and conclusions in a logical and coherent fashion.<strong>Report</strong> contents:1. Title Page2. Objective and Background3. Procedure and Observations4. Calculations, Graphs and Results5. Discussion <strong>of</strong> Results and Conclusions6. ReferencesTitle PageObjective and Background (about ½ page)Procedure and ObservationsCalculations, Graphs and ResultsDiscussion <strong>of</strong> results and Conclusions (about 1 page)References
SAMPLE TITLE PAGERYERSON UNIVERSITYDEPARTMENT OF PHYSICSLAB REPORTFORPCS__________SECTION____________TITLE OF EXPERIMENT: _______________________________________________EXPERIMENTERS:(full names and ID’s)____________________________________________________________________________________________________________________________________________________________________AUTHORS OF THIS REPORT: ____________________________________________________________________________________________________________________________________________________________________EXPERIMENT PERFORMED ON (DATE): __________________________________REPORT SUBMITTED ON (DATE): ________________________________________TA’S NAME: ____________________________________________________________
1. Title Page:This page should clearly display:• The title <strong>of</strong> the experiment• Full names <strong>of</strong> the members <strong>of</strong> your lab group (only the ones with whomyou actually did this experiment). Underline the family name in eachcase.• The date the experiment was performed• The date this report is submitted• The course number and section• TA’s name2. Objective and Background:This section is written to provide the reader with all the background needed to understandyour objectives, results and conclusions. It should answer the following questions: Why hasthe experiment been performed? What was sought? What was measured? What was themotivation? These should be discussed, along with brief supporting theory that was used inthe experiment. The equations in support <strong>of</strong> the physical conditions should be correctlyformatted and numbered. The introduction should provide:• The objective <strong>of</strong> the experiment• Relevant background theory (briefly)• An indication <strong>of</strong> the importance <strong>of</strong> the workOBJECTIVE AND BACKGROUND: TYPICAL MISTAKESHere are typical problems in this section:• The objective is not clearly stated• The symbols are not defined• Equations are incorrectly written or not explained• Background information is missing
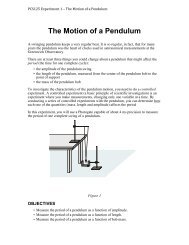
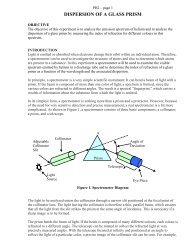
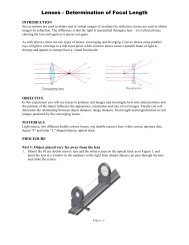
3. Procedure and Observations:A diagram <strong>of</strong> the apparatus is almost always necessary. A schematic diagram or sketch ispreferable to “artistic” diagrams. Write about the general strategy used to obtain the data.Concisely explain the methods employed in measuring the quantities. This implies that theexperimental apparatus should be described along with the data collection techniques.Describe your procedures in detail so that the reader may reproduce your experiment oranalyze potential errors. Usually the steps <strong>of</strong> the procedure are given in a list. If this is toolong it may be broken into stages with steps in each stage. Use past tense, passive voice (e.g.,“the length was measured”, rather than any <strong>of</strong> the following: (i) “we measured the length”,(ii) “we measure the length”, (iii) “we will measure the length”, (iv) “measure the length”,etc…) The intent <strong>of</strong> this section is to:• Use diagram(s) to describe the apparatus/equipment• Indicate the experimental strategy and the procedure followed to obtainthe data so that others can assess the validity <strong>of</strong> the results.• Present all relevant data in table form, with title and column headings.• All observations MUST include units and an estimate <strong>of</strong> the uncertaintyPROCEDURE AND OBSERVATIONS: TYPICAL MISTAKESTypical problems in this section are:• The apparatus and/or procedure are not clearly described.• Diagrams are not labeled and/or numbered.• There are incorrect statements.• Important information and/or details on data acquisition and analysis are missing.• Past tense is not used.• Passive voice is not used.• Observations are stated with improper (or missing) units.• Observations are stated without an estimate <strong>of</strong> the uncertainty.
4. Calculations, Graphs and Results:The method <strong>of</strong> analysis should be described. Tables and/or graphs should be used to displaythe results <strong>of</strong> the experiment. They should be clear and logical and carefully labeled, so thatthe reader can understand them without referring to the text. Therefore, appropriate graphcaptions and table titles should be carefully chosen and these should be used for reference inthe text (e.g., vague graph titles such as "Y vs X" are not acceptable). Each axis on the graphshould be properly scaled and have a label and proper units. When graphs or tables arereferenced, their number rather than their title should do this (e.g. Figure1). When possible, itis suggested that tables and graphs be embedded in the text <strong>of</strong> the report (rather than beingappended at the end) to avoid forcing the reader to flip pages. This section should:• Describe your method(s) <strong>of</strong> analysis <strong>of</strong> the experimental observations.• Give all the intermediate and final results.• Show all relevant tables and graphs illustrating results.• Provide appropriate error analysis unless instructed otherwise.CALCULATIONS, GRAPHS AND RESULTS: TYPICAL MISTAKESHere are typical problems in this section:• The data tables are not properly titled and/or numbered• The data are shown without proper units• Graphs are not titled and/or numbered• Axes <strong>of</strong> the graphs are not labeled and/or units are incorrect or missing• Incorrect type <strong>of</strong> graph is used or information on the graph is not clearly labeled• Calculations are not clearly explained step by step, or even worse, they are missing• There is a clear contradiction between the observed data and the results• The results are given with an incorrect number <strong>of</strong> significant digits• Percentage error/uncertainty is missing
5. Discussion <strong>of</strong> Results And Conclusions:This section is probably the most important one <strong>of</strong> your report and the main reason you arewriting the report. All previous sections are just the foundation, but this section is the realmeasure <strong>of</strong> what you have learned from this experiment and <strong>of</strong> your writing skills. You shouldindicate whether your measurements and/or calculated values make sense. Do they fall withinthe expected range? In case the data or results appear to be outside a reasonable range, pointout what possible problems might have occurred. Point out any real trends, analyze why theyoccur, and explain any significant features or differences from expected results. Summarizereasons for any disagreement between your results and the expected results. When analyzingsources <strong>of</strong> uncertainty and/or error, be specific and avoid using vague phrases such as "humanerror". Present the conclusions you draw from the results. All conclusions should be clearlystated and supported with evidence. Cite specific results and observations from theexperiment and tie them to your conclusions. When appropriate, recommend ways to correctproblems and improve the experiment. This section should:• Discuss the results (range, trends, sources <strong>of</strong> errors)• Present the conclusions you draw from the resultsDISCUSSION OF RESULTS AND CONCLUSIONS:TYPICAL MISTAKESTypical mistakes encountered in this section are:(a) Discussion <strong>of</strong> results:• This section is only a restatement <strong>of</strong> the results from the previous section withoutcommenting on the key expected points• Incorrect or trivial arguments are used (e.g., sources <strong>of</strong> error are not sufficientlyexplained or trivial explanations are <strong>of</strong>fered, such as “old equipment” or “humanerror” are blamed for the poor accuracy)• Suggestions for improving the experiment are missing, are insufficient orinconsequential.(b) Conclusions:• This subsection is merely a repetition <strong>of</strong> the “Discussion <strong>of</strong> Results” part.• A conclusion is drawn, but is not supported by experimental evidence.• No sensible conclusion is drawn• There is no clear evidence <strong>of</strong> a thorough understanding <strong>of</strong> the experiment and/ortheory behind it.
6. References:State complete references to any books, articles, websites, etc. from which you obtainedinformation used in your report. Indicate, in the appropriate places in the body <strong>of</strong> the report,where theses references are being used.GENERAL WRITING MISTAKESSome typical mistakes are:• The text portion <strong>of</strong> the report is not typed (illegible handwriting is not acceptable!).• The sequence <strong>of</strong> the sections is incorrect.• The reference section is missing.• There are grammatical and/or spelling mistakes.• Long, confusing sentences are used instead <strong>of</strong> short and clear ones.Important Notes:A good report will also reflect your ability to clearly communicate results andimportant conclusions to the reader. Therefore, it is important that you use properEnglish grammar and spelling, with clear and short sentences, along with logic andproper style.• The text portion <strong>of</strong> the report must be typed starting each section on a new page.Observations, tables, graphs and formulas may be done NEATLY by hand.• Pro<strong>of</strong>read it carefully.• Be sure to follow explicitly the content guidelines indicated above.• Allow at least two spaces between text and tables or figures.• Avoid being too verbose: be as specific as possible.• The report must be stapled in the upper left-hand corner, or otherwise boundsecurely so it can be read and marked without falling apart. A penalty will beapplied if this requirement is not met.• Plagiarism will never be tolerated: Do not copy material (lab manuals, text books,your partner’s notes, old lab reports, etc…) without citing the source.See: http://www.ryerson.ca/acadcouncil/current/pol60.pdfand: http://www.ryerson.ca/academicintegrity/students.html