PROVNINGSJÃMFÃRELSE 2002 - 3 - ITM
PROVNINGSJÃMFÃRELSE 2002 - 3 - ITM
PROVNINGSJÃMFÃRELSE 2002 - 3 - ITM
Create successful ePaper yourself
Turn your PDF publications into a flip-book with our unique Google optimized e-Paper software.
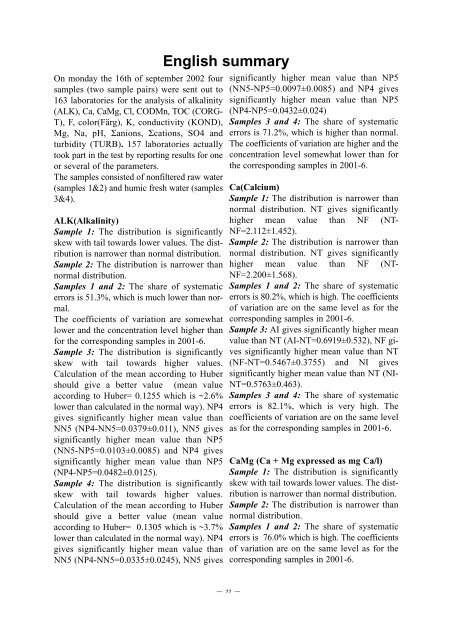
On monday the 16th of september <strong>2002</strong> foursamples (two sample pairs) were sent out to163 laboratories for the analysis of alkalinity(ALK), Ca, CaMg, Cl, CODMn, TOC (CORG-T), F, color(Färg), K, conductivity (KOND),Mg, Na, pH, Σanions, Σcations, SO4 andturbidity (TURB). 157 laboratories actuallytook part in the test by reporting results for oneor several of the parameters.The samples consisted of nonfiltered raw water(samples 1&2) and humic fresh water (samples3&4).ALK(Alkalinity)Sample 1: The distribution is significantlyskew with tail towards lower values. The distributionis narrower than normal distribution.Sample 2: The distribution is narrower thannormal distribution.Samples 1 and 2: The share of systematicerrors is 51.3%, which is much lower than normal.The coefficients of variation are somewhatlower and the concentration level higher thanfor the corresponding samples in 2001-6.Sample 3: The distribution is significantlyskew with tail towards higher values.Calculation of the mean according to Hubershould give a better value (mean valueaccording to Huber= 0.1255 which is ~2.6%lower than calculated in the normal way). NP4gives significantly higher mean value thanNN5 (NP4-NN5=0.0379±0.011), NN5 givessignificantly higher mean value than NP5(NN5-NP5=0.0103±0.0085) and NP4 givessignificantly higher mean value than NP5(NP4-NP5=0.0482±0.0125).Sample 4: The distribution is significantlyskew with tail towards higher values.Calculation of the mean according to Hubershould give a better value (mean valueaccording to Huber= 0.1305 which is ~3.7%lower than calculated in the normal way). NP4gives significantly higher mean value thanNN5 (NP4-NN5=0.0335±0.0245), NN5 givesEnglish summarysignificantly higher mean value than NP5(NN5-NP5=0.0097±0.0085) and NP4 givessignificantly higher mean value than NP5(NP4-NP5=0.0432±0.024)Samples 3 and 4: The share of systematicerrors is 71.2%, which is higher than normal.The coefficients of variation are higher and theconcentration level somewhat lower than forthe corresponding samples in 2001-6.Ca(Calcium)Sample 1: The distribution is narrower thannormal distribution. NT gives significantlyhigher mean value than NF (NT-NF=2.112±1.452).Sample 2: The distribution is narrower thannormal distribution. NT gives significantlyhigher mean value than NF (NT-NF=2.200±1.568).Samples 1 and 2: The share of systematicerrors is 80.2%, which is high. The coefficientsof variation are on the same level as for thecorresponding samples in 2001-6.Sample 3: AI gives significantly higher meanvalue than NT (AI-NT=0.6919±0.532), NF givessignificantly higher mean value than NT(NF-NT=0.5467±0.3755) and NI givessignificantly higher mean value than NT (NI-NT=0.5763±0.463).Samples 3 and 4: The share of systematicerrors is 82.1%, which is very high. Thecoefficients of variation are on the same levelas for the corresponding samples in 2001-6.CaMg (Ca + Mg expressed as mg Ca/l)Sample 1: The distribution is significantlyskew with tail towards lower values. The distributionis narrower than normal distribution.Sample 2: The distribution is narrower thannormal distribution.Samples 1 and 2: The share of systematicerrors is 76.0% which is high. The coefficientsof variation are on the same level as for thecorresponding samples in 2001-6.— 11 —


